University Economics Assignment: Trade, Productivity, and Money Flow
VerifiedAdded on 2023/06/11
|13
|2374
|382
Homework Assignment
AI Summary
This economics assignment delves into various aspects of economic theory and practice. It begins by analyzing the impact of supply and demand shocks on aluminum prices, considering both short-term and long-term trends. The assignment then examines the effects of tariffs on can producers, evaluating changes in consumer and producer surplus. Further analysis is dedicated to the economic consequences of plastic bag usage, including externalities and policy interventions like bans and taxes. The assignment also explores the relationship between labor productivity, capital accumulation, and technological progress. Finally, it investigates the circular flow of money in an economy, discussing the impact of government expenditure, investment, and quantitative easing by the ECB. Each section provides detailed explanations and graphical illustrations to support the analysis. Desklib provides a platform for students to access similar solved assignments and past papers.

Running head: ECONOMICS ASSIGNMENT
Economics Assignment
Name of the student:
Name of the University:
Author note
Economics Assignment
Name of the student:
Name of the University:
Author note
Paraphrase This Document
Need a fresh take? Get an instant paraphrase of this document with our AI Paraphraser
1ECONOMICS ASSIGNMENT
Table of Contents
Answer 1:...................................................................................................................................3
a:.............................................................................................................................................3
b:.............................................................................................................................................4
c:.............................................................................................................................................4
d:.............................................................................................................................................5
Answer 2:...................................................................................................................................6
a:.............................................................................................................................................6
b:.............................................................................................................................................6
c:.............................................................................................................................................7
d:.............................................................................................................................................7
e:.............................................................................................................................................7
Answer 3:...................................................................................................................................8
a:.............................................................................................................................................8
b:.............................................................................................................................................8
c:.............................................................................................................................................8
d:.............................................................................................................................................8
e:.............................................................................................................................................8
Answer 4:...................................................................................................................................9
a:.............................................................................................................................................9
b:.............................................................................................................................................9
c:...........................................................................................................................................10
d:...........................................................................................................................................10
e:...........................................................................................................................................11
Reference:................................................................................................................................12
2ECONOMICS ASSIGNMENT
Answer 1:
a:
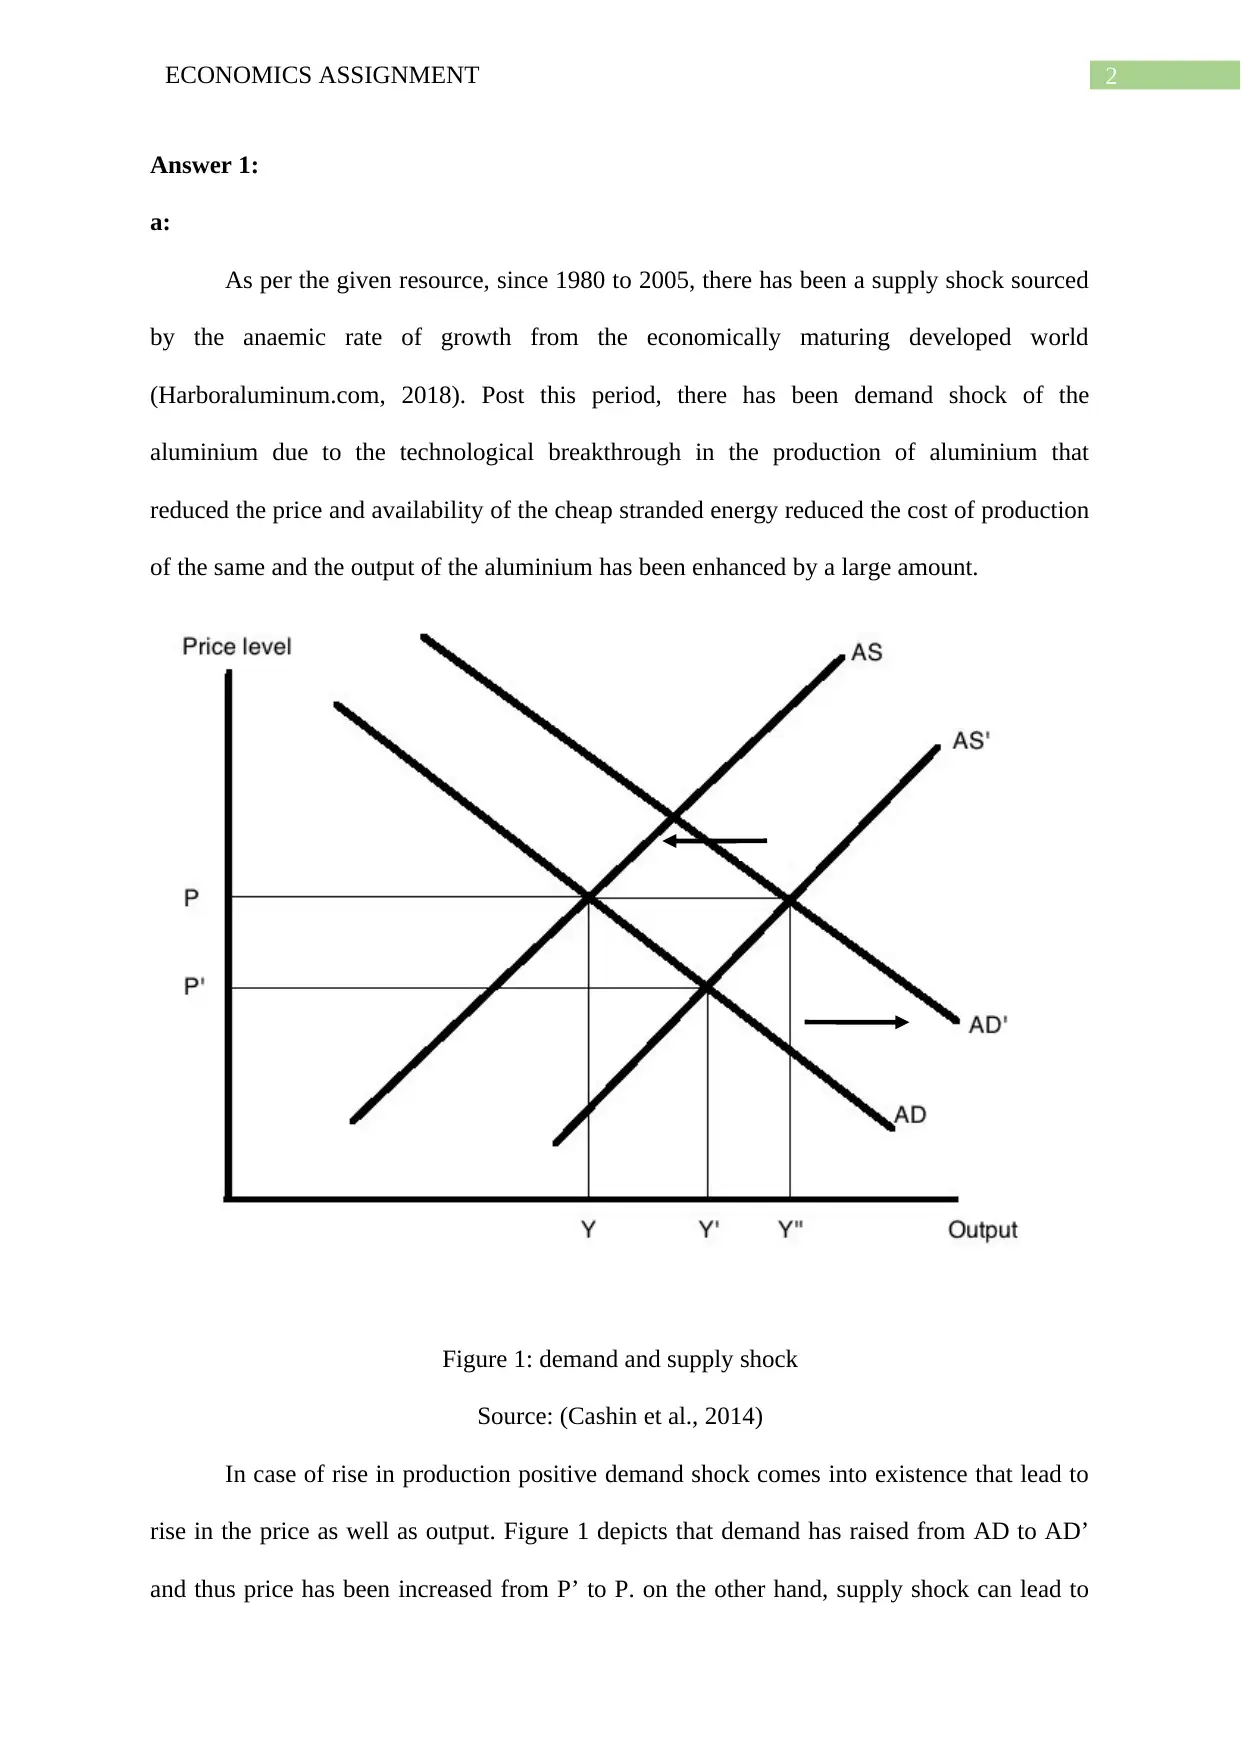
As per the given resource, since 1980 to 2005, there has been a supply shock sourced
by the anaemic rate of growth from the economically maturing developed world
(Harboraluminum.com, 2018). Post this period, there has been demand shock of the
aluminium due to the technological breakthrough in the production of aluminium that
reduced the price and availability of the cheap stranded energy reduced the cost of production
of the same and the output of the aluminium has been enhanced by a large amount.
Figure 1: demand and supply shock
Source: (Cashin et al., 2014)
In case of rise in production positive demand shock comes into existence that lead to
rise in the price as well as output. Figure 1 depicts that demand has raised from AD to AD’
and thus price has been increased from P’ to P. on the other hand, supply shock can lead to
Answer 1:
a:
As per the given resource, since 1980 to 2005, there has been a supply shock sourced
by the anaemic rate of growth from the economically maturing developed world
(Harboraluminum.com, 2018). Post this period, there has been demand shock of the
aluminium due to the technological breakthrough in the production of aluminium that
reduced the price and availability of the cheap stranded energy reduced the cost of production
of the same and the output of the aluminium has been enhanced by a large amount.
Figure 1: demand and supply shock
Source: (Cashin et al., 2014)
In case of rise in production positive demand shock comes into existence that lead to
rise in the price as well as output. Figure 1 depicts that demand has raised from AD to AD’
and thus price has been increased from P’ to P. on the other hand, supply shock can lead to
⊘ This is a preview!⊘
Do you want full access?
Subscribe today to unlock all pages.
Trusted by 1+ million students worldwide
3ECONOMICS ASSIGNMENT
fall in the production that shifts the supply curve from AS’ to AS that will enhance the price
from P’ to P.
As per the given resource, short-term trends are unexpected and comes in the form of
seasonal or cyclical nature, whereas long term trends are seems to have identified price
direction.
b:
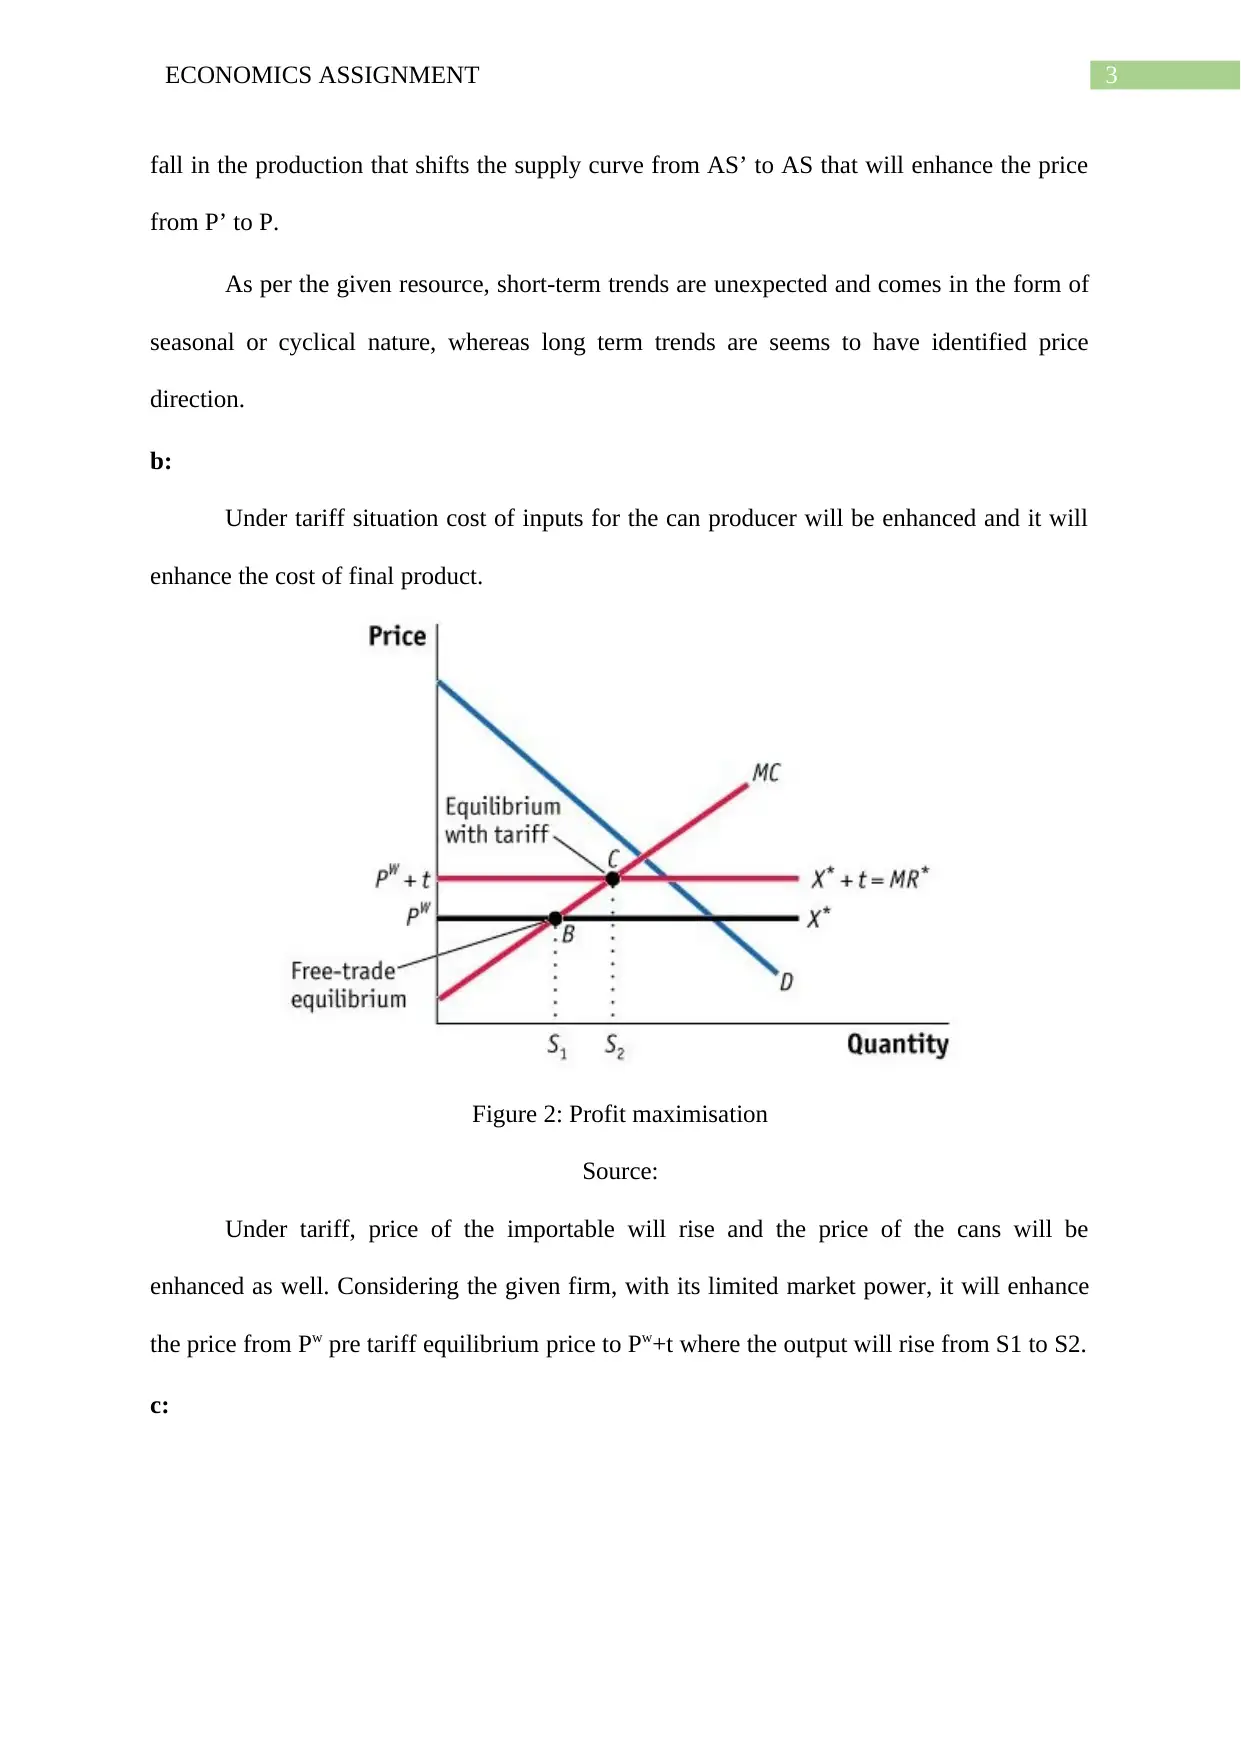
Under tariff situation cost of inputs for the can producer will be enhanced and it will
enhance the cost of final product.
Figure 2: Profit maximisation
Source:
Under tariff, price of the importable will rise and the price of the cans will be
enhanced as well. Considering the given firm, with its limited market power, it will enhance
the price from Pw pre tariff equilibrium price to Pw+t where the output will rise from S1 to S2.
c:
fall in the production that shifts the supply curve from AS’ to AS that will enhance the price
from P’ to P.
As per the given resource, short-term trends are unexpected and comes in the form of
seasonal or cyclical nature, whereas long term trends are seems to have identified price
direction.
b:
Under tariff situation cost of inputs for the can producer will be enhanced and it will
enhance the cost of final product.
Figure 2: Profit maximisation
Source:
Under tariff, price of the importable will rise and the price of the cans will be
enhanced as well. Considering the given firm, with its limited market power, it will enhance
the price from Pw pre tariff equilibrium price to Pw+t where the output will rise from S1 to S2.
c:
Paraphrase This Document
Need a fresh take? Get an instant paraphrase of this document with our AI Paraphraser
4ECONOMICS ASSIGNMENT
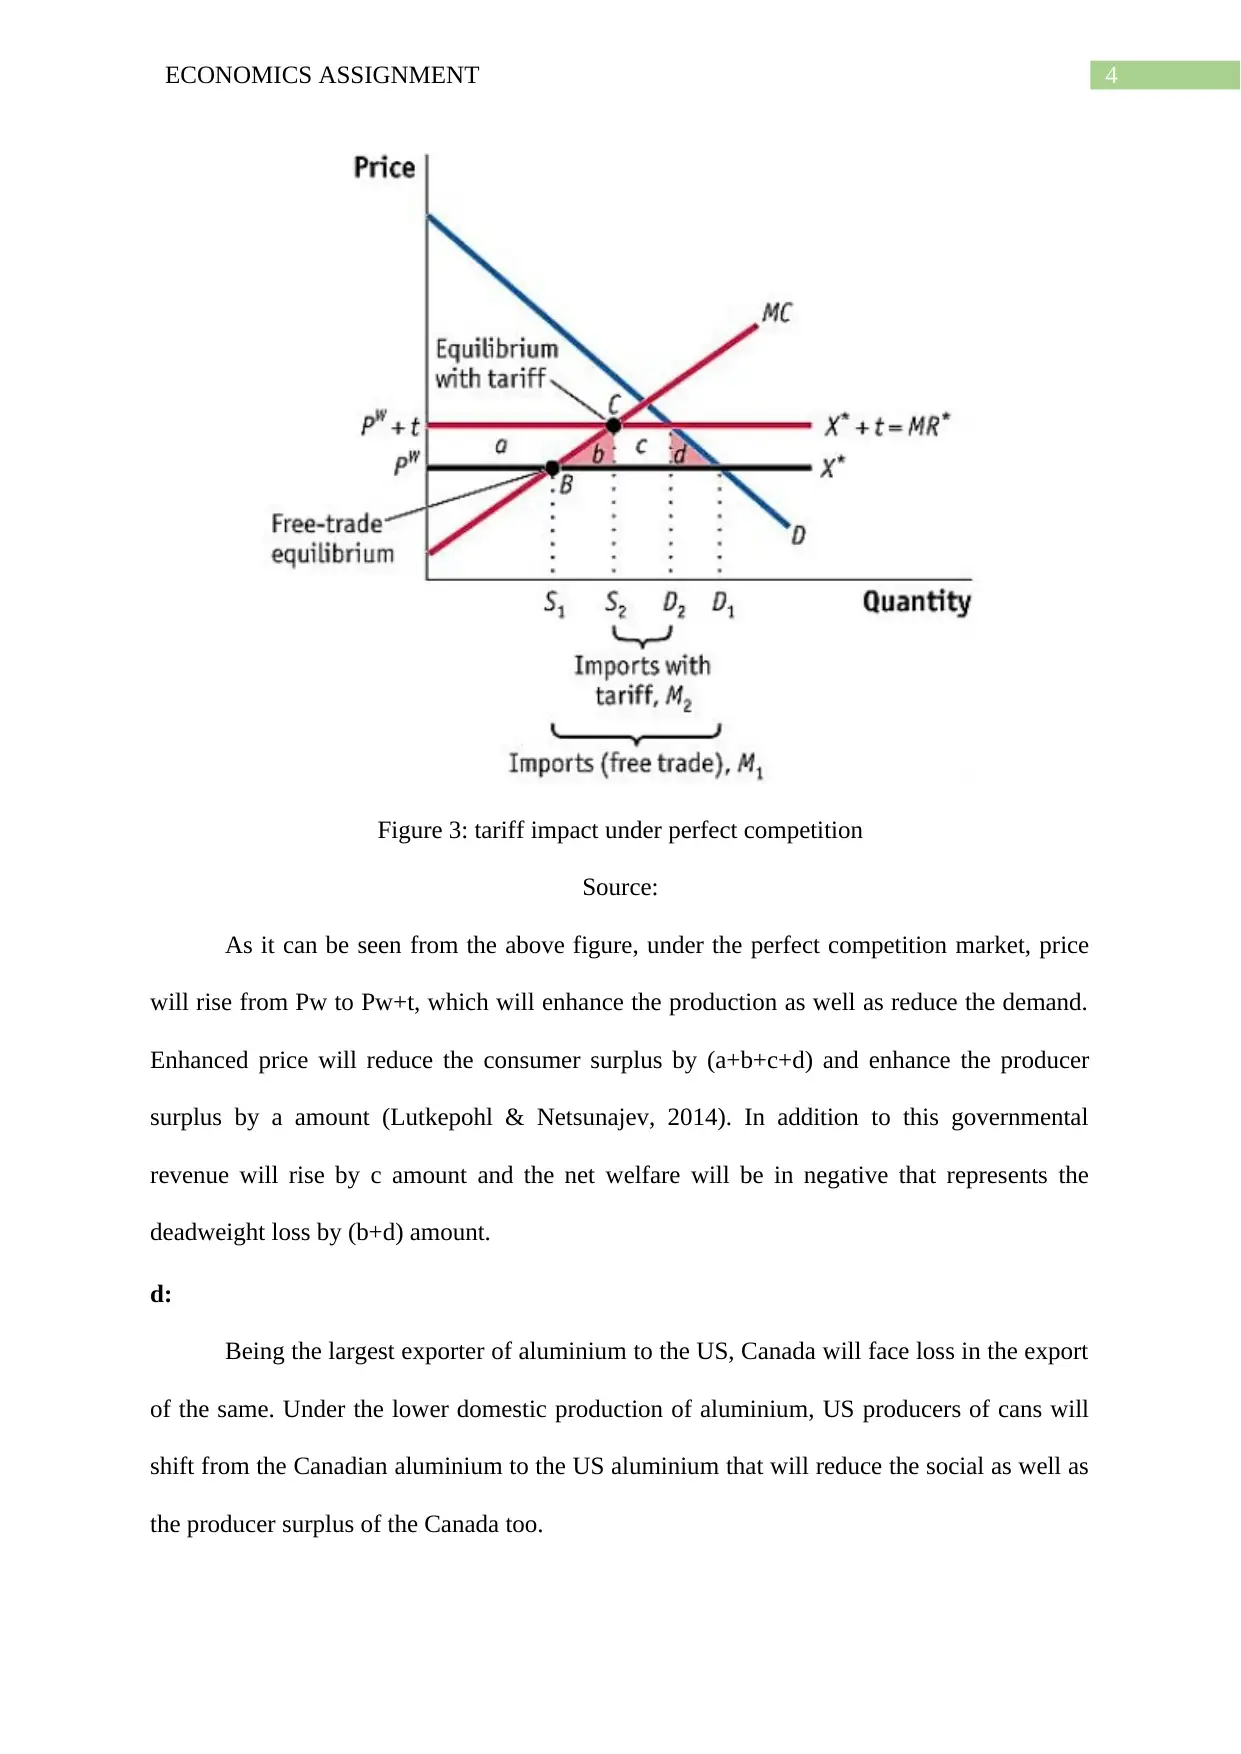
Figure 3: tariff impact under perfect competition
Source:
As it can be seen from the above figure, under the perfect competition market, price
will rise from Pw to Pw+t, which will enhance the production as well as reduce the demand.
Enhanced price will reduce the consumer surplus by (a+b+c+d) and enhance the producer
surplus by a amount (Lutkepohl & Netsunajev, 2014). In addition to this governmental
revenue will rise by c amount and the net welfare will be in negative that represents the
deadweight loss by (b+d) amount.
d:
Being the largest exporter of aluminium to the US, Canada will face loss in the export
of the same. Under the lower domestic production of aluminium, US producers of cans will
shift from the Canadian aluminium to the US aluminium that will reduce the social as well as
the producer surplus of the Canada too.
5ECONOMICS ASSIGNMENT
Answer 2:
a:
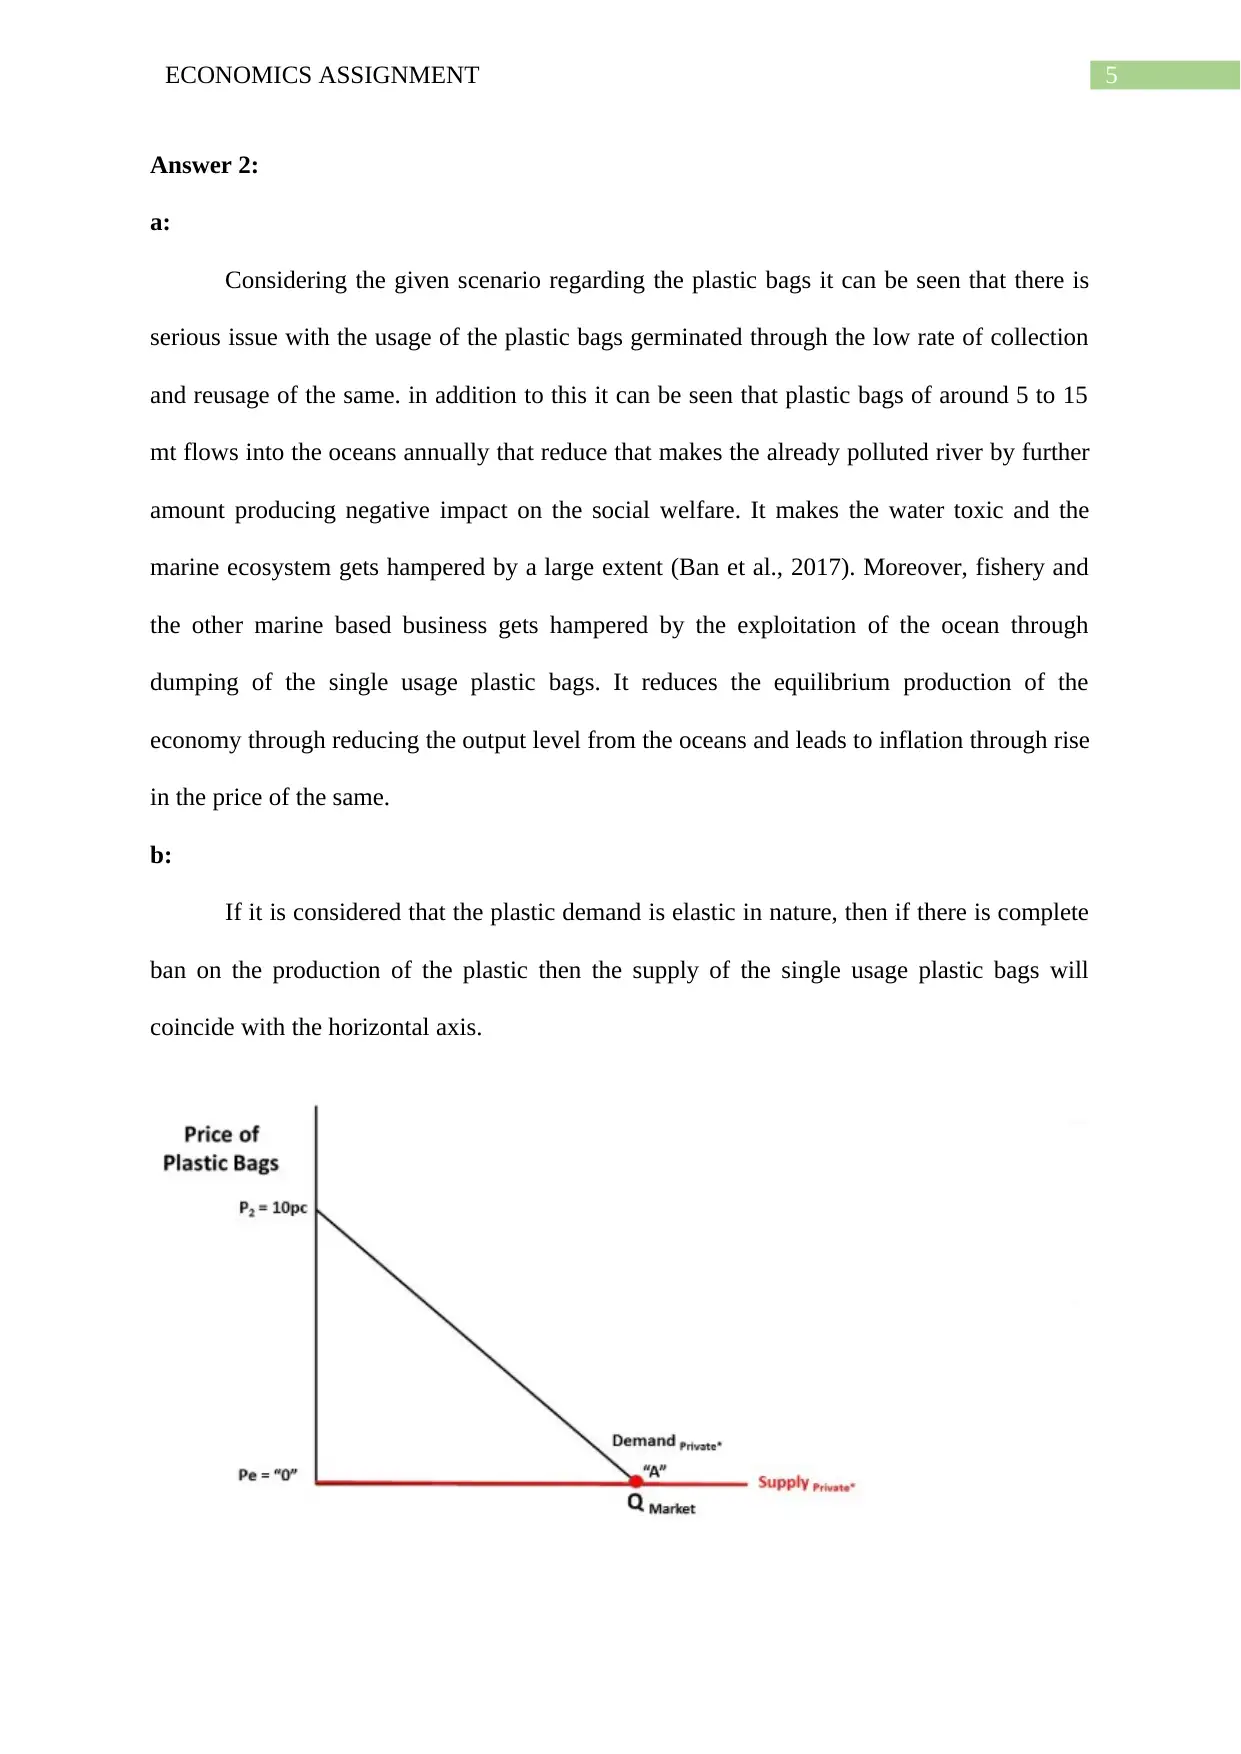
Considering the given scenario regarding the plastic bags it can be seen that there is
serious issue with the usage of the plastic bags germinated through the low rate of collection
and reusage of the same. in addition to this it can be seen that plastic bags of around 5 to 15
mt flows into the oceans annually that reduce that makes the already polluted river by further
amount producing negative impact on the social welfare. It makes the water toxic and the
marine ecosystem gets hampered by a large extent (Ban et al., 2017). Moreover, fishery and
the other marine based business gets hampered by the exploitation of the ocean through
dumping of the single usage plastic bags. It reduces the equilibrium production of the
economy through reducing the output level from the oceans and leads to inflation through rise
in the price of the same.
b:
If it is considered that the plastic demand is elastic in nature, then if there is complete
ban on the production of the plastic then the supply of the single usage plastic bags will
coincide with the horizontal axis.
Answer 2:
a:
Considering the given scenario regarding the plastic bags it can be seen that there is
serious issue with the usage of the plastic bags germinated through the low rate of collection
and reusage of the same. in addition to this it can be seen that plastic bags of around 5 to 15
mt flows into the oceans annually that reduce that makes the already polluted river by further
amount producing negative impact on the social welfare. It makes the water toxic and the
marine ecosystem gets hampered by a large extent (Ban et al., 2017). Moreover, fishery and
the other marine based business gets hampered by the exploitation of the ocean through
dumping of the single usage plastic bags. It reduces the equilibrium production of the
economy through reducing the output level from the oceans and leads to inflation through rise
in the price of the same.
b:
If it is considered that the plastic demand is elastic in nature, then if there is complete
ban on the production of the plastic then the supply of the single usage plastic bags will
coincide with the horizontal axis.
⊘ This is a preview!⊘
Do you want full access?
Subscribe today to unlock all pages.
Trusted by 1+ million students worldwide
6ECONOMICS ASSIGNMENT
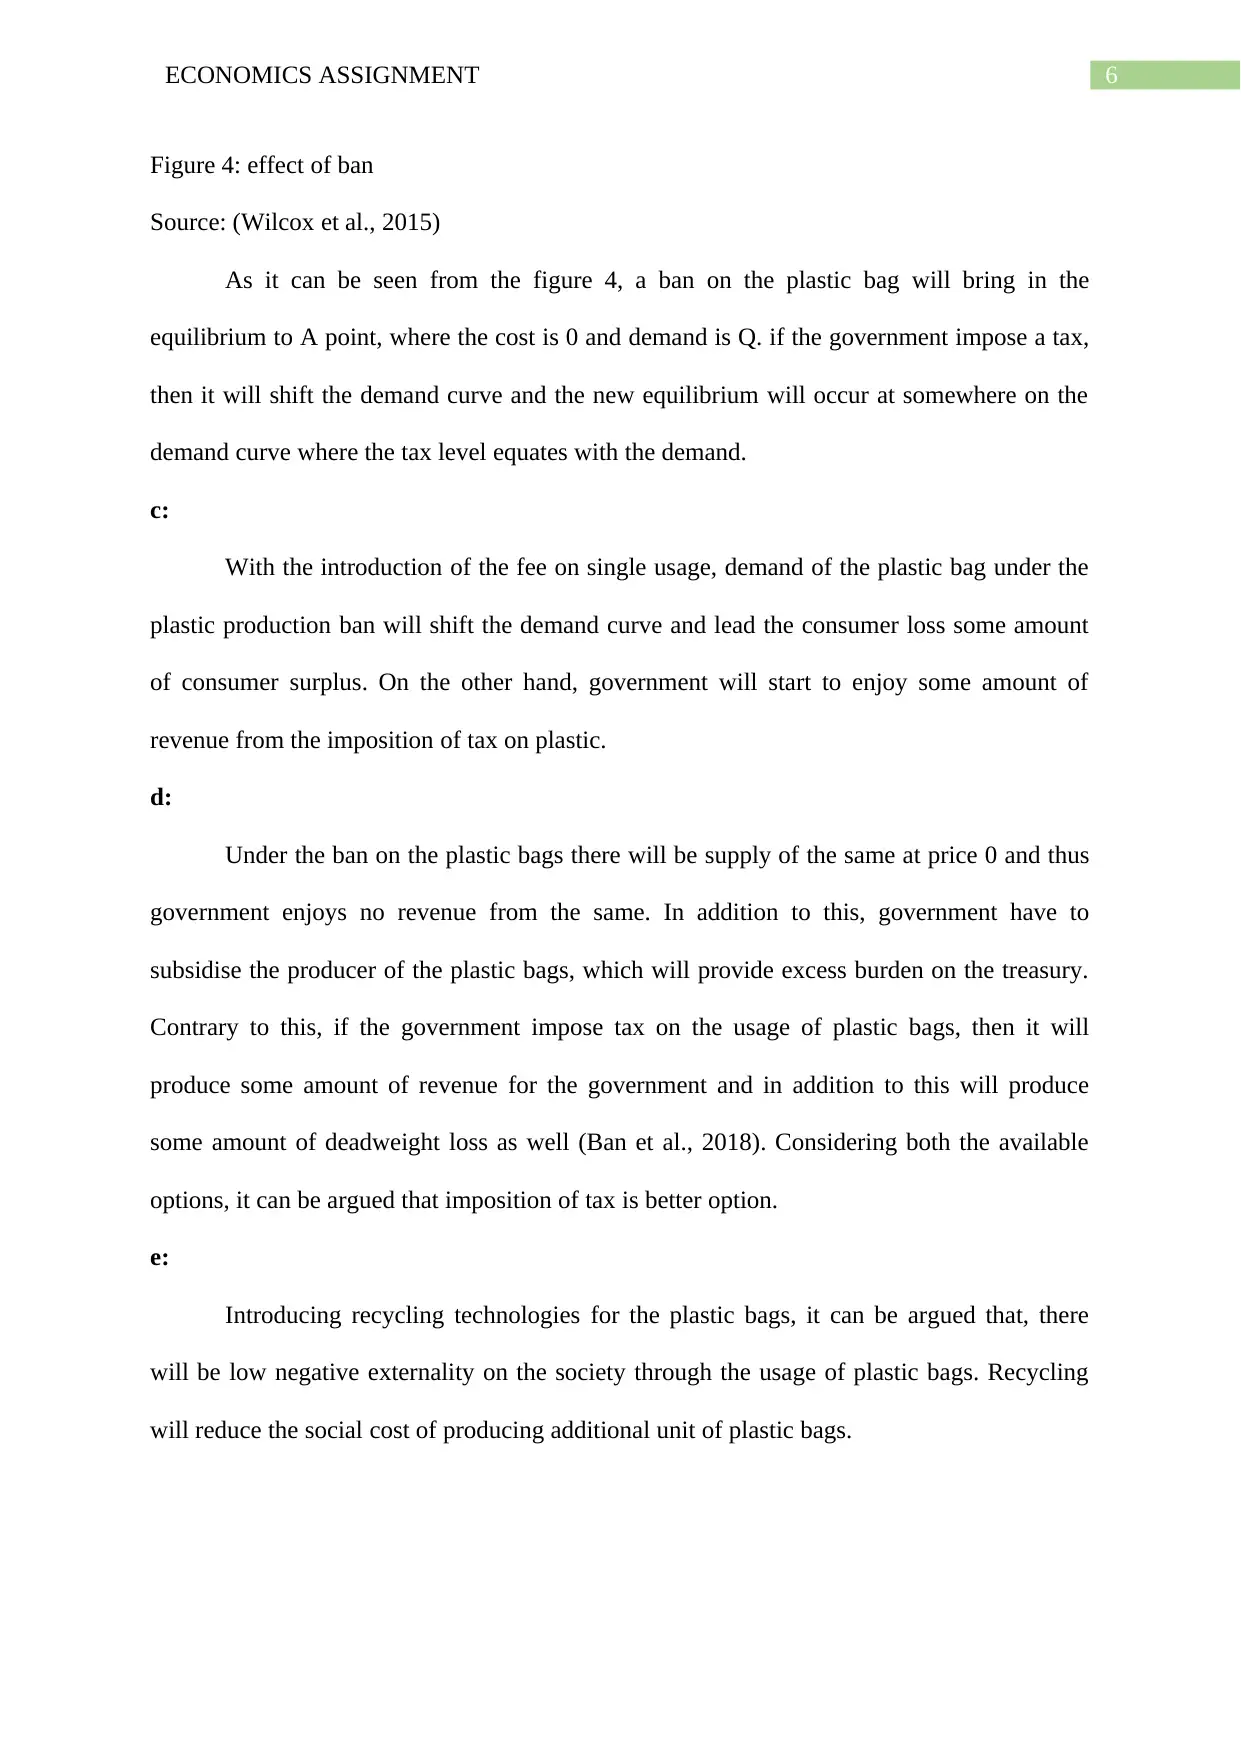
Figure 4: effect of ban
Source: (Wilcox et al., 2015)
As it can be seen from the figure 4, a ban on the plastic bag will bring in the
equilibrium to A point, where the cost is 0 and demand is Q. if the government impose a tax,
then it will shift the demand curve and the new equilibrium will occur at somewhere on the
demand curve where the tax level equates with the demand.
c:
With the introduction of the fee on single usage, demand of the plastic bag under the
plastic production ban will shift the demand curve and lead the consumer loss some amount
of consumer surplus. On the other hand, government will start to enjoy some amount of
revenue from the imposition of tax on plastic.
d:
Under the ban on the plastic bags there will be supply of the same at price 0 and thus
government enjoys no revenue from the same. In addition to this, government have to
subsidise the producer of the plastic bags, which will provide excess burden on the treasury.
Contrary to this, if the government impose tax on the usage of plastic bags, then it will
produce some amount of revenue for the government and in addition to this will produce
some amount of deadweight loss as well (Ban et al., 2018). Considering both the available
options, it can be argued that imposition of tax is better option.
e:
Introducing recycling technologies for the plastic bags, it can be argued that, there
will be low negative externality on the society through the usage of plastic bags. Recycling
will reduce the social cost of producing additional unit of plastic bags.
Paraphrase This Document
Need a fresh take? Get an instant paraphrase of this document with our AI Paraphraser

7ECONOMICS ASSIGNMENT
Answer 3:
a:
Enhanced labour productivity leads to rise in the economic welfare as production of
the goods and services gets enhanced that leads to fall in the price and eventually inflation
rates drops as well (Muller & Stegmaier, 2017).
b:
With higher labour productivity, there will be rise in the fall in the general price level
and eventually it will lead to rise in the further job creation through the growth in the
economic performance of the state.
c:
Capital accumulation without technological progress there will be no growth in the
economic endeavours of a state because there will be no shift of the production possibility
frontier.
d:
If the capital accumulation with the technological progress is enhanced, then it will
increase the productivity of the state and so does enhance the production possibility frontier
as well.
e:
As per the figure 2, Capacity utilisation is the measurement of the firm to produce
output and Total Factor Productivity is the portion of the output that is not explained by the
inputs in production (Erken et al., 2016).
8ECONOMICS ASSIGNMENT
Answer 4:
a:
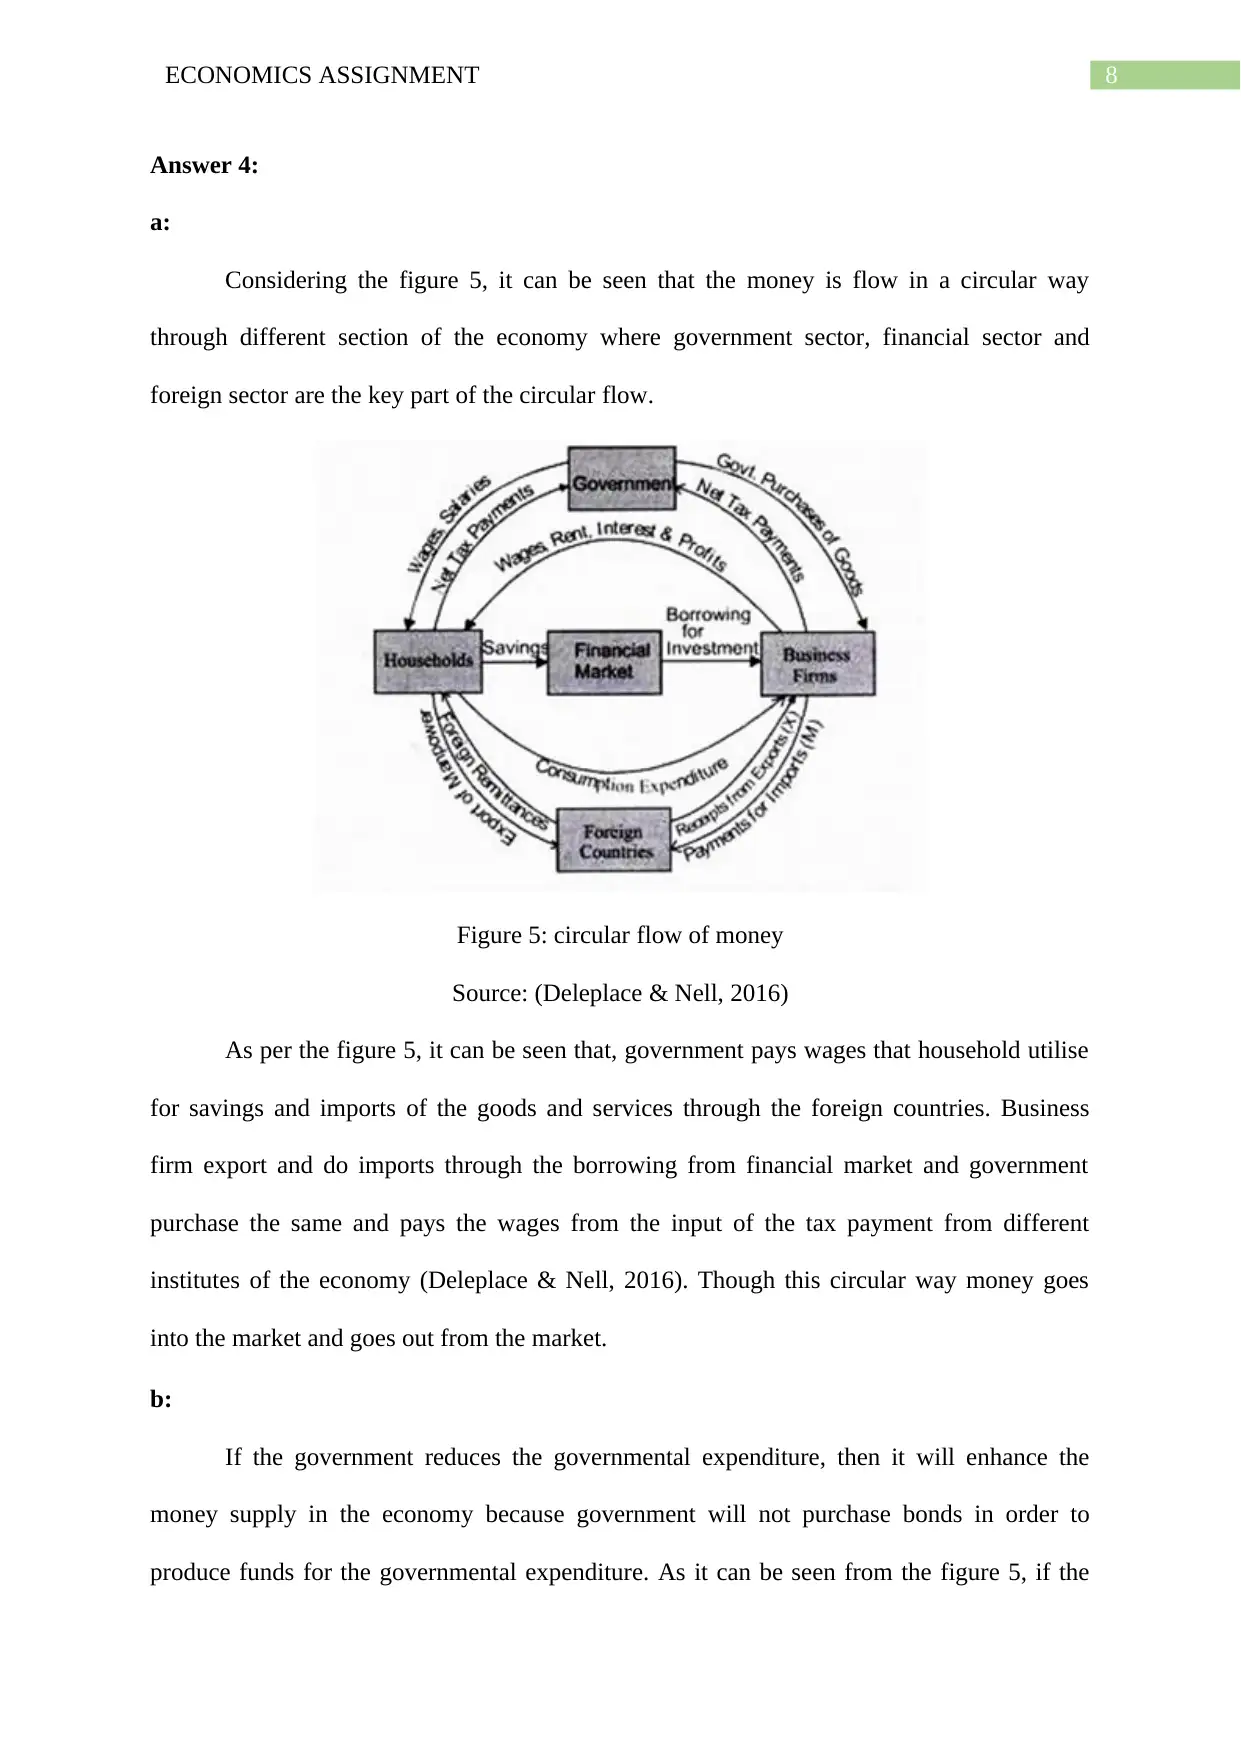
Considering the figure 5, it can be seen that the money is flow in a circular way
through different section of the economy where government sector, financial sector and
foreign sector are the key part of the circular flow.
Figure 5: circular flow of money
Source: (Deleplace & Nell, 2016)
As per the figure 5, it can be seen that, government pays wages that household utilise
for savings and imports of the goods and services through the foreign countries. Business
firm export and do imports through the borrowing from financial market and government
purchase the same and pays the wages from the input of the tax payment from different
institutes of the economy (Deleplace & Nell, 2016). Though this circular way money goes
into the market and goes out from the market.
b:
If the government reduces the governmental expenditure, then it will enhance the
money supply in the economy because government will not purchase bonds in order to
produce funds for the governmental expenditure. As it can be seen from the figure 5, if the
Answer 4:
a:
Considering the figure 5, it can be seen that the money is flow in a circular way
through different section of the economy where government sector, financial sector and
foreign sector are the key part of the circular flow.
Figure 5: circular flow of money
Source: (Deleplace & Nell, 2016)
As per the figure 5, it can be seen that, government pays wages that household utilise
for savings and imports of the goods and services through the foreign countries. Business
firm export and do imports through the borrowing from financial market and government
purchase the same and pays the wages from the input of the tax payment from different
institutes of the economy (Deleplace & Nell, 2016). Though this circular way money goes
into the market and goes out from the market.
b:
If the government reduces the governmental expenditure, then it will enhance the
money supply in the economy because government will not purchase bonds in order to
produce funds for the governmental expenditure. As it can be seen from the figure 5, if the
⊘ This is a preview!⊘
Do you want full access?
Subscribe today to unlock all pages.
Trusted by 1+ million students worldwide
9ECONOMICS ASSIGNMENT
government reduce the expenditure, then there will be rise in the liquidity in the market, and
it will enhance the foreign demand of goods and services. On the other hand with lower
interest rate from the financial market, there will be rise in the borrowing by the business firm
promoting higher growth to the economy. It will further creates export growth on behalf of
the domestic economy leading to rise in the trade balance of the state. Thus, post global
financial crisis, policy for reducing the government expenditure by the Eurozone is one of the
deliberate and accurate policy.
c:
With the rise in the investment of said amount in an economy leads to generation of
higher output owing to the presence of the multiplier effect in the economy. It is a factor that
defines the gains in total output due to the change in the investment expenditure. If the
investment is of €1 bln and in equilibrium output of € 1.5 bln, then the multiplier effect is 2.
Factors that can change the economic multiplier are as follows (Serrato & Wingender, 2016):
Marginal propensity to consume
Marginal propensity to import
Marginal propensity to save
Marginal rate of tax
d:
As per the circular flow diagram of money supply, it can be seen that as the money
supply will increase due to the quantitative easing, there will be rise in the demand of goods
and services. Rise in the demand will enhance the price of the same leading to enhancement
in the inflation rate. However, considering the case of the ECB, it can be seen that as there
has been quantitative easing from the banks, it can be seen that the exchange rate has also
appreciated leading to fall in the foreign demands of the goods and services (Fratzsscher et
Paraphrase This Document
Need a fresh take? Get an instant paraphrase of this document with our AI Paraphraser

10ECONOMICS ASSIGNMENT
al., 2018). Thus, under the quantitative easing scenario, economy has not at all faced any
inflationary situation.
e:
Following things can happen if ECB stop QE:
Governmental bonds will fetch higher yields
Liquidity will be reduced as the money will move from bonds into equity
al., 2018). Thus, under the quantitative easing scenario, economy has not at all faced any
inflationary situation.
e:
Following things can happen if ECB stop QE:
Governmental bonds will fetch higher yields
Liquidity will be reduced as the money will move from bonds into equity
11ECONOMICS ASSIGNMENT
Reference:
Aluminum market analysis, industry forecasts & price outlook - By Harbor Intelligence .
(2018). Harboraluminum.com. Retrieved 26 June 2018, from
http://www.harboraluminum.com/aluminum-price-trends
Ban, E., Franklin, J. M., Nam, S., Smith, L. R., Wang, H., Wells, R. G., ... & Shenoy, V. B.
(2018). Mechanisms of Plastic Deformation in Collagen Networks Induced by
Cellular Forces. Biophysical journal, 114(2), 450-461.
Ban, H., Yao, Y., Chen, S., & Fang, D. (2017). The coupling effect of size and damage in
micro-scale metallic materials. International Journal of Plasticity, 95, 251-263.
Cashin, P., Mohaddes, K., Raissi, M., & Raissi, M. (2014). The differential effects of oil
demand and supply shocks on the global economy. Energy Economics, 44, 113-134.
Deleplace, G., & Nell, E. J. (Eds.). (2016). Money in Motion: the post-Keynesian and
circulation approaches. Springer.
Erken, H., Donselaar, P., & Thurik, R. (2016). Total factor productivity and the role of
entrepreneurship. The Journal of Technology Transfer, 1-29.
Fratzscher, M., Lo Duca, M., & Straub, R. (2018). On the international spillovers of US
quantitative easing. The Economic Journal, 128(608), 330-377.
Lütkepohl, H., & Netšunajev, A. (2014). Disentangling demand and supply shocks in the
crude oil market: How to check sign restrictions in structural VARs. Journal of
Applied Econometrics, 29(3), 479-496.
Müller, S., & Stegmaier, J. (2017). The dynamic effects of works councils on labour
productivity: First evidence from panel data. British Journal of Industrial Relations,
55(2), 372-395.
Serrato, J. C. S., & Wingender, P. (2016). Estimating local fiscal multipliers (No. w22425).
National Bureau of Economic Research.
⊘ This is a preview!⊘
Do you want full access?
Subscribe today to unlock all pages.
Trusted by 1+ million students worldwide
1 out of 13
Related Documents


Your All-in-One AI-Powered Toolkit for Academic Success.
+13062052269
info@desklib.com
Available 24*7 on WhatsApp / Email
![[object Object]](/_next/static/media/star-bottom.7253800d.svg)
Unlock your academic potential
Copyright © 2020–2026 A2Z Services. All Rights Reserved. Developed and managed by ZUCOL.