Economics Assignment: Labor Economics, Wage Gaps, and UBI Effects
VerifiedAdded on 2022/08/12
|7
|980
|18
Homework Assignment
AI Summary
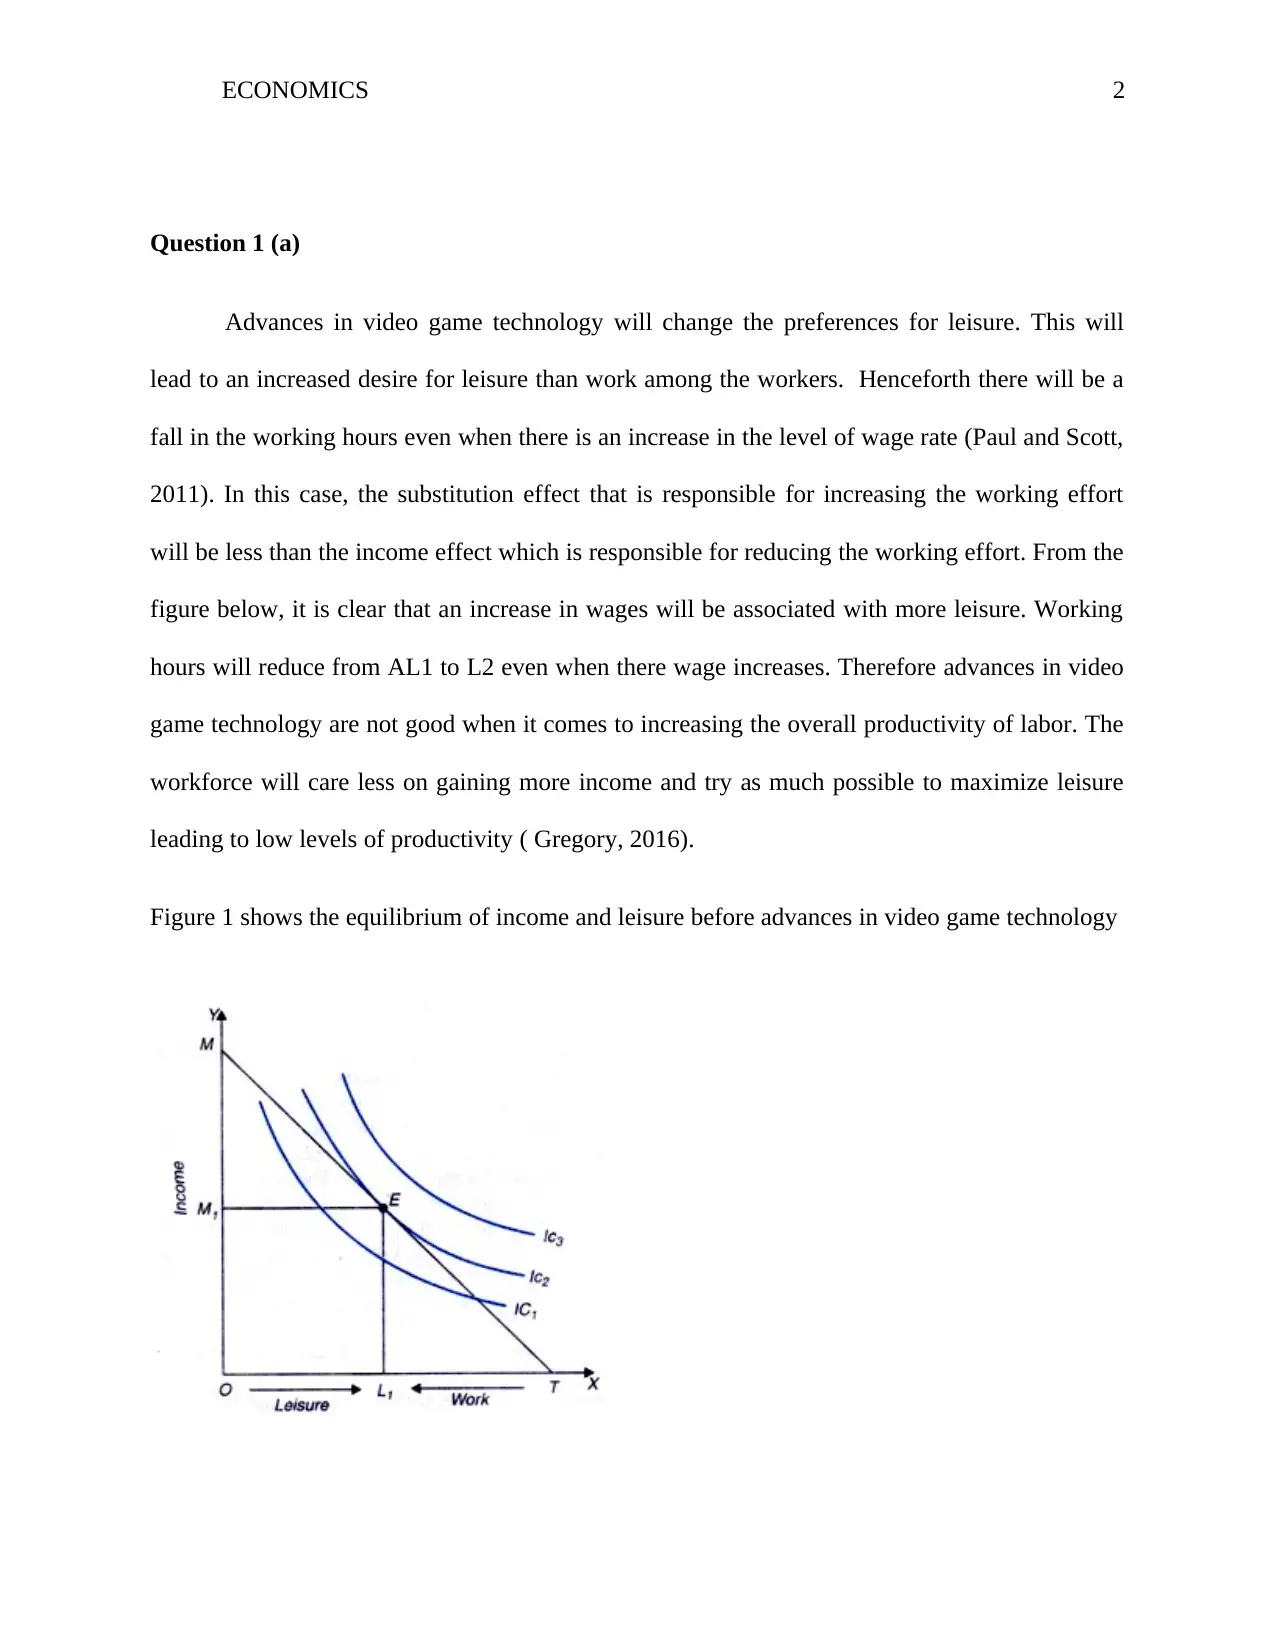
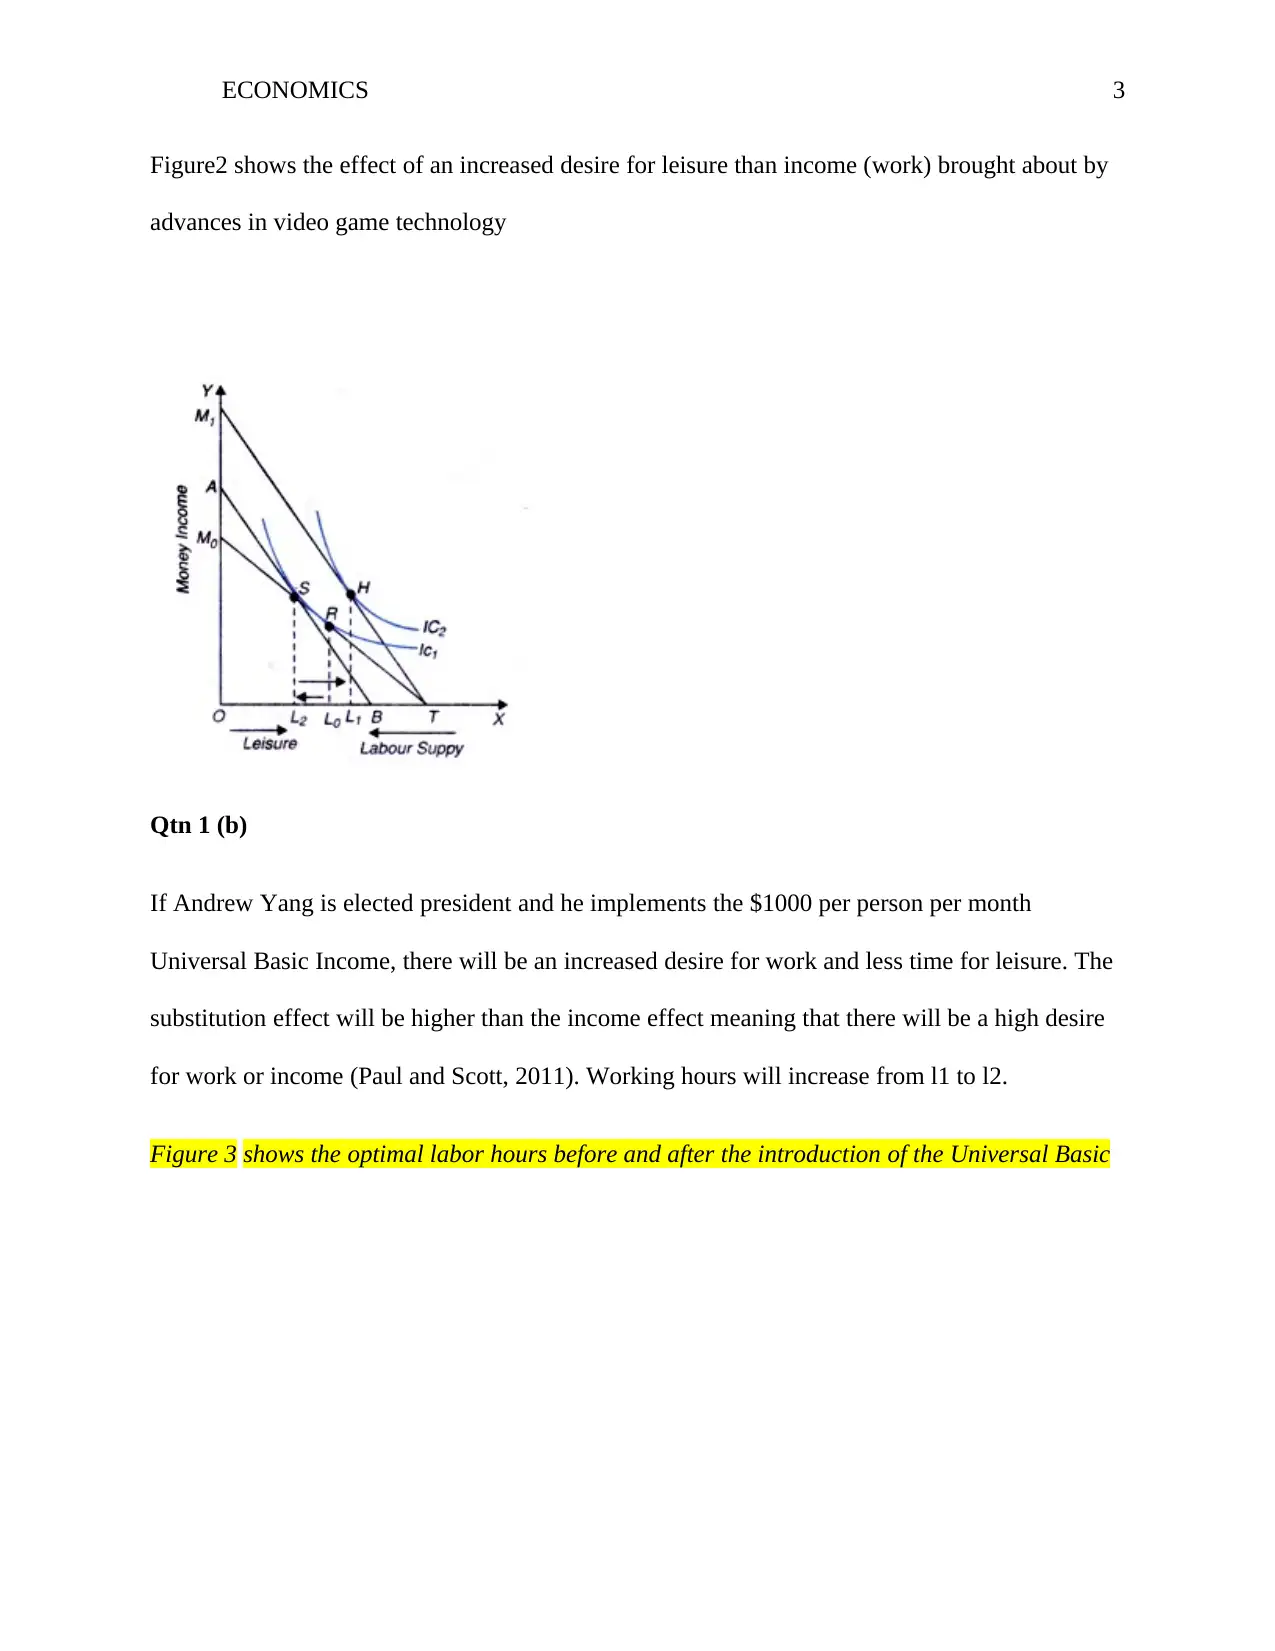
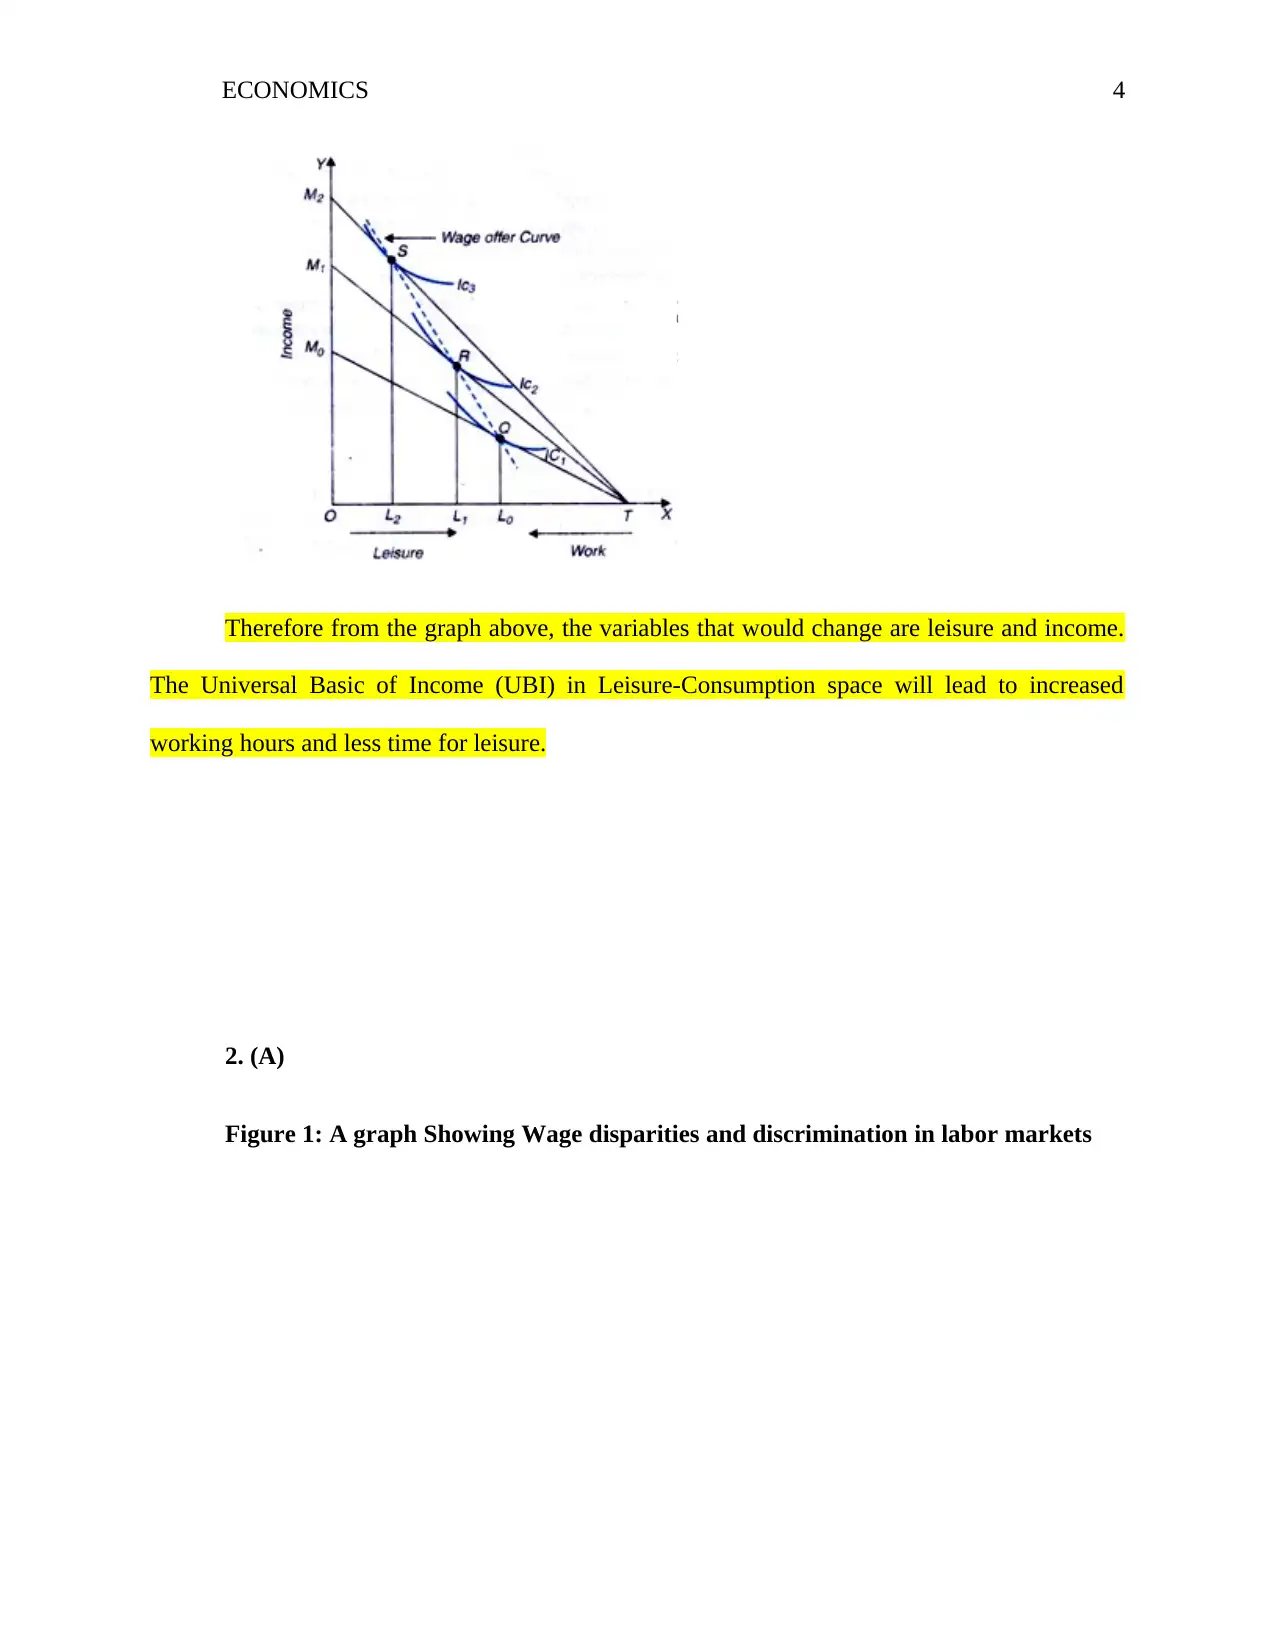
This economics assignment delves into the effects of technological advancements on leisure preferences and their subsequent impact on labor supply, analyzing how increased desire for leisure can decrease working hours even with rising wages. It then assesses the potential effects of a Universal Basic Income (UBI) on labor supply, predicting increased working hours due to a higher substitution effect. Furthermore, the assignment analyzes wage disparities in labor markets, examining wage gaps based on gender, race, and productivity levels, and proposes an econometric model to estimate the impact of these factors on real earnings, while excluding occupation as a statistically insignificant variable. The assignment utilizes graphical representations and econometric methods to support its arguments, citing relevant economic literature.

Running head: ECONOMICS 1
Economics
Student’s name
Affiliation
Date
Economics
Student’s name
Affiliation
Date
Paraphrase This Document
Need a fresh take? Get an instant paraphrase of this document with our AI Paraphraser

ECONOMICS 2
Question 1 (a)
Advances in video game technology will change the preferences for leisure. This will
lead to an increased desire for leisure than work among the workers. Henceforth there will be a
fall in the working hours even when there is an increase in the level of wage rate (Paul and Scott,
2011). In this case, the substitution effect that is responsible for increasing the working effort
will be less than the income effect which is responsible for reducing the working effort. From the
figure below, it is clear that an increase in wages will be associated with more leisure. Working
hours will reduce from AL1 to L2 even when there wage increases. Therefore advances in video
game technology are not good when it comes to increasing the overall productivity of labor. The
workforce will care less on gaining more income and try as much possible to maximize leisure
leading to low levels of productivity ( Gregory, 2016).
Figure 1 shows the equilibrium of income and leisure before advances in video game technology

ECONOMICS 3
Figure2 shows the effect of an increased desire for leisure than income (work) brought about by
advances in video game technology
Qtn 1 (b)
If Andrew Yang is elected president and he implements the $1000 per person per month
Universal Basic Income, there will be an increased desire for work and less time for leisure. The
substitution effect will be higher than the income effect meaning that there will be a high desire
for work or income (Paul and Scott, 2011). Working hours will increase from l1 to l2.
Figure 3 shows the optimal labor hours before and after the introduction of the Universal Basic
⊘ This is a preview!⊘
Do you want full access?
Subscribe today to unlock all pages.

Trusted by 1+ million students worldwide

ECONOMICS 4
Therefore from the graph above, the variables that would change are leisure and income.
The Universal Basic of Income (UBI) in Leisure-Consumption space will lead to increased
working hours and less time for leisure.
2. (A)
Figure 1: A graph Showing Wage disparities and discrimination in labor markets
Paraphrase This Document
Need a fresh take? Get an instant paraphrase of this document with our AI Paraphraser

ECONOMICS 5
women’s median usual weekly real
earnings
working men’s median usual weekly
real earnings
black or African American” workers
Hispanic or Latino” workers
“Asian” workers’
White” workers
0 10 20 30 40 50
Weekly Real Earning (%)
Source: FRED Economic data, 2019
Figure 3 above shows the distribution of weekly real earning of various working groups
among gender and races. Figure3 explains that white workers' real medium weekly earnings
were at a higher percentage from 2000 to 2020 than any other kind of race (Paul and Scott,
2011).
The wage gaps emanating from the ethnic and racial minorities and whites among men
and women have been examined with non-discriminatory issues( Gregory, 2016). More so, the
productivity differences account for the differences in median weekly levels of earnings since the
year 2000 (Tausch, 2015). This implies that wage gaps are determined by differences in race,
gender, and productivity levels. Most significant is schooling skills also creates a gap among
men and women as well as the races in relation to medium weekly earnings. Another important
difference factor is about immigrant assimilation, which is most common in Asians and South
American workers In my opinion, I agree that uncontrolled comparisons about earnings on wage
gaps by gender or race in the last two decades. This is because when there are low recognition

ECONOMICS 6
and policies protecting disparities in the labor market, such incidences happen (Anderson and
Ray, 2019).
(b)
Y = m – nX1 (M+F) – pX2 (A+B+C) + qS
In the above econometric model, m, n, p, and q are the parameters to be estimated on
constant, gender, race, and years of schooling respectively. Y is the real earnings, X1 with the
superscripts of M and F represent gender comprised of men and women. Besides, X2 with the
superscripts A, B, and C represent the race differences such as whites, blacks, and Hispanics.
More so, S represents years of schooling (Paul and Scott, 2011).
In summary, a unit change in gender and race leads to a decrease in real earnings by 'n'
and 'p' terms. However, a unit change in schooling level leads to an increase in earnings. This
implies that there is a positive relationship between earnings and years of schooling. Therefore, I
will use the pooled data econometric method because of the nature of variables.
(c) The occupation should not be included in the model. This is because it is not
statistically significant in relation to wages. With this in mind, that is why occupation indicators
were left out of the specified econometric model.
⊘ This is a preview!⊘
Do you want full access?
Subscribe today to unlock all pages.

Trusted by 1+ million students worldwide

ECONOMICS 7
References
Anderson, D., Ray, M. (2019). Krugman's Economics for the AP Course (3rd ed.). New York:
BFW. ISBN 978-1-319-11327-8
Gregory, M. ( 2016). Principles of economics (Eighth ed.). Boston, MA, USA. ISBN 978-1-305-
58512-6. OCLC 974706695.
Paul, O., Scott, S., (2011). Personnel Economics: Hiring and Incentives. Handbook of Labor
Economics. 4. pp. 1769–1823. DOI:10.1016/S0169-7218(11)02418-X. ISBN
9780444534521.
Tausch, A. (2015). The political algebra of global value change. General models and
implications for the Muslim world. With Almas Heshmati and Hichem Karoui (1st ed.).
Nova Science Publishers, New York. ISBN 978-1-62948-899-8.
1 out of 7

Your All-in-One AI-Powered Toolkit for Academic Success.
+13062052269
info@desklib.com
Available 24*7 on WhatsApp / Email
Unlock your academic potential
Copyright © 2020–2025 A2Z Services. All Rights Reserved. Developed and managed by ZUCOL.