University Economics Report: Wage and Education Correlation
VerifiedAdded on 2020/05/28
|8
|1665
|155
Report
AI Summary
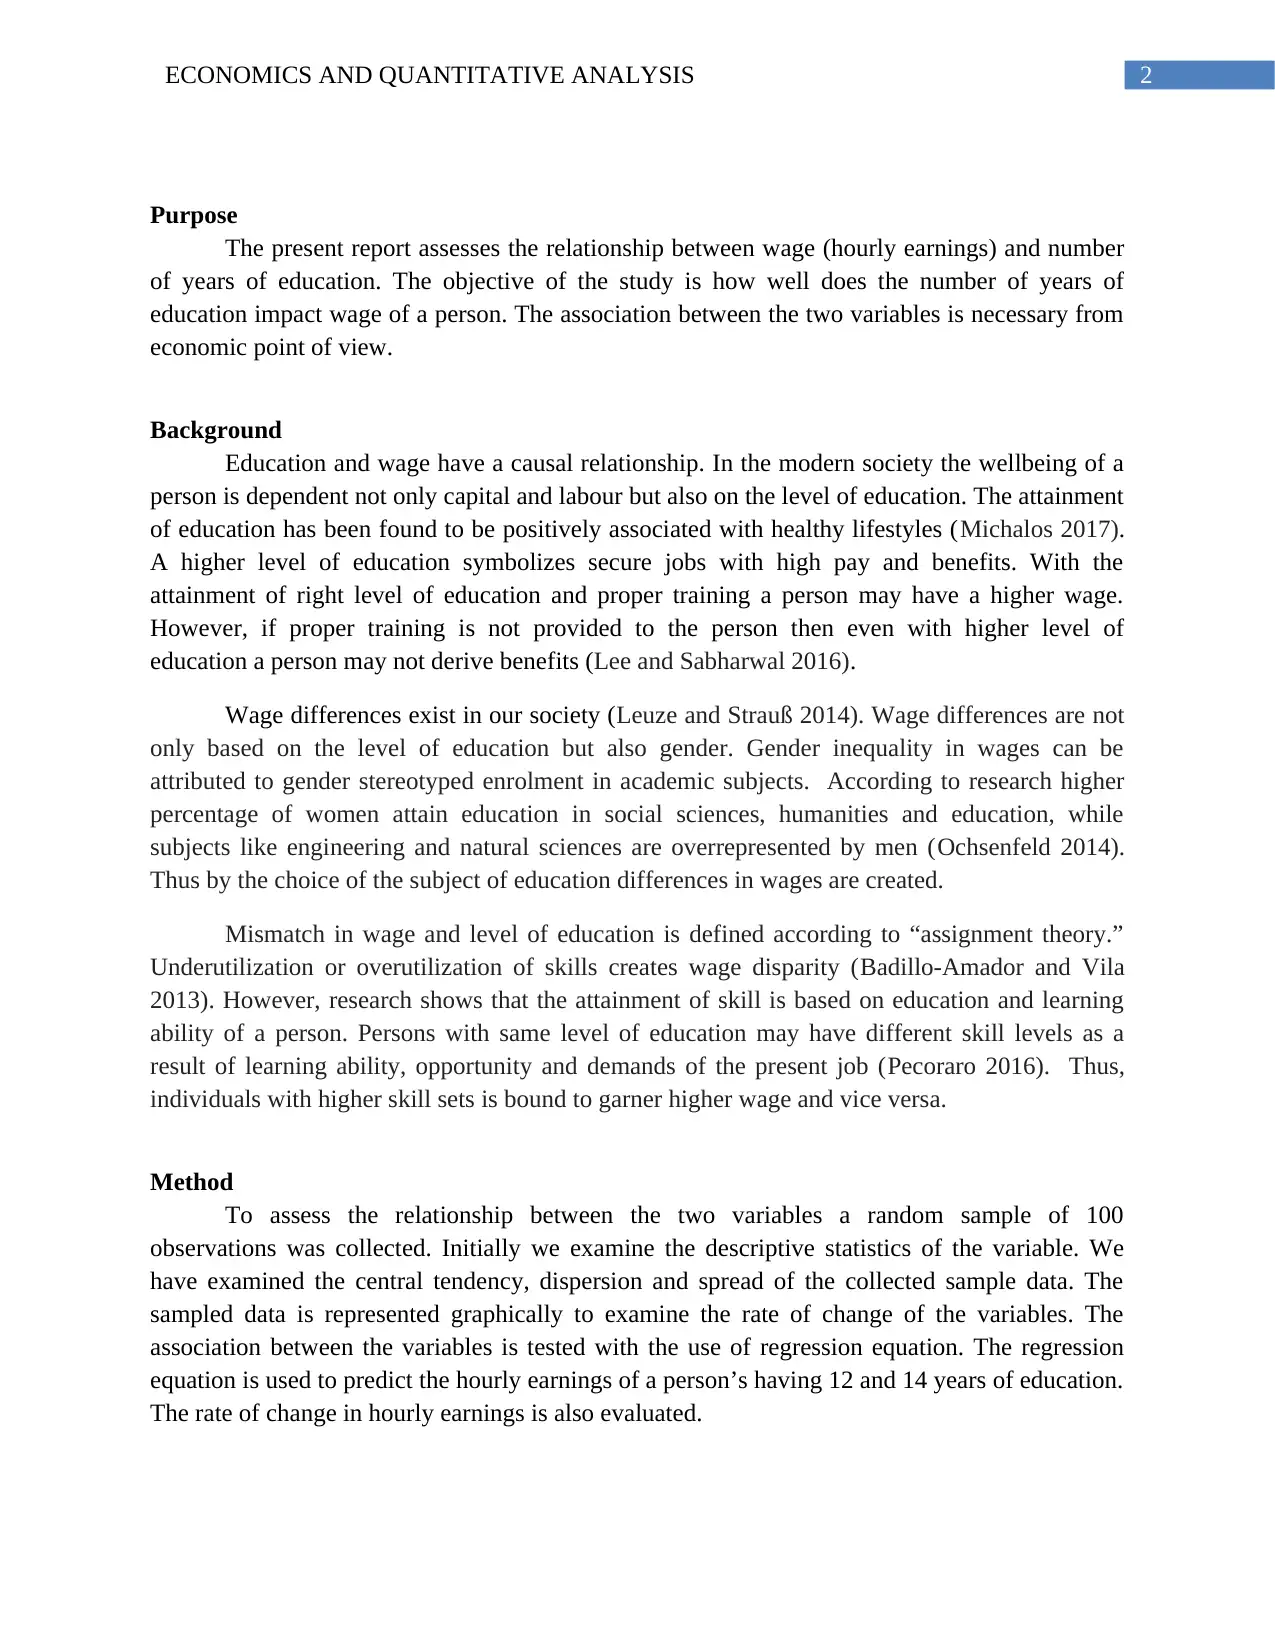
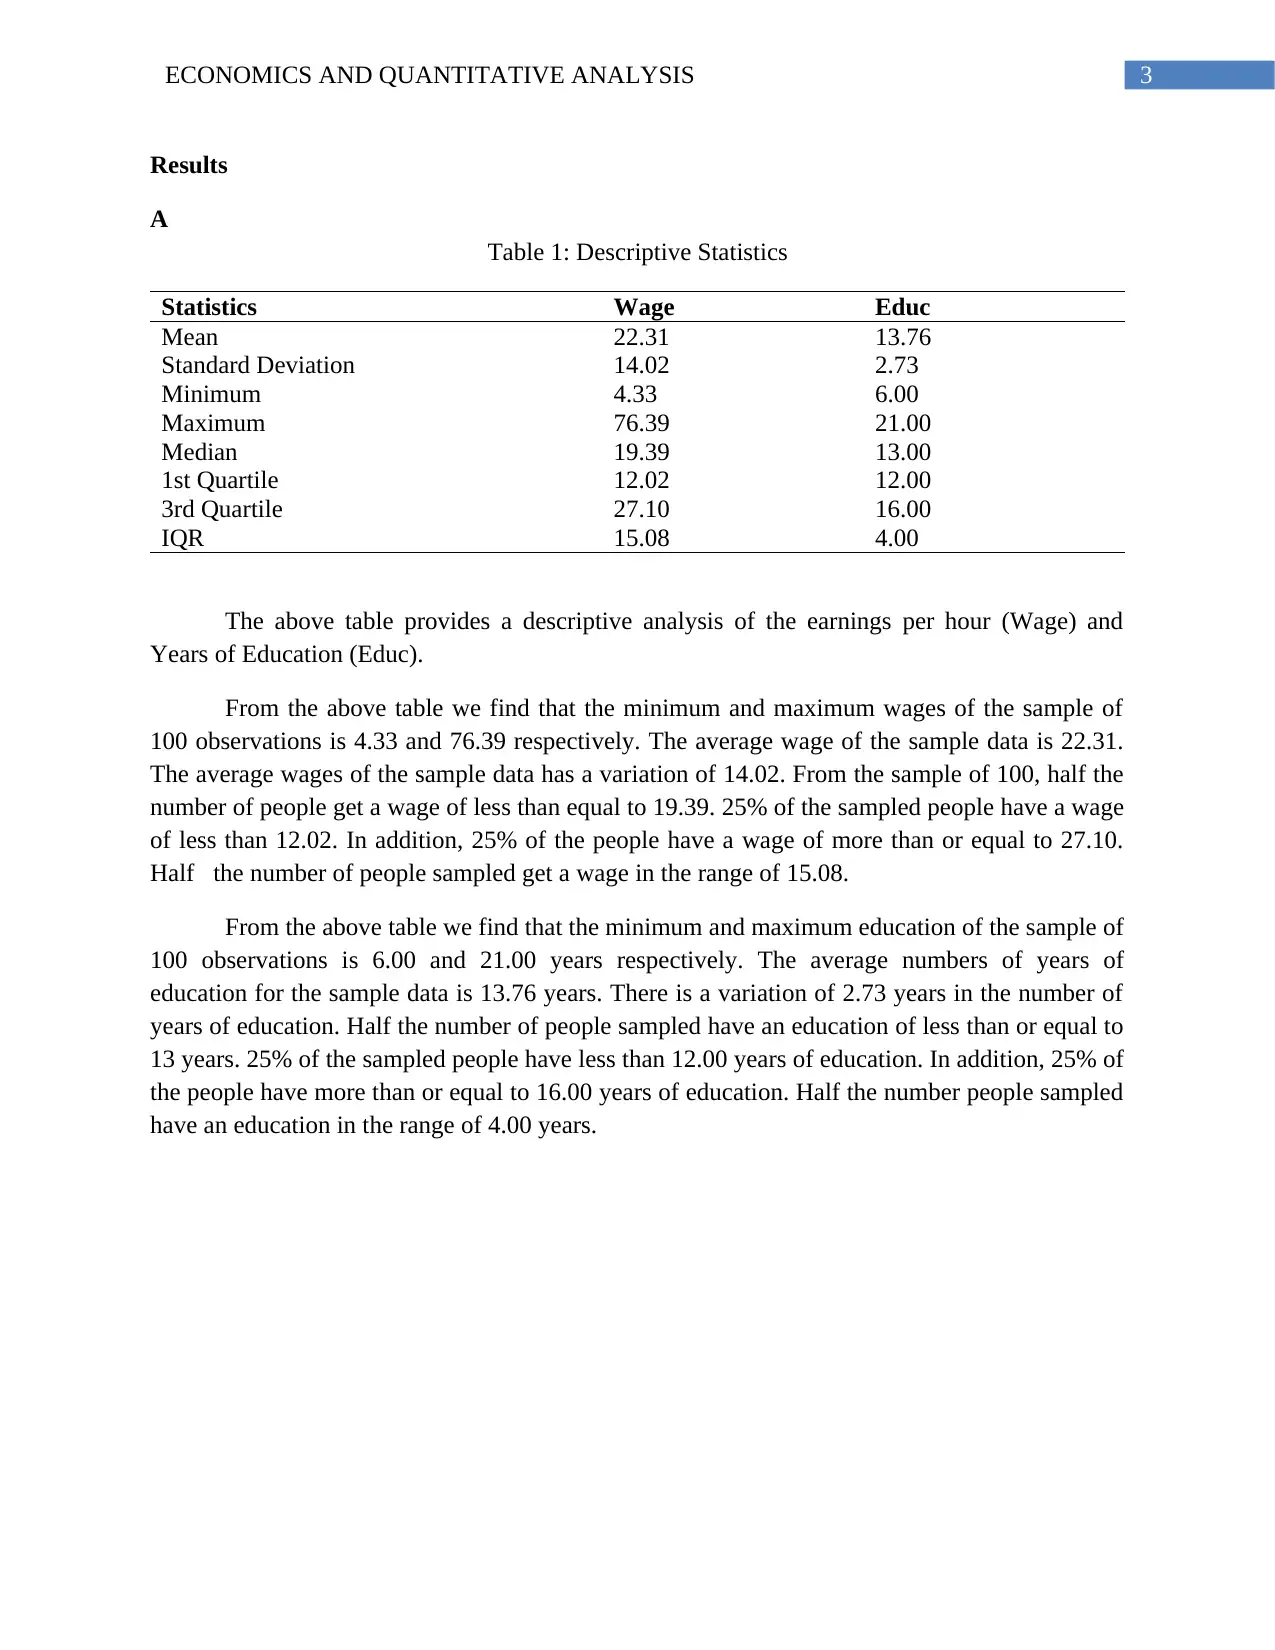
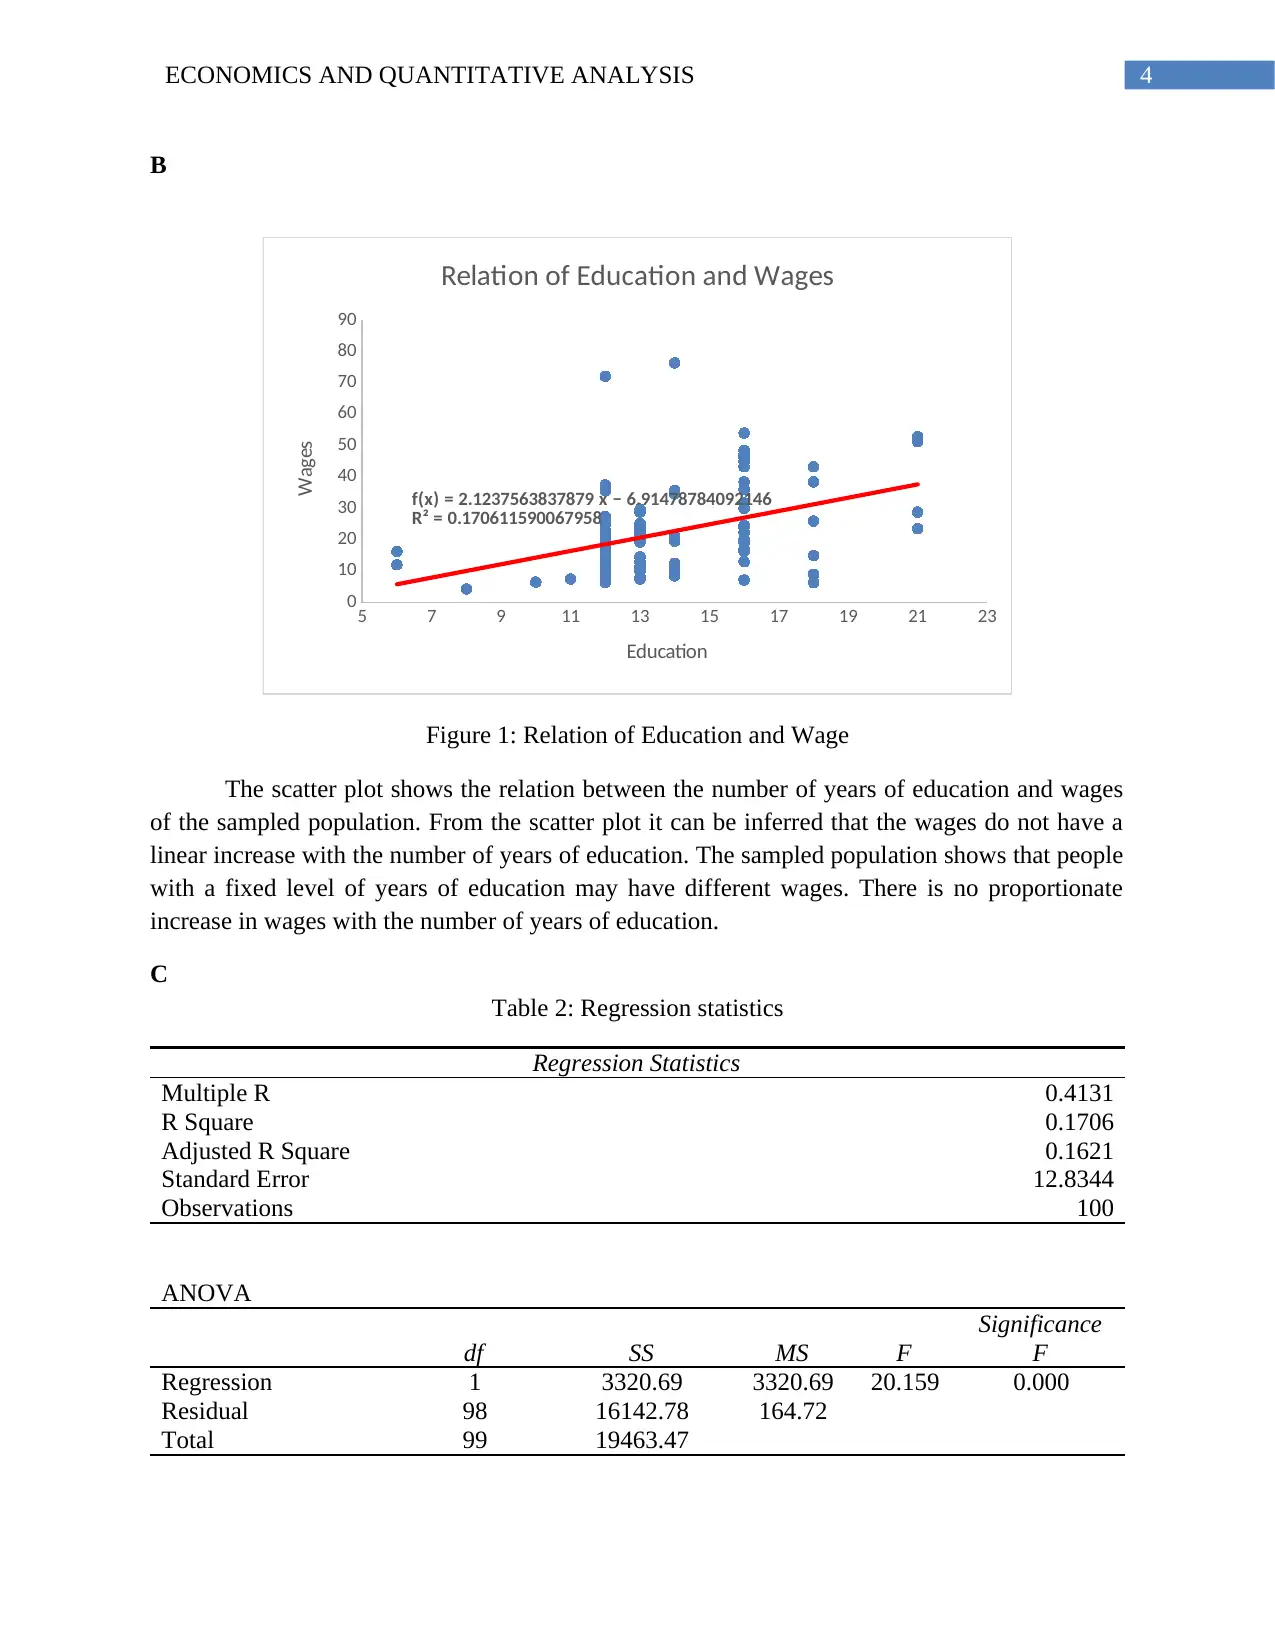
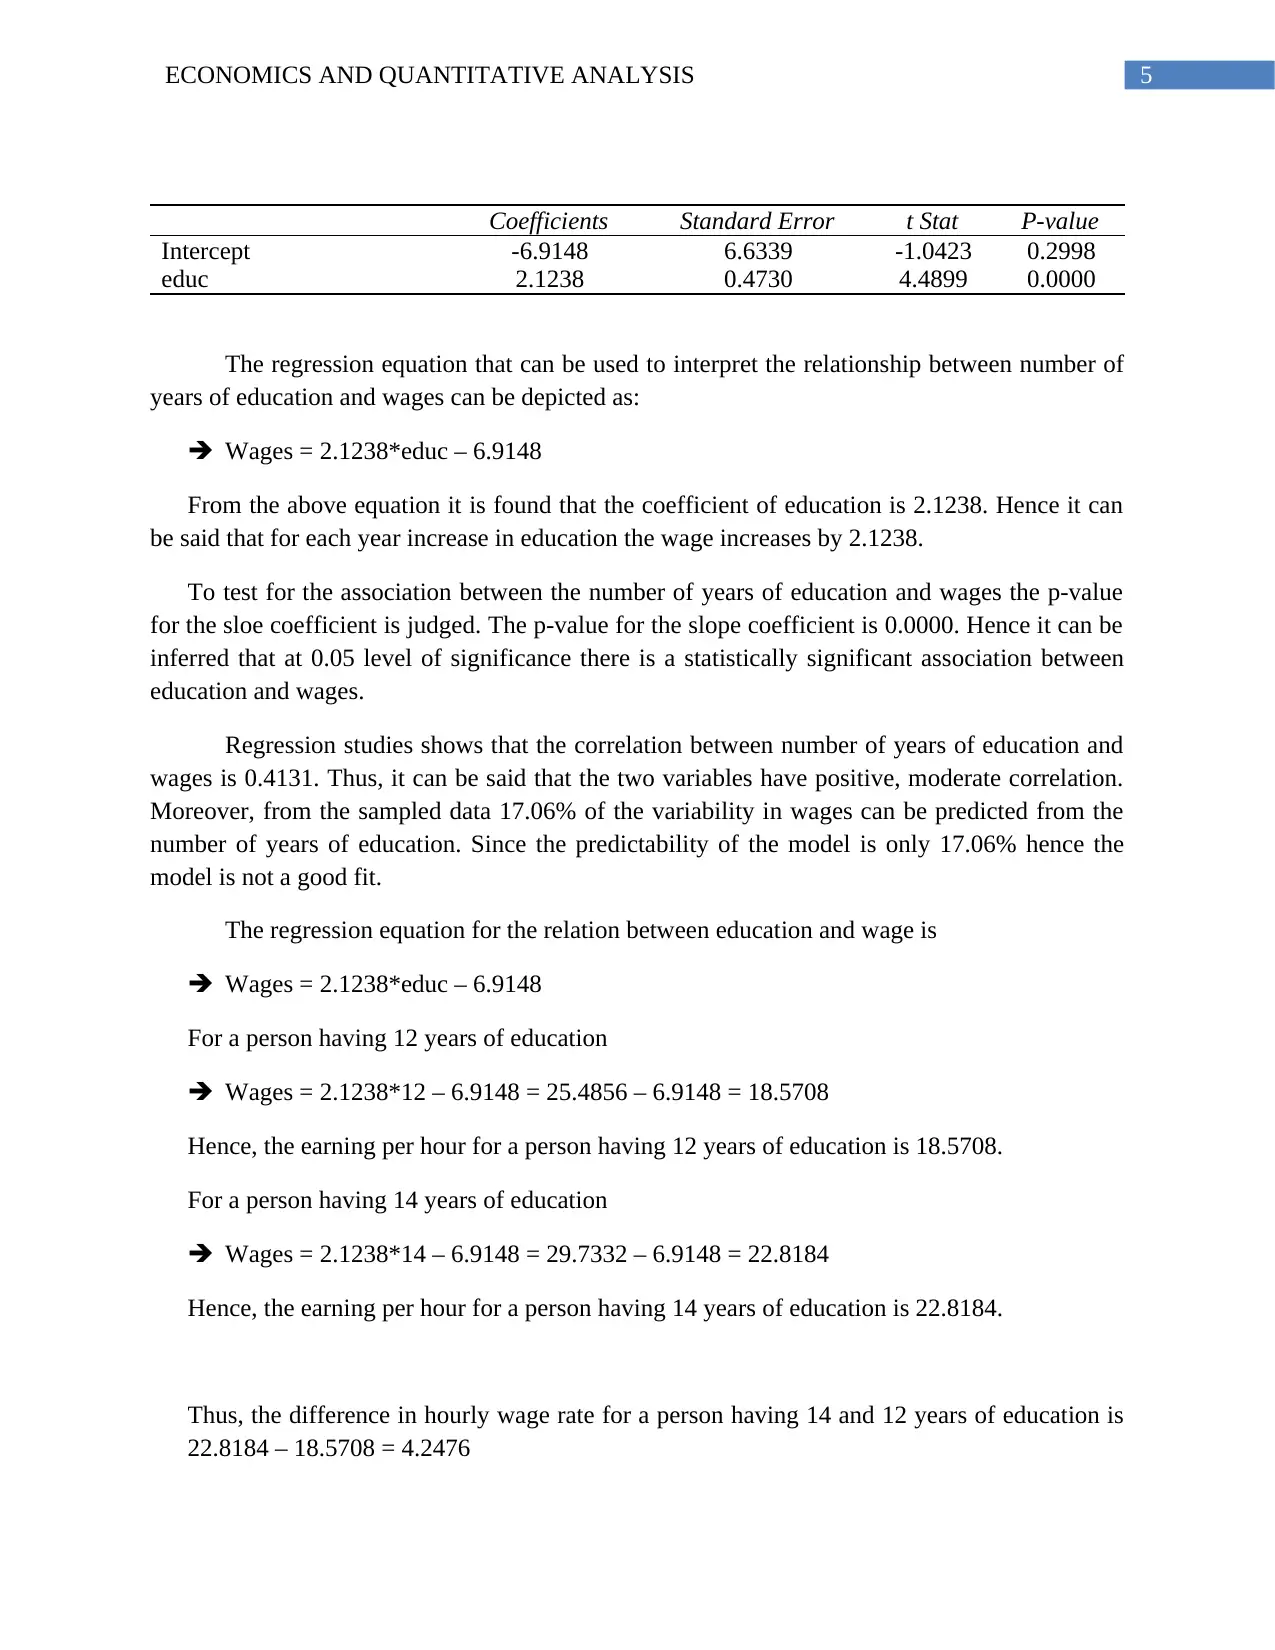
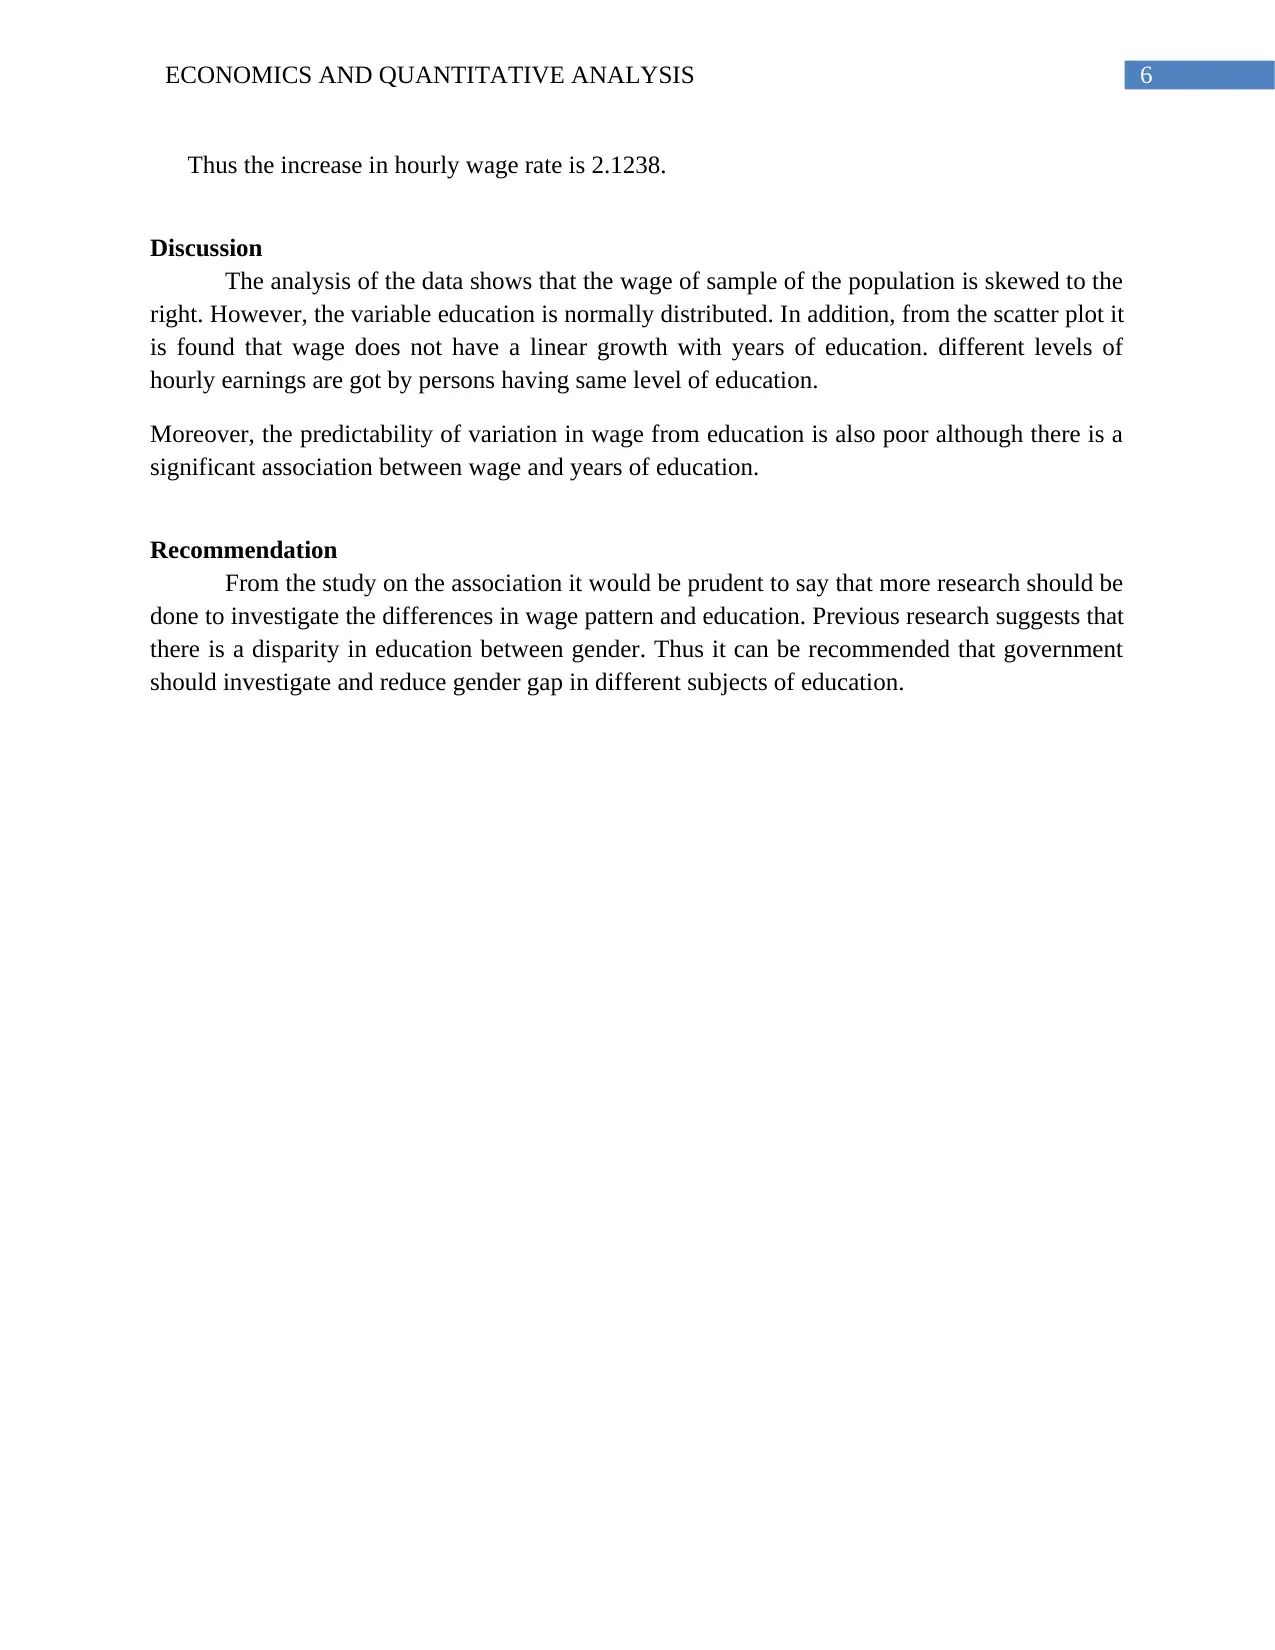
This economics report investigates the relationship between wage (hourly earnings) and the number of years of education. The study uses a random sample of 100 observations to analyze the correlation between these two variables. The report begins with descriptive statistics, including measures of central tendency, dispersion, and graphical representations of the data. A regression equation is employed to predict hourly earnings based on years of education, and the results are presented in tables and figures. The analysis reveals a positive, moderate correlation between education and wage, although the model's predictability is limited. The report discusses these findings, including the implications of wage disparities and the need for further research. The study concludes with recommendations for addressing gender gaps in education and improving wage equality.

Running head: ECONOMICS AND QUANTITATIVE ANALYSIS
Economics and quantitative analysis
Name of the student
Name of the university
Author’s note
Economics and quantitative analysis
Name of the student
Name of the university
Author’s note
Paraphrase This Document
Need a fresh take? Get an instant paraphrase of this document with our AI Paraphraser

1ECONOMICS AND QUANTITATIVE ANALYSIS
Table of Contents
Purpose............................................................................................................................................2
Background......................................................................................................................................2
Method.............................................................................................................................................2
Results..............................................................................................................................................3
A...................................................................................................................................................3
B...................................................................................................................................................4
C...................................................................................................................................................4
Discussion........................................................................................................................................6
Recommendation.............................................................................................................................6
References........................................................................................................................................7

2ECONOMICS AND QUANTITATIVE ANALYSIS
Purpose
The present report assesses the relationship between wage (hourly earnings) and number
of years of education. The objective of the study is how well does the number of years of
education impact wage of a person. The association between the two variables is necessary from
economic point of view.
Background
Education and wage have a causal relationship. In the modern society the wellbeing of a
person is dependent not only capital and labour but also on the level of education. The attainment
of education has been found to be positively associated with healthy lifestyles (Michalos 2017).
A higher level of education symbolizes secure jobs with high pay and benefits. With the
attainment of right level of education and proper training a person may have a higher wage.
However, if proper training is not provided to the person then even with higher level of
education a person may not derive benefits (Lee and Sabharwal 2016).
Wage differences exist in our society (Leuze and Strauß 2014). Wage differences are not
only based on the level of education but also gender. Gender inequality in wages can be
attributed to gender stereotyped enrolment in academic subjects. According to research higher
percentage of women attain education in social sciences, humanities and education, while
subjects like engineering and natural sciences are overrepresented by men (Ochsenfeld 2014).
Thus by the choice of the subject of education differences in wages are created.
Mismatch in wage and level of education is defined according to “assignment theory.”
Underutilization or overutilization of skills creates wage disparity (Badillo-Amador and Vila
2013). However, research shows that the attainment of skill is based on education and learning
ability of a person. Persons with same level of education may have different skill levels as a
result of learning ability, opportunity and demands of the present job (Pecoraro 2016). Thus,
individuals with higher skill sets is bound to garner higher wage and vice versa.
Method
To assess the relationship between the two variables a random sample of 100
observations was collected. Initially we examine the descriptive statistics of the variable. We
have examined the central tendency, dispersion and spread of the collected sample data. The
sampled data is represented graphically to examine the rate of change of the variables. The
association between the variables is tested with the use of regression equation. The regression
equation is used to predict the hourly earnings of a person’s having 12 and 14 years of education.
The rate of change in hourly earnings is also evaluated.
⊘ This is a preview!⊘
Do you want full access?
Subscribe today to unlock all pages.

Trusted by 1+ million students worldwide

3ECONOMICS AND QUANTITATIVE ANALYSIS
Results
A
Table 1: Descriptive Statistics
Statistics Wage Educ
Mean 22.31 13.76
Standard Deviation 14.02 2.73
Minimum 4.33 6.00
Maximum 76.39 21.00
Median 19.39 13.00
1st Quartile 12.02 12.00
3rd Quartile 27.10 16.00
IQR 15.08 4.00
The above table provides a descriptive analysis of the earnings per hour (Wage) and
Years of Education (Educ).
From the above table we find that the minimum and maximum wages of the sample of
100 observations is 4.33 and 76.39 respectively. The average wage of the sample data is 22.31.
The average wages of the sample data has a variation of 14.02. From the sample of 100, half the
number of people get a wage of less than equal to 19.39. 25% of the sampled people have a wage
of less than 12.02. In addition, 25% of the people have a wage of more than or equal to 27.10.
Half the number of people sampled get a wage in the range of 15.08.
From the above table we find that the minimum and maximum education of the sample of
100 observations is 6.00 and 21.00 years respectively. The average numbers of years of
education for the sample data is 13.76 years. There is a variation of 2.73 years in the number of
years of education. Half the number of people sampled have an education of less than or equal to
13 years. 25% of the sampled people have less than 12.00 years of education. In addition, 25% of
the people have more than or equal to 16.00 years of education. Half the number people sampled
have an education in the range of 4.00 years.
Paraphrase This Document
Need a fresh take? Get an instant paraphrase of this document with our AI Paraphraser

4ECONOMICS AND QUANTITATIVE ANALYSIS
B
5 7 9 11 13 15 17 19 21 23
0
10
20
30
40
50
60
70
80
90
f(x) = 2.1237563837879 x − 6.91478784092146
R² = 0.170611590067958
Relation of Education and Wages
Education
Wages
Figure 1: Relation of Education and Wage
The scatter plot shows the relation between the number of years of education and wages
of the sampled population. From the scatter plot it can be inferred that the wages do not have a
linear increase with the number of years of education. The sampled population shows that people
with a fixed level of years of education may have different wages. There is no proportionate
increase in wages with the number of years of education.
C
Table 2: Regression statistics
Regression Statistics
Multiple R 0.4131
R Square 0.1706
Adjusted R Square 0.1621
Standard Error 12.8344
Observations 100
ANOVA
df SS MS F
Significance
F
Regression 1 3320.69 3320.69 20.159 0.000
Residual 98 16142.78 164.72
Total 99 19463.47

5ECONOMICS AND QUANTITATIVE ANALYSIS
Coefficients Standard Error t Stat P-value
Intercept -6.9148 6.6339 -1.0423 0.2998
educ 2.1238 0.4730 4.4899 0.0000
The regression equation that can be used to interpret the relationship between number of
years of education and wages can be depicted as:
Wages = 2.1238*educ – 6.9148
From the above equation it is found that the coefficient of education is 2.1238. Hence it can
be said that for each year increase in education the wage increases by 2.1238.
To test for the association between the number of years of education and wages the p-value
for the sloe coefficient is judged. The p-value for the slope coefficient is 0.0000. Hence it can be
inferred that at 0.05 level of significance there is a statistically significant association between
education and wages.
Regression studies shows that the correlation between number of years of education and
wages is 0.4131. Thus, it can be said that the two variables have positive, moderate correlation.
Moreover, from the sampled data 17.06% of the variability in wages can be predicted from the
number of years of education. Since the predictability of the model is only 17.06% hence the
model is not a good fit.
The regression equation for the relation between education and wage is
Wages = 2.1238*educ – 6.9148
For a person having 12 years of education
Wages = 2.1238*12 – 6.9148 = 25.4856 – 6.9148 = 18.5708
Hence, the earning per hour for a person having 12 years of education is 18.5708.
For a person having 14 years of education
Wages = 2.1238*14 – 6.9148 = 29.7332 – 6.9148 = 22.8184
Hence, the earning per hour for a person having 14 years of education is 22.8184.
Thus, the difference in hourly wage rate for a person having 14 and 12 years of education is
22.8184 – 18.5708 = 4.2476
⊘ This is a preview!⊘
Do you want full access?
Subscribe today to unlock all pages.

Trusted by 1+ million students worldwide

6ECONOMICS AND QUANTITATIVE ANALYSIS
Thus the increase in hourly wage rate is 2.1238.
Discussion
The analysis of the data shows that the wage of sample of the population is skewed to the
right. However, the variable education is normally distributed. In addition, from the scatter plot it
is found that wage does not have a linear growth with years of education. different levels of
hourly earnings are got by persons having same level of education.
Moreover, the predictability of variation in wage from education is also poor although there is a
significant association between wage and years of education.
Recommendation
From the study on the association it would be prudent to say that more research should be
done to investigate the differences in wage pattern and education. Previous research suggests that
there is a disparity in education between gender. Thus it can be recommended that government
should investigate and reduce gender gap in different subjects of education.
Paraphrase This Document
Need a fresh take? Get an instant paraphrase of this document with our AI Paraphraser

7ECONOMICS AND QUANTITATIVE ANALYSIS
References
Badillo-Amador, L. and Vila, L.E., 2013. Education and skill mismatches: wage and job
satisfaction consequences. International Journal of Manpower, 34(5), pp.416-428.
Lee, Y.J. and Sabharwal, M., 2016. Education–job match, salary, and job satisfaction across the
public, non-profit, and for-profit sectors: Survey of recent college graduates. Public
Management Review, 18(1), pp.40-64.
Leuze, K. and Strauß, S., 2014. Female-typical subjects and their effect on wage inequalities
among higher education graduates in Germany. European Societies, 16(2), pp.275-298.
Michalos, A.C., 2017. Education, happiness and wellbeing. In Connecting the Quality of Life
Theory to Health, Well-being and Education (pp. 277-299). Springer, Cham.
Ochsenfeld, F., 2014. Why do women’s fields of study pay less? A test of devaluation, human
capital, and gender role theory. European Sociological Review, 30(4), pp.536-548.
Pecoraro, M., 2016. The incidence and wage effects of overeducation using the vertical and
horizontal mismatch in skills: Evidence from Switzerland. International Journal of
Manpower, 37(3), pp.536-555.
1 out of 8
Related Documents

Your All-in-One AI-Powered Toolkit for Academic Success.
+13062052269
info@desklib.com
Available 24*7 on WhatsApp / Email
Unlock your academic potential
© 2024 | Zucol Services PVT LTD | All rights reserved.