Analysis of Low Wage Growth and Economic Risks in Australia

Verified

Added on  2021/06/16

|15
|2105
|20
Report
AI Summary
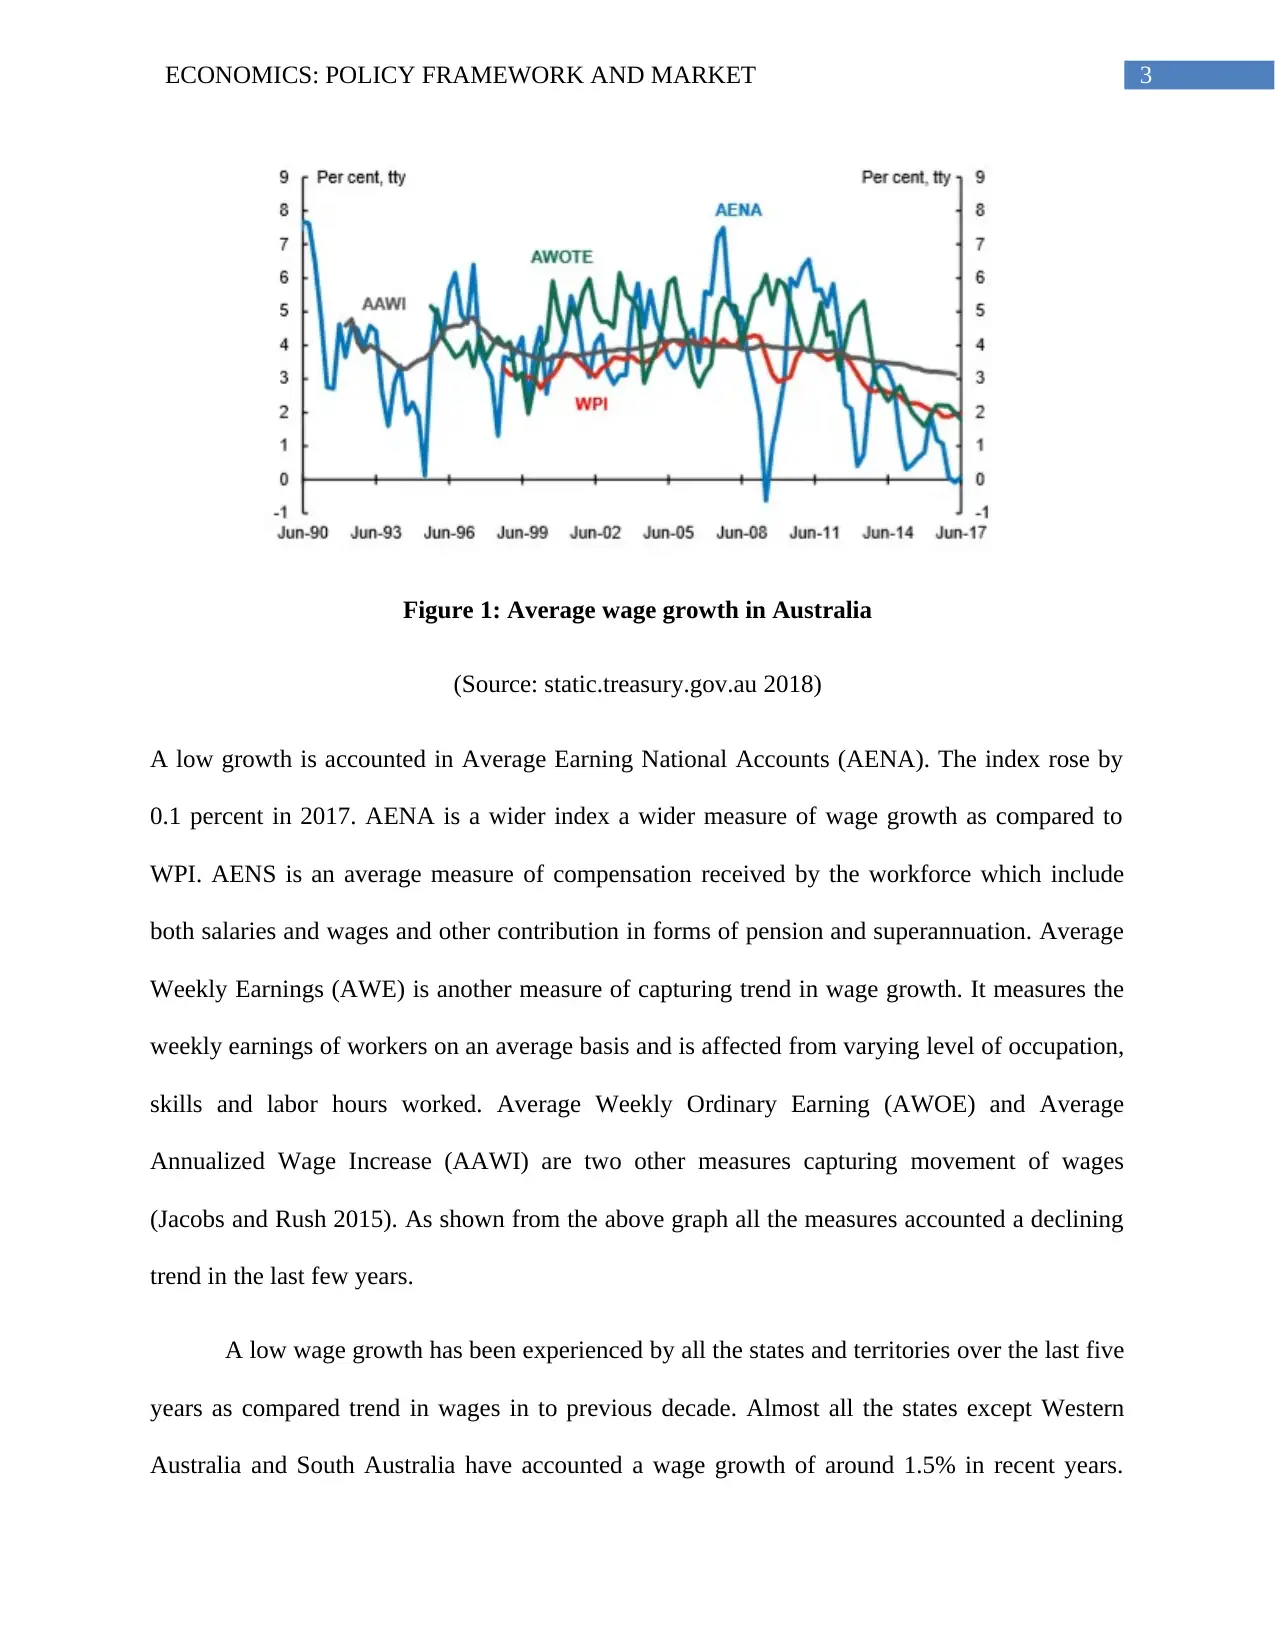
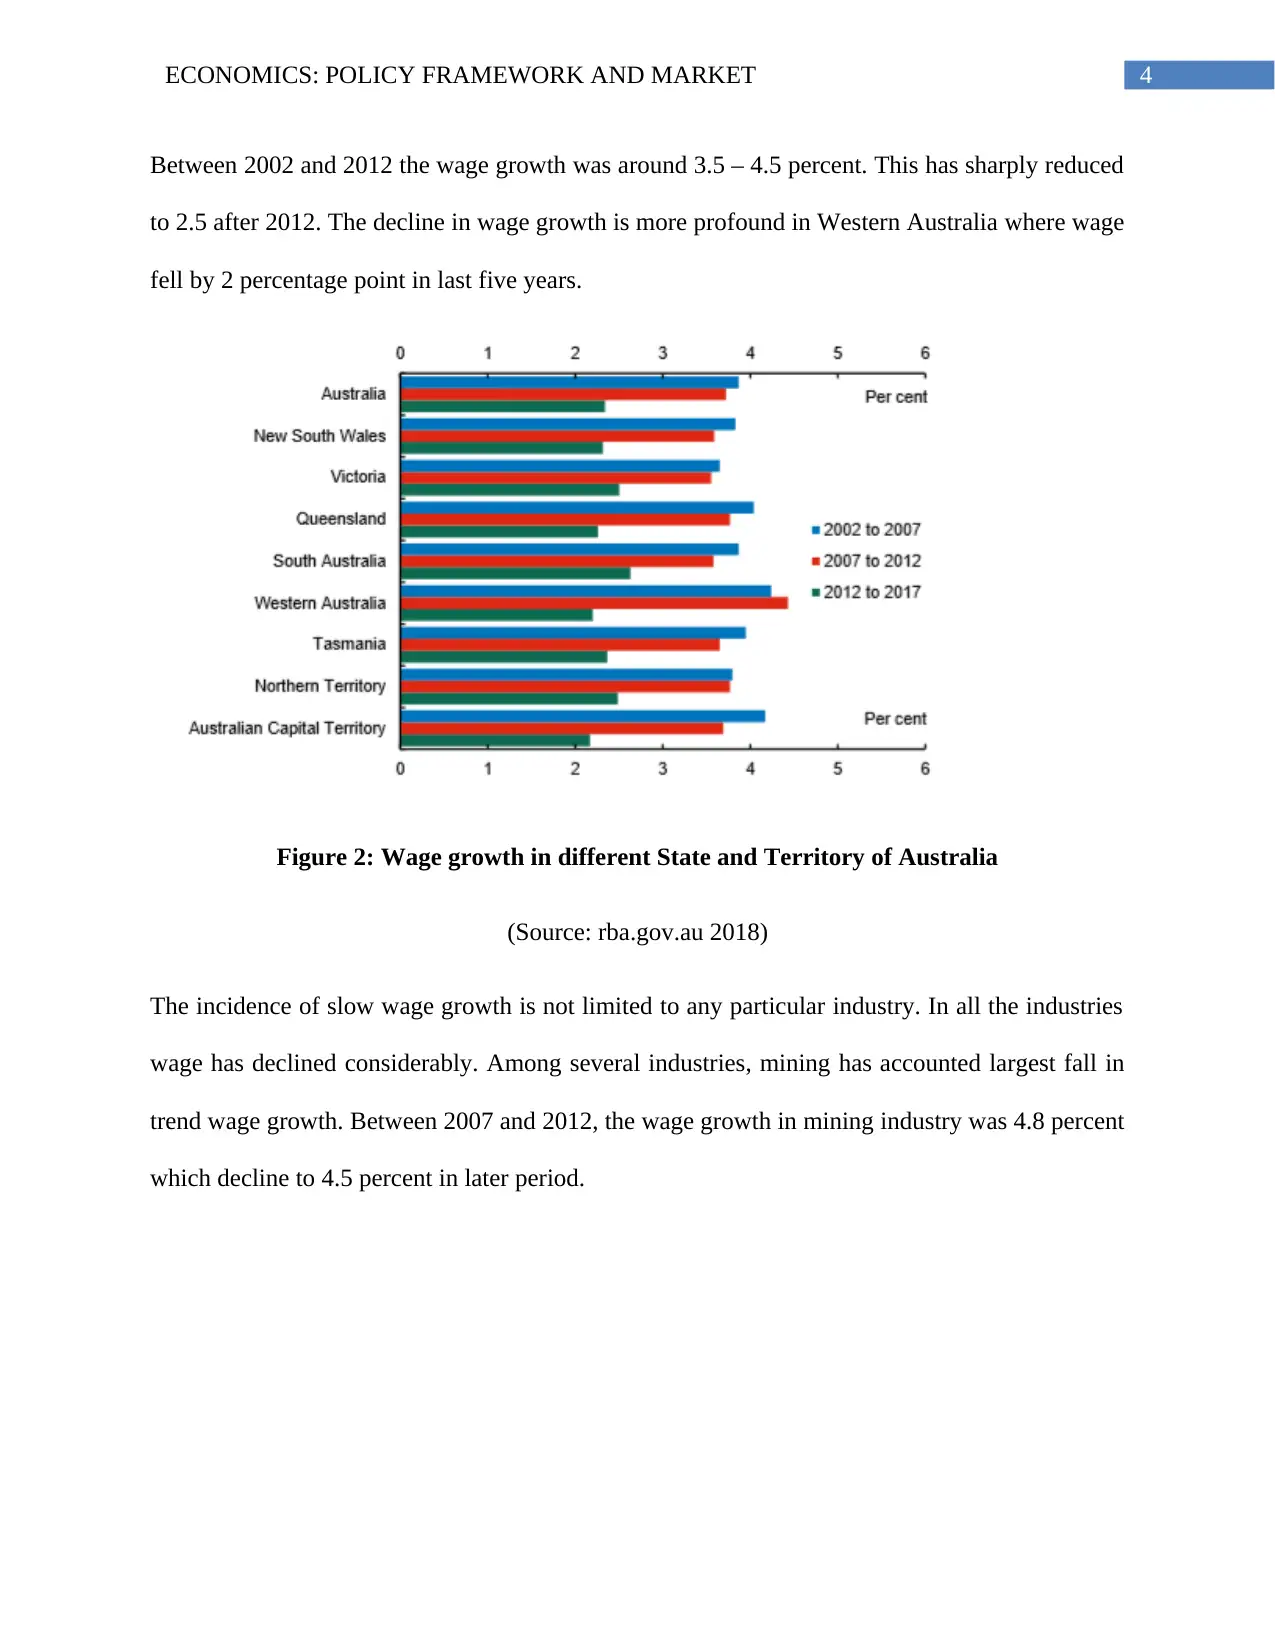
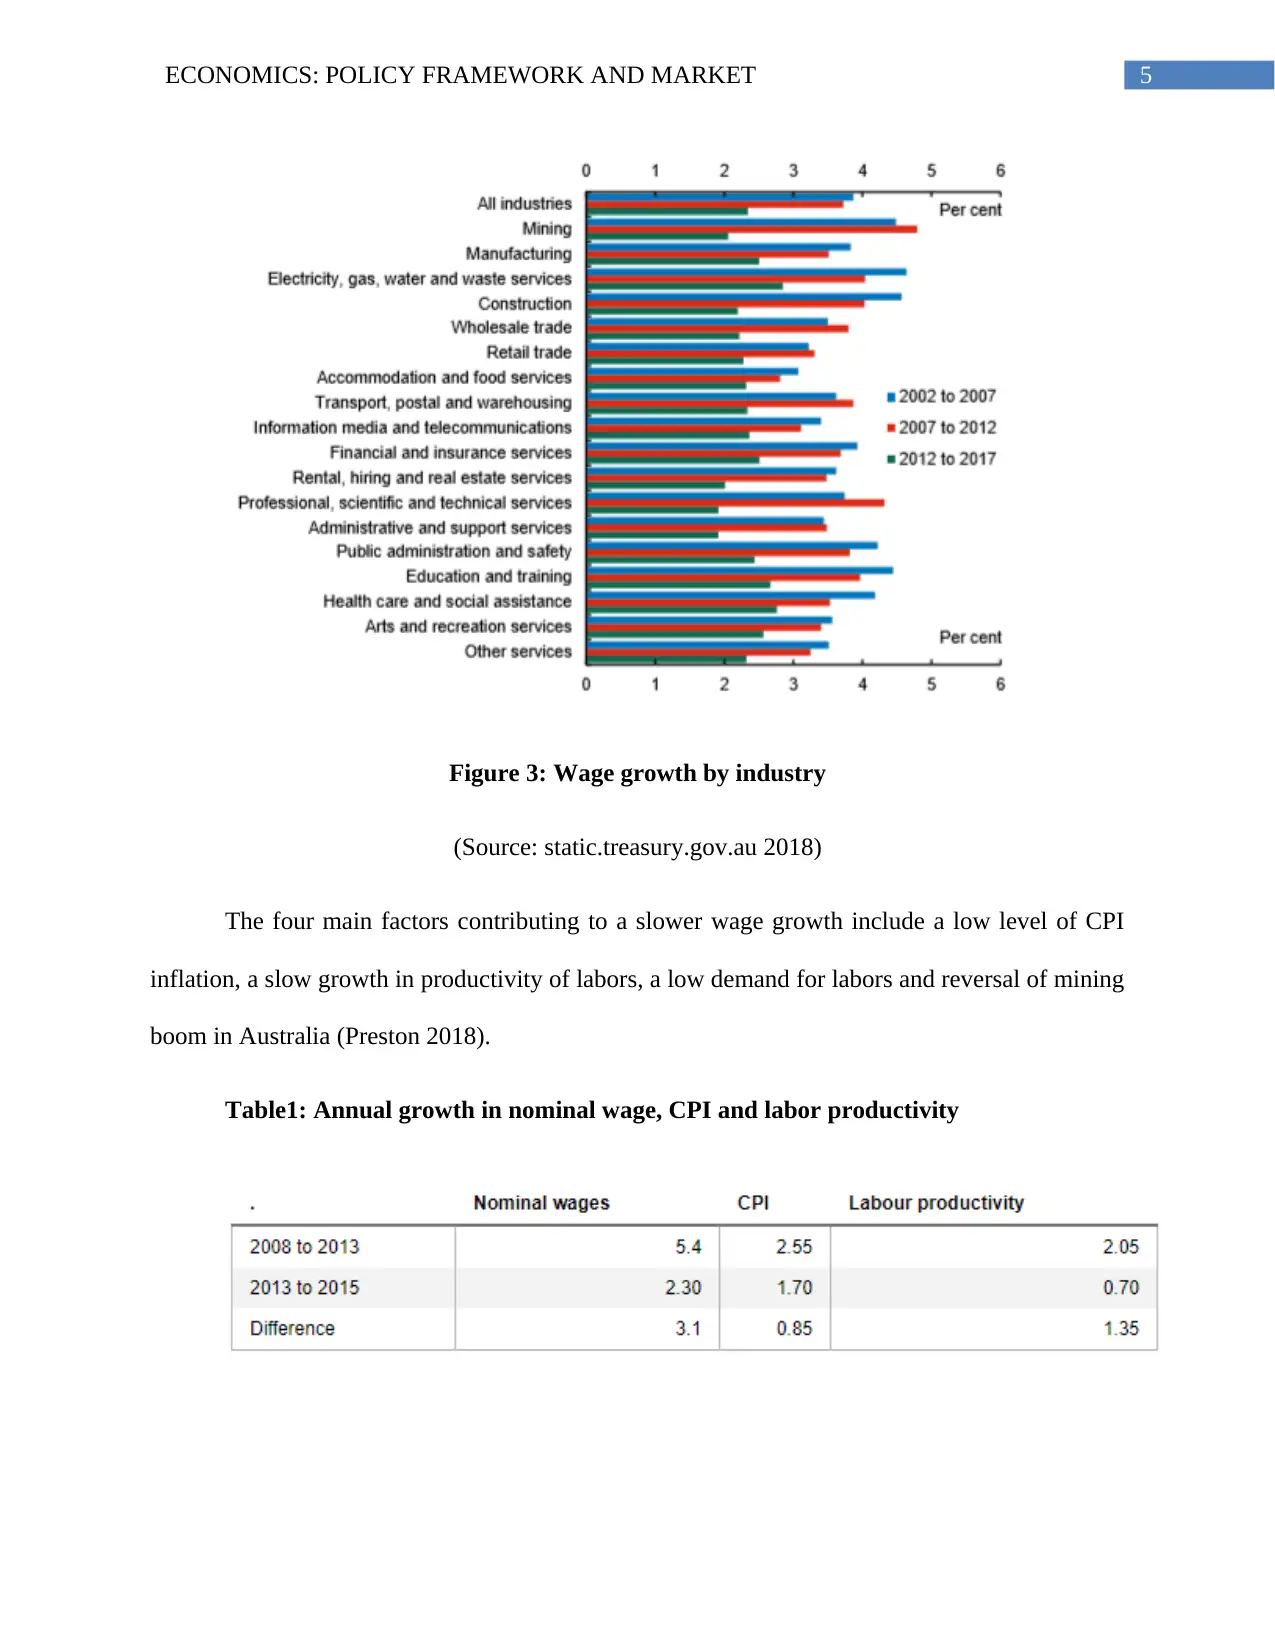
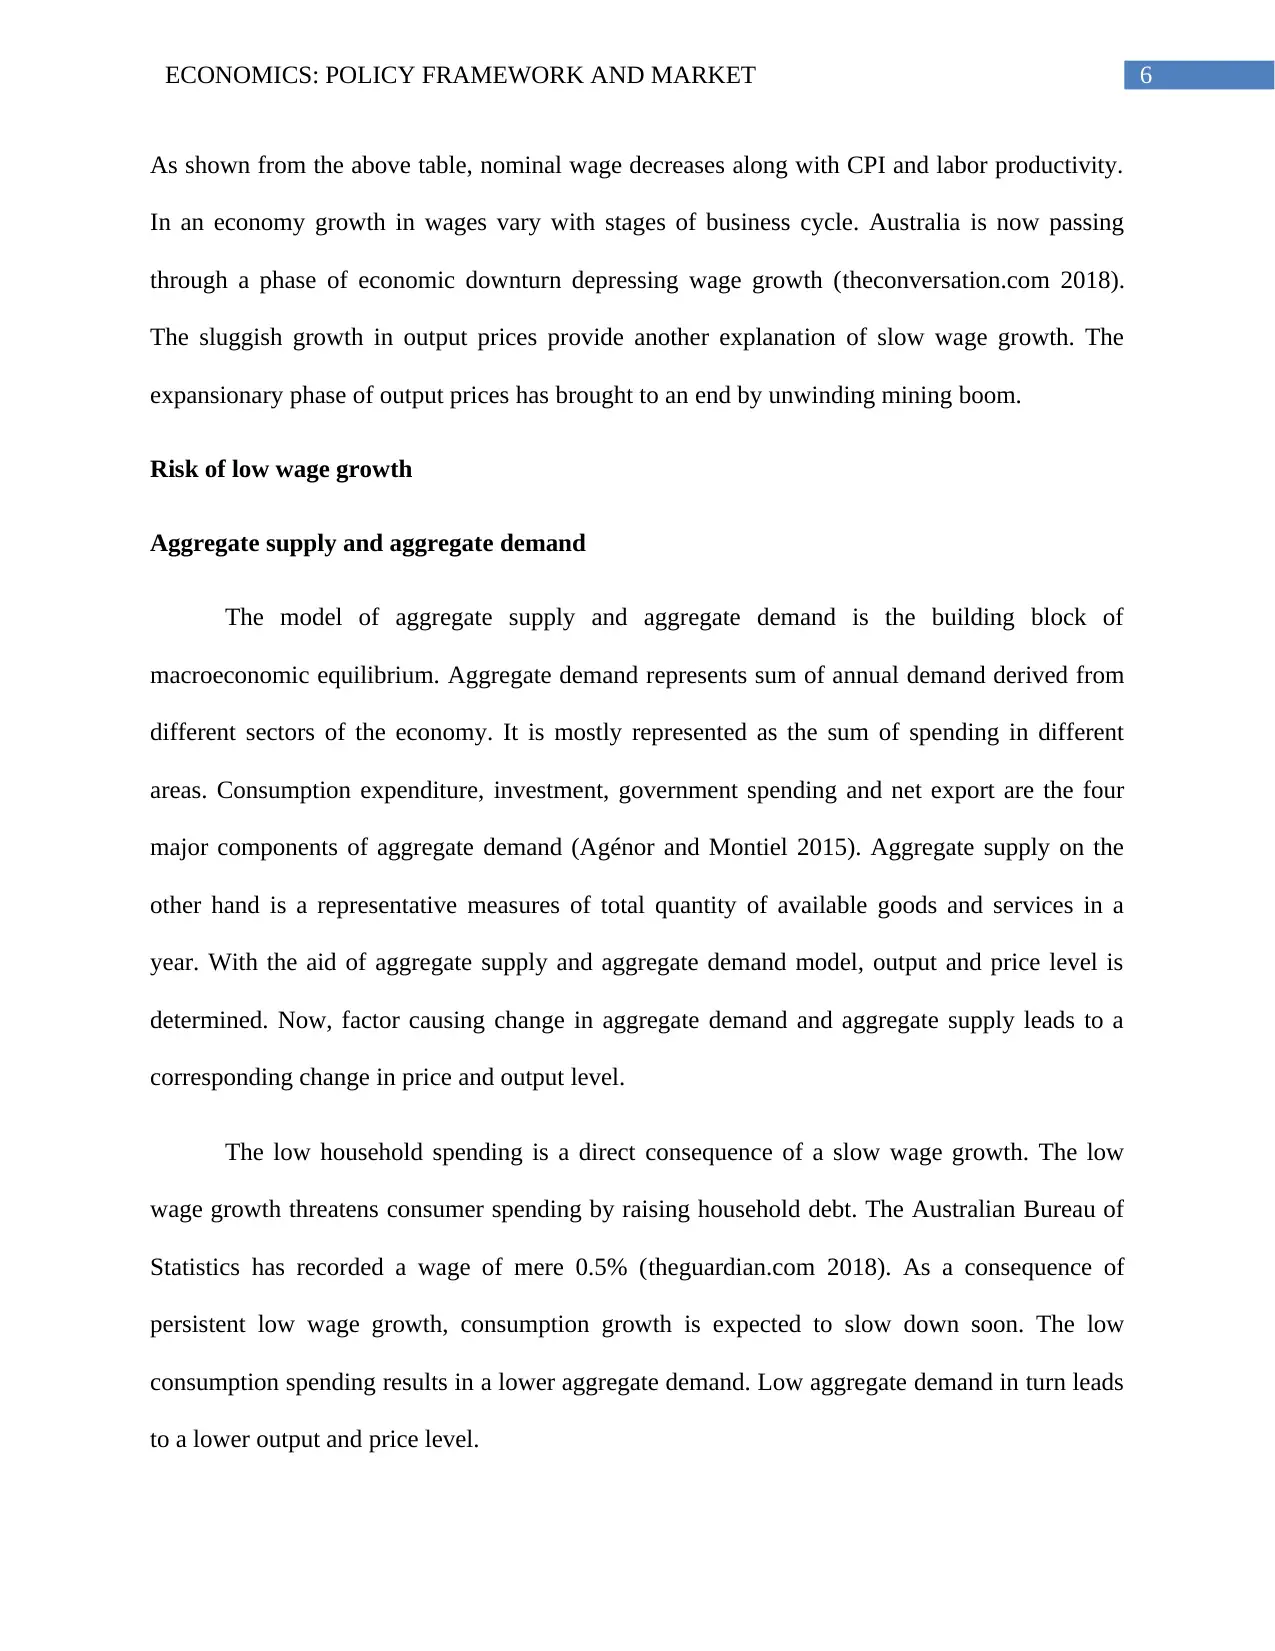
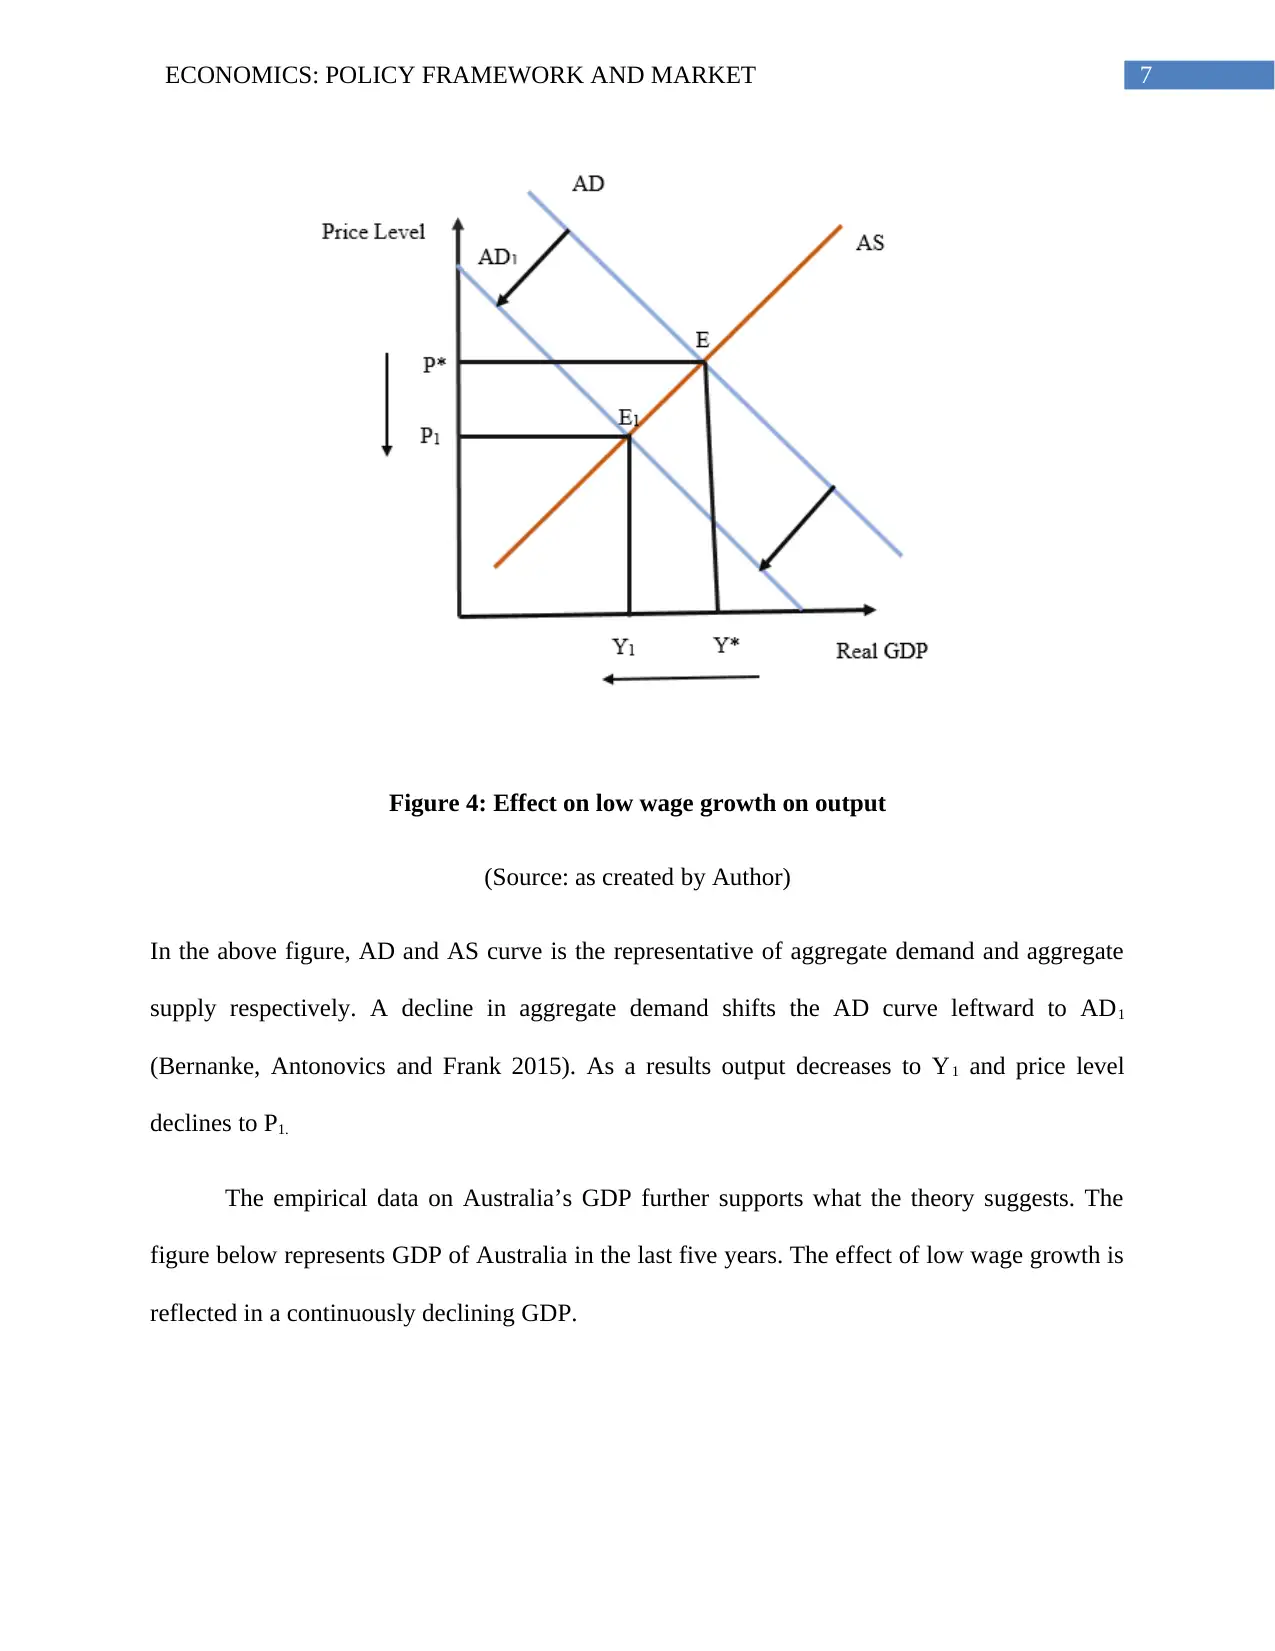
This economics report provides a comprehensive analysis of the phenomenon of low wage growth in Australia. It begins by examining the trends in wage growth over recent years, highlighting various measures such as the wage price index and average earnings, and discussing the decline across different industries and states. The report then delves into the factors contributing to this slow wage growth, including low inflation, productivity, and demand for labor. Using macroeconomic models, the report explores the risks associated with low wage growth, such as its impact on aggregate demand, leading to lower output and price levels. It also discusses the relationship between low wage growth and inflation, noting that the inflation rate has fallen below the target level. Furthermore, the report examines the short-run consequences of low wage growth on unemployment, explaining how firms may respond by reducing labor costs. The analysis includes relevant figures and data from credible sources, supporting its arguments with economic theories. Finally, the report concludes with an overview of the key findings and implications of the observed wage trends.
tabler-icon-diamond-filled.svg

Contribute Materials

Your contribution can guide someone’s learning journey. Share your documents today.
Document Page
Running Head: ECONOMICS: POLICY FRAMEWWORK AND MARKET
Economics: Policy Framework and Market
Name of the Student
Name of the University
Course ID
tabler-icon-diamond-filled.svg

Secure Best Marks with AI Grader

Need help grading? Try our AI Grader for instant feedback on your assignments.
Document Page
1ECONOMICS: POLICY FRAMEWORK AND MARKET
Table of Contents
Introduction......................................................................................................................................2
Low wage growth in Australia........................................................................................................2
Risk of low wage growth.................................................................................................................6
Aggregate supply and aggregate demand....................................................................................6
Low wage growth and inflation...................................................................................................8
Wage growth and unemployment................................................................................................9
Conclusion.....................................................................................................................................11
Reference list.................................................................................................................................13
Document Page
2ECONOMICS: POLICY FRAMEWORK AND MARKET
Introduction
The rate of change in wages has important implication for the economy. For most of the
household a major source of income is the wage income. For firms also wage cost represents an
important part of business cost. In recent years, Australia has accounted weak wage growth along
with a lower than targeted inflation rate. A report published by IMF suggests that since the ends
of mining boom in 2000s Australia has recorded a robust economic performance. The economy
however has yet not returned to the full employment level. It is still exposed to risks of
household debt and imbalances in housing market (rba.gov.au 2018). The low wage growth in
Australia is unique to the economy. The paper discusses trend of wage growth in the last few
years with reference to the likely cause of existing trend. The risk of low wage growth has been
discussed using relevant macroeconomic theories.
Low wage growth in Australia
Different measures of aggregate wages indicate that labor market in Australia has
accounted a slow wage growth. A pure measure of wages based on price is wage price index.
The index measures salaries and wages keeping quantity and quality of labor constant. In the
third quarter of 2017, wage price index rose by 1.9 percent (static.treasury.gov.au 2018). This is
the lowest rate since 1997.
Document Page
3ECONOMICS: POLICY FRAMEWORK AND MARKET
Figure 1: Average wage growth in Australia
(Source: static.treasury.gov.au 2018)
A low growth is accounted in Average Earning National Accounts (AENA). The index rose by
0.1 percent in 2017. AENA is a wider index a wider measure of wage growth as compared to
WPI. AENS is an average measure of compensation received by the workforce which include
both salaries and wages and other contribution in forms of pension and superannuation. Average
Weekly Earnings (AWE) is another measure of capturing trend in wage growth. It measures the
weekly earnings of workers on an average basis and is affected from varying level of occupation,
skills and labor hours worked. Average Weekly Ordinary Earning (AWOE) and Average
Annualized Wage Increase (AAWI) are two other measures capturing movement of wages
(Jacobs and Rush 2015). As shown from the above graph all the measures accounted a declining
trend in the last few years.
A low wage growth has been experienced by all the states and territories over the last five
years as compared trend in wages in to previous decade. Almost all the states except Western
Australia and South Australia have accounted a wage growth of around 1.5% in recent years.
tabler-icon-diamond-filled.svg

Secure Best Marks with AI Grader

Need help grading? Try our AI Grader for instant feedback on your assignments.
Document Page
4ECONOMICS: POLICY FRAMEWORK AND MARKET
Between 2002 and 2012 the wage growth was around 3.5 – 4.5 percent. This has sharply reduced
to 2.5 after 2012. The decline in wage growth is more profound in Western Australia where wage
fell by 2 percentage point in last five years.
Figure 2: Wage growth in different State and Territory of Australia
(Source: rba.gov.au 2018)
The incidence of slow wage growth is not limited to any particular industry. In all the industries
wage has declined considerably. Among several industries, mining has accounted largest fall in
trend wage growth. Between 2007 and 2012, the wage growth in mining industry was 4.8 percent
which decline to 4.5 percent in later period.
Document Page
5ECONOMICS: POLICY FRAMEWORK AND MARKET
Figure 3: Wage growth by industry
(Source: static.treasury.gov.au 2018)
The four main factors contributing to a slower wage growth include a low level of CPI
inflation, a slow growth in productivity of labors, a low demand for labors and reversal of mining
boom in Australia (Preston 2018).
Table1: Annual growth in nominal wage, CPI and labor productivity
Document Page
6ECONOMICS: POLICY FRAMEWORK AND MARKET
As shown from the above table, nominal wage decreases along with CPI and labor productivity.
In an economy growth in wages vary with stages of business cycle. Australia is now passing
through a phase of economic downturn depressing wage growth (theconversation.com 2018).
The sluggish growth in output prices provide another explanation of slow wage growth. The
expansionary phase of output prices has brought to an end by unwinding mining boom.
Risk of low wage growth
Aggregate supply and aggregate demand
The model of aggregate supply and aggregate demand is the building block of
macroeconomic equilibrium. Aggregate demand represents sum of annual demand derived from
different sectors of the economy. It is mostly represented as the sum of spending in different
areas. Consumption expenditure, investment, government spending and net export are the four
major components of aggregate demand (Agénor and Montiel 2015). Aggregate supply on the
other hand is a representative measures of total quantity of available goods and services in a
year. With the aid of aggregate supply and aggregate demand model, output and price level is
determined. Now, factor causing change in aggregate demand and aggregate supply leads to a
corresponding change in price and output level.
The low household spending is a direct consequence of a slow wage growth. The low
wage growth threatens consumer spending by raising household debt. The Australian Bureau of
Statistics has recorded a wage of mere 0.5% (theguardian.com 2018). As a consequence of
persistent low wage growth, consumption growth is expected to slow down soon. The low
consumption spending results in a lower aggregate demand. Low aggregate demand in turn leads
to a lower output and price level.
tabler-icon-diamond-filled.svg

Paraphrase This Document

Need a fresh take? Get an instant paraphrase of this document with our AI Paraphraser
Document Page
7ECONOMICS: POLICY FRAMEWORK AND MARKET
Figure 4: Effect on low wage growth on output
(Source: as created by Author)
In the above figure, AD and AS curve is the representative of aggregate demand and aggregate
supply respectively. A decline in aggregate demand shifts the AD curve leftward to AD1
(Bernanke, Antonovics and Frank 2015). As a results output decreases to Y1 and price level
declines to P1.
The empirical data on Australia’s GDP further supports what the theory suggests. The
figure below represents GDP of Australia in the last five years. The effect of low wage growth is
reflected in a continuously declining GDP.
Document Page
8ECONOMICS: POLICY FRAMEWORK AND MARKET
Figure 5: GDP of Australia in the last five years
(Source: tradingeconomics.com 2018)
Low wage growth and inflation
Another associated theory with the risk of low wage growth is the theory of inflation.
Inflation is a measure of a movement of price level. As evident from aggregate demand and
aggregate supply model a decline in aggregate demand creates a downward pressure on the price
level. Low household spending drags the price level (Heijdra 2017). The sharp decline in wage
growth, leads to an unwelcome decline in the prevailing inflation rate. The inflation rate sets
below the targeted level of 2-3% (theguardian.com 2018).
Document Page
9ECONOMICS: POLICY FRAMEWORK AND MARKET
Figure 6: Trend in inflation rate
(Source: tradingeconomics.com 2018)
Rate of inflation below the targeted level has locked the economy in a trap of low inflation.
Sectors such as tobacco, health and housing is experiencing a modest rate of inflation. The effect
however is offset by a huge disinflationary pressure on consumer goods. The inflation is
unevenly distributed in the economy. The low inflation has an adverse consequence on future
wage expectation. Low inflation results in a low inflation expectation for future and further
reinforces a low wage growth.
Wage growth and unemployment
In the short run, a low wage growth is associated with a high rate of unemployment. With
a low household spending firms face insufficient demand for the produced goods and services.
Under this situation, firms are willing to recover cost of production which includes the labor
cost. In order to content labor cost, firms start to lay off workers, reduce labor hours or stop
hiring new workers (Uribe and Schmitt-Grohé 2017). With a lack of demand in the labor market,
the anxiety among employees increases and they are forced to accept the low wages. With a
tabler-icon-diamond-filled.svg

Secure Best Marks with AI Grader

Need help grading? Try our AI Grader for instant feedback on your assignments.
Document Page
10ECONOMICS: POLICY FRAMEWORK AND MARKET
fluctuating condition in the labor market the economy gradually moves along the Phillips curve
as shown in the figure below
Figure 7: Wage Philips Curve
(Source: Jacobs and Rush 2015)
Fall in wage growth since the last five years is found to be relatively large as compared to
increase in unemployment rate. The estimated relationship from 1998 to 2012 shows that the
decline in WPI is twice more than the expected rate. The measure based on AENA suggests that
adjustment in wage is fairly large for a given change in unemployment. At present, it is found
that wages have declined sharply with a sharp increase in unemployment.
Document Page
11ECONOMICS: POLICY FRAMEWORK AND MARKET
Figure 7: Unemployment and downturn in wages
(Source: rba.gov.au 2018)
Conclusion
In Australia, there is a clear evidence of declining wage growth especially in the last five
years. Different measures of wage trends reveal a sharp declining trend. The wage slow-down is
not limited to any particular industry rather it has spread to all industries. The same picture of a
declining wage trend is found to exits in all states and territories. The factors held responsible for
slow growth in wages include a decline in consumer price index, low growth of labor
productivity, low output prices and turmoil in mining industry. The low wages growth comes
with several risk for the economy. Low wage cause aggregate demand to fall through a decline in
consumer spending. This in turn leads to a fall in both output and price. Australia is now stuck at
Document Page
12ECONOMICS: POLICY FRAMEWORK AND MARKET
an inflation rate lower than the expected. The low wage also has an unwanted consequence of
high unemployment rate.
tabler-icon-diamond-filled.svg

Paraphrase This Document

Need a fresh take? Get an instant paraphrase of this document with our AI Paraphraser
Document Page
13ECONOMICS: POLICY FRAMEWORK AND MARKET
Reference list
Agénor, P.R. and Montiel, P.J., 2015. Development Macroeconomics Fourth edition. Economics
Books.
Bernanke, B., Antonovics, K. and Frank, R., 2015. Principles of macroeconomics. McGraw-Hill
Higher Education.
Bishop, J. and Cassidy, N. (2018). [online] Rba.gov.au. Available at:
https://www.rba.gov.au/publications/bulletin/2017/mar/pdf/bu-0317-2-insights-into-low-wage-
growth-in-australia.pdf [Accessed 8 May 2018].
Heijdra, B.J., 2017. Foundations of modern macroeconomics. Oxford university press.
Hutchens, G. (2018). Australia ‘locked’ into low inflation and low wage growth, economists fear.
[online] the Guardian. Available at:
https://www.theguardian.com/business/2018/jan/31/australia-locked-into-low-inflation-and-low-
wage-growth-economists-fear [Accessed 8 May 2018].
Jacobs, D. and Rush, A., 2015. Why is wage growth so low?. RBA Bulletin, June, pp.9-18.
Preston, A., 2018. The structure and determinants of wage relativities: evidence from Australia.
Routledge.
Static.treasury.gov.au. (2018). Analysis of wage growth. [online] Available at:
https://static.treasury.gov.au/uploads/sites/1/2017/11/p2017-t237966.pdf [Accessed 8 May
2018].
Document Page
14ECONOMICS: POLICY FRAMEWORK AND MARKET
The Conversation. (2018). Budget explainer: why is Australia's wage growth so sluggish?.
[online] Available at: https://theconversation.com/budget-explainer-why-is-australias-wage-
growth-so-sluggish-56597 [Accessed 8 May 2018].
Tradingeconomics.com. (2018). Australia GDP | 1960-2018 | Data | Chart | Calendar |
Forecast | News. [online] Available at: https://tradingeconomics.com/australia/gdp [Accessed 8
May 2018].
Tradingeconomics.com. (2018). Australia Inflation Rate | 1951-2018 | Data | Chart | Calendar |
Forecast. [online] Available at: https://tradingeconomics.com/australia/inflation-cpi [Accessed 8
May 2018].
Uribe, M. and Schmitt-Grohé, S., 2017. Open economy macroeconomics. Princeton University
Press.
chevron_up_icon
1 out of 15
circle_padding
hide_on_mobile
zoom_out_icon
logo.png

Your All-in-One AI-Powered Toolkit for Academic Success.

Available 24*7 on WhatsApp / Email

[object Object]