Data Analysis and Forecasting Report: Edinburgh Weather over 10 Days

Verified

Added on  2021/02/20

|9
|1350
|40
Report
AI Summary
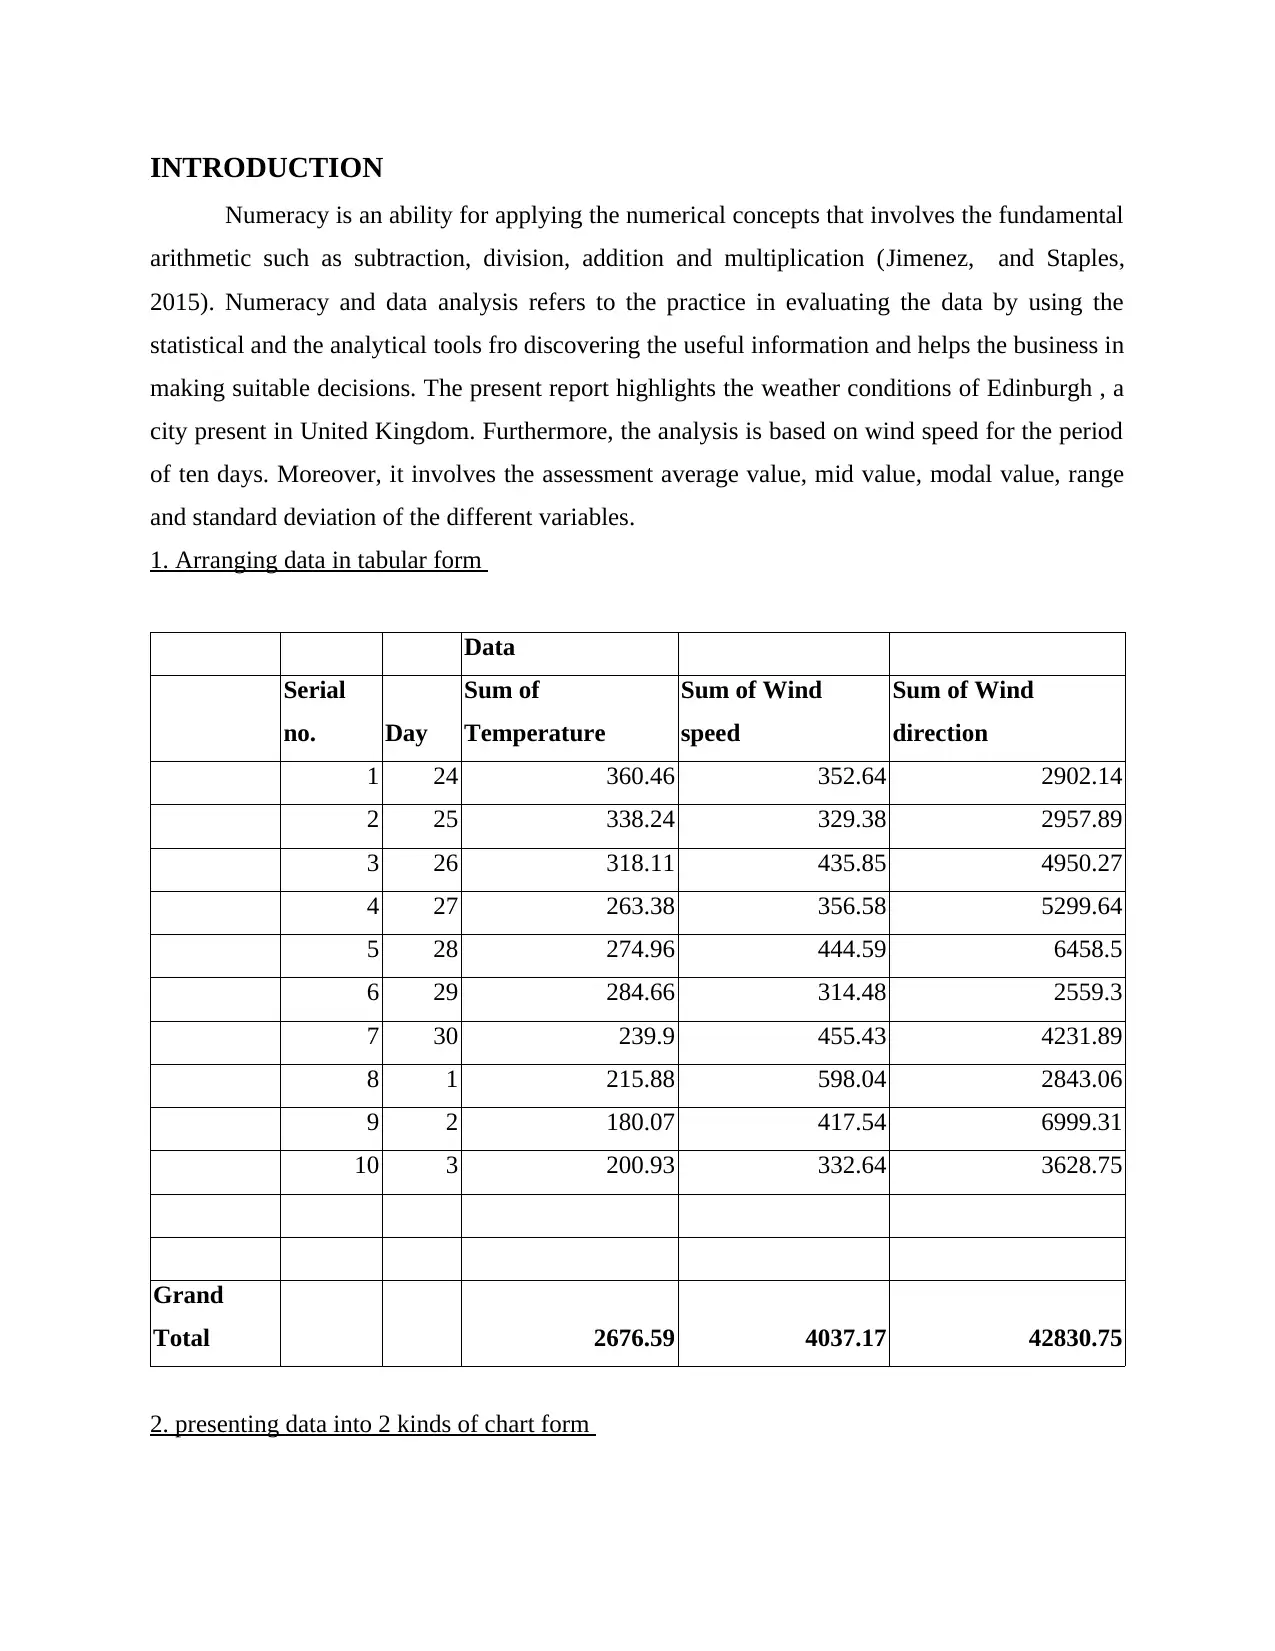
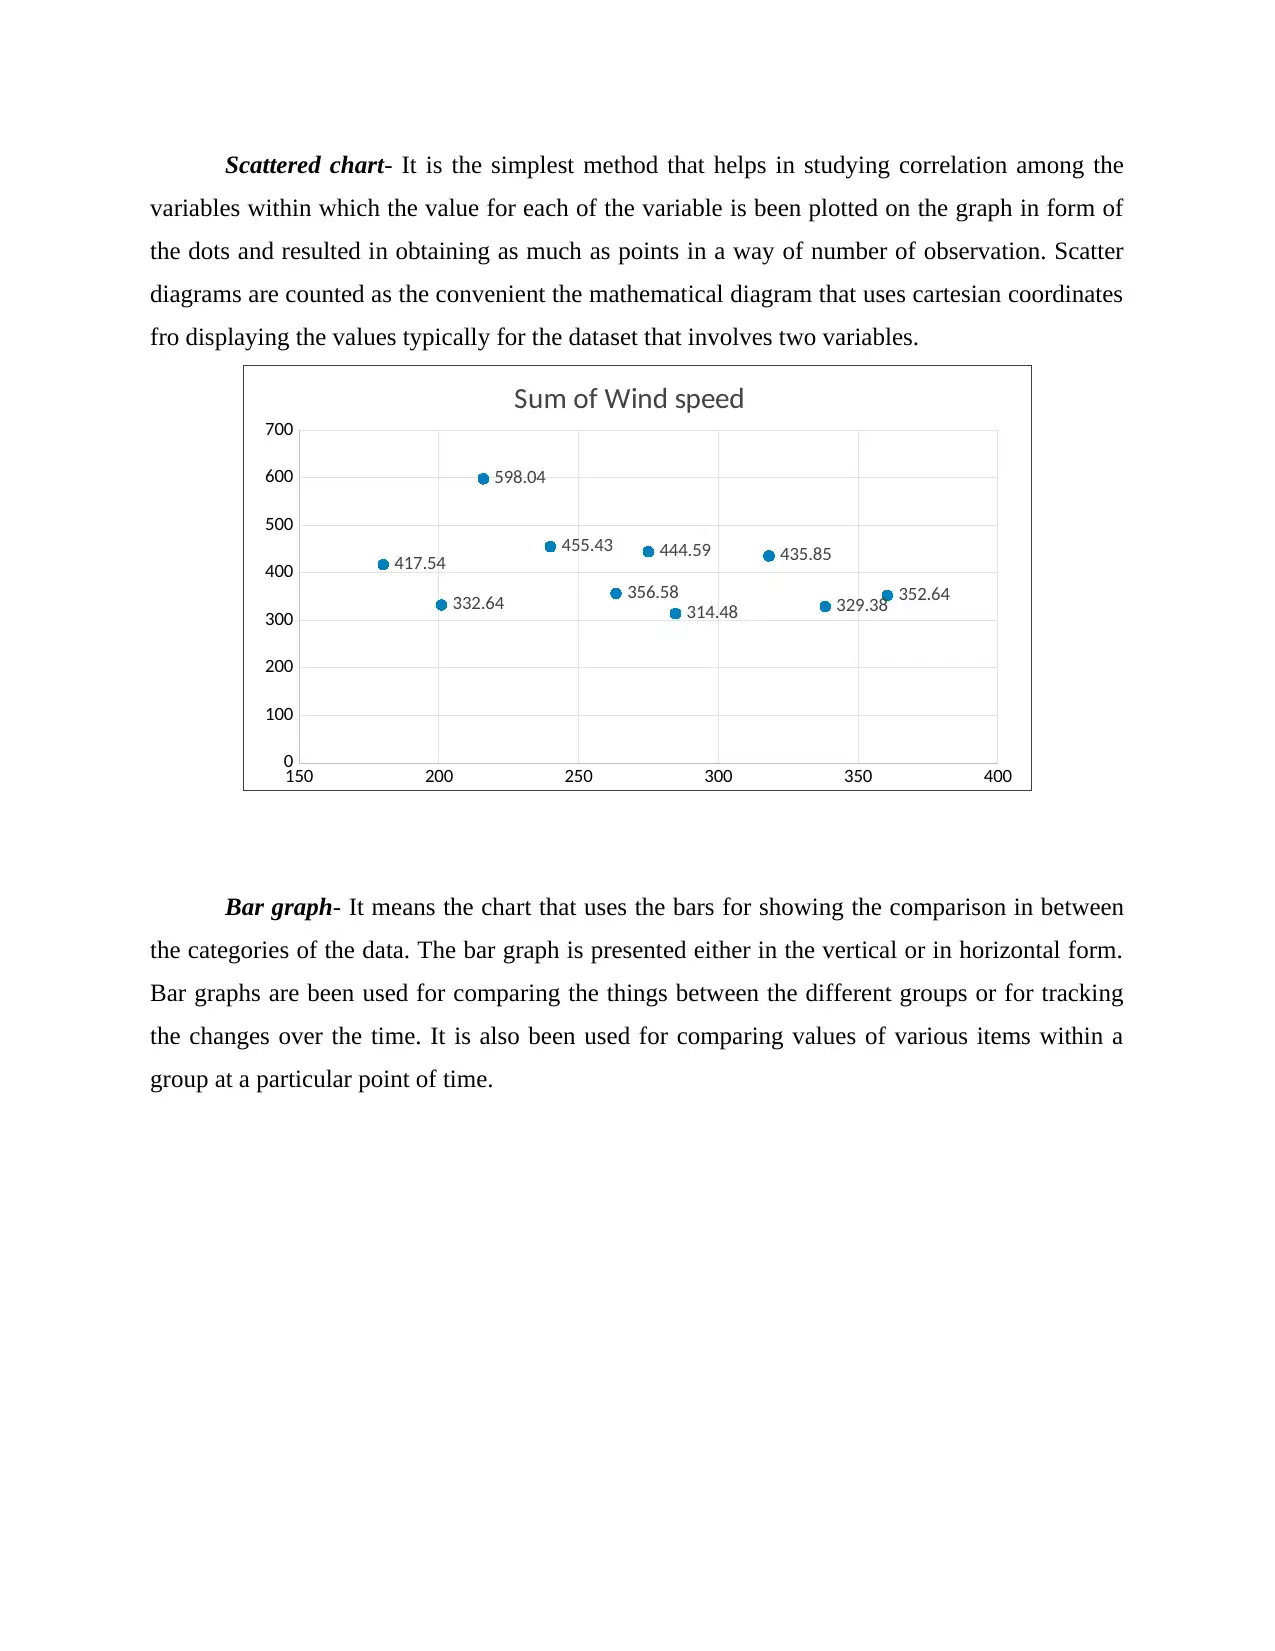
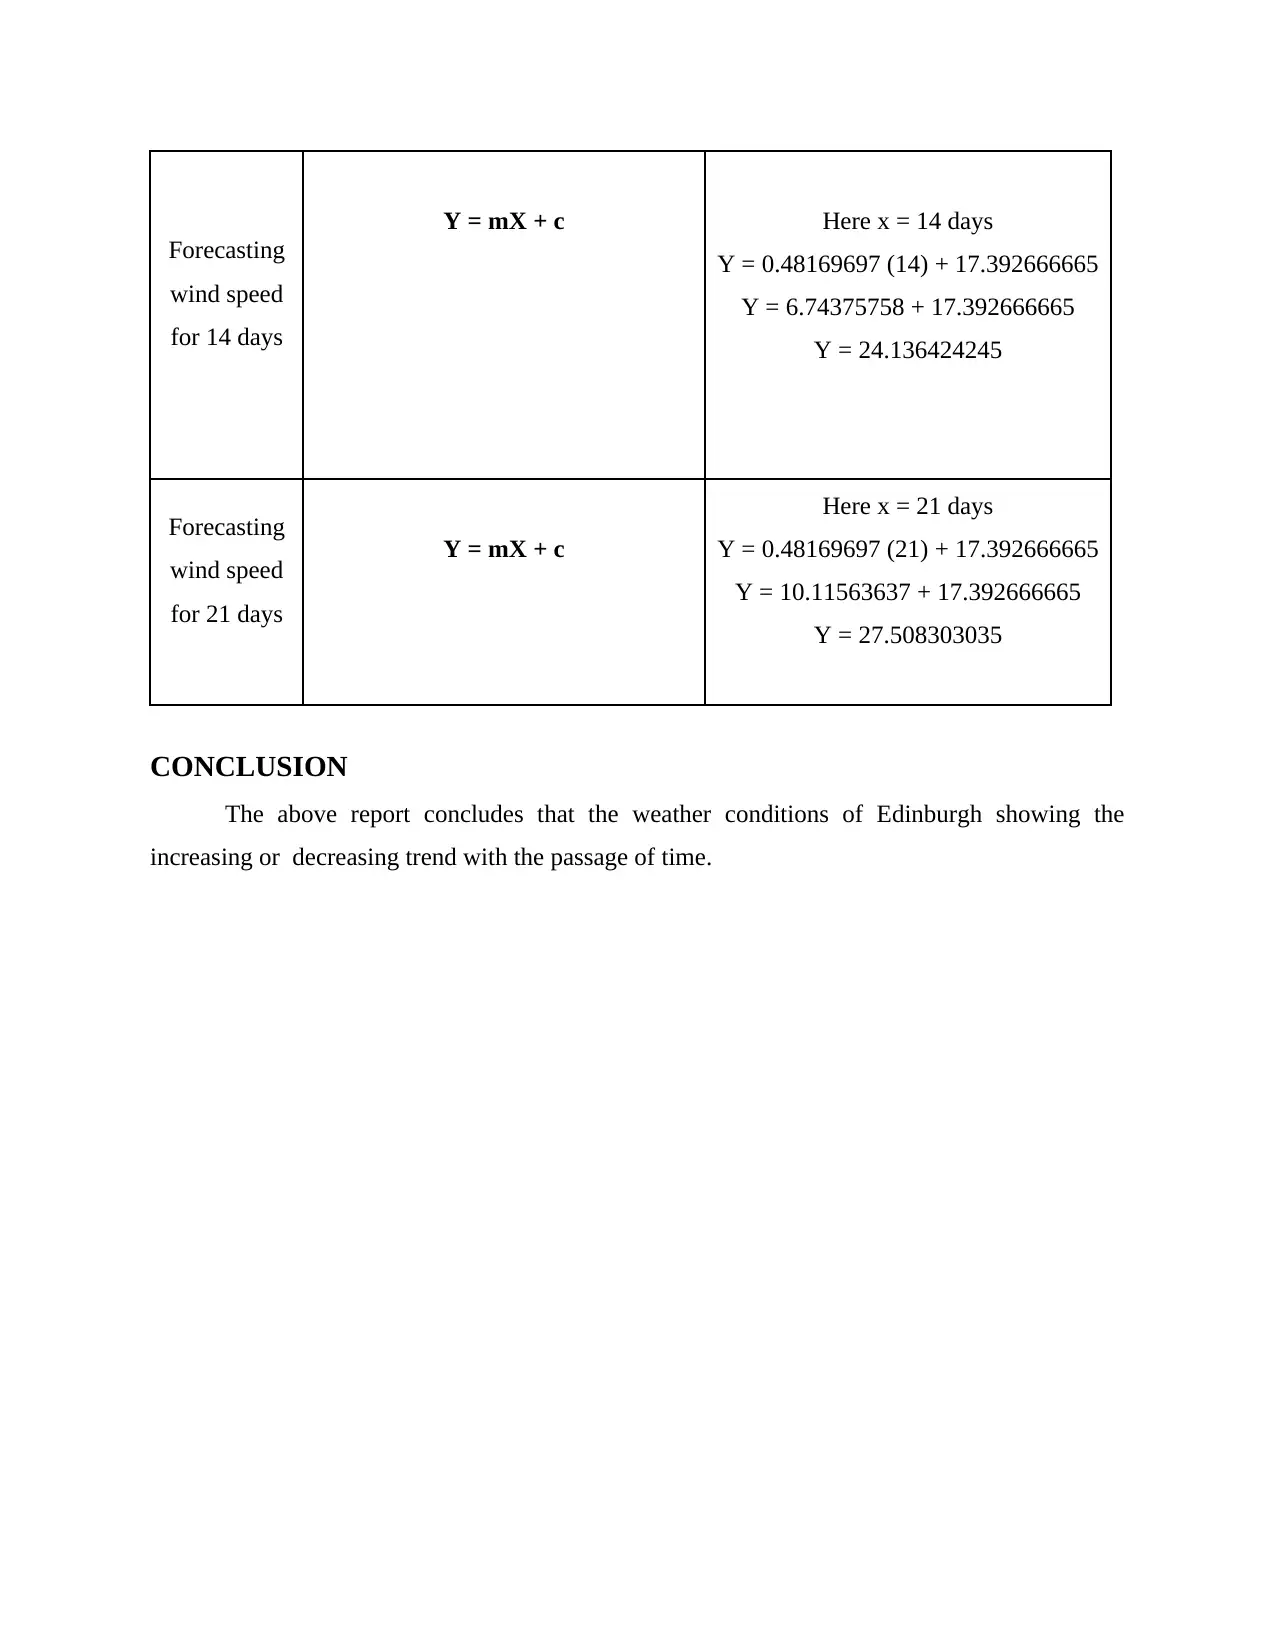
This report presents a data analysis and forecasting study of Edinburgh's weather conditions over a ten-day period. It begins by organizing the data in a tabular format, detailing temperature, wind speed, and wind direction. The report then visualizes the data using scatter charts and bar graphs to illustrate relationships and comparisons. Further analysis includes calculating central tendencies (mean, median, mode), range, and standard deviation for each variable. Finally, the report employs a linear forecasting model to predict wind speed for future days, evaluating the values of 'm' and 'c' within the model. The analysis provides insights into the trends and variability of the weather parameters. The report concludes that the weather conditions of Edinburgh showing the increasing or decreasing trend with the passage of time.
Document Page
Data Analysis and Forecasting
tabler-icon-diamond-filled.svg

Paraphrase This Document

Need a fresh take? Get an instant paraphrase of this document with our AI Paraphraser
Document Page
Table of Contents
INTRODUCTION ..........................................................................................................................3
1. Arranging data in tabular form ...............................................................................................3
2. presenting data into 2 kinds of chart form ..............................................................................3
3. Computing central tendencies, range and std. Deviation ........................................................4
4. Using the linear forecasting model, evaluating the value of m and c. ....................................5
REFERENCES................................................................................................................................6
Document Page
INTRODUCTION
Numeracy is an ability for applying the numerical concepts that involves the fundamental
arithmetic such as subtraction, division, addition and multiplication (Jimenez, and Staples,
2015). Numeracy and data analysis refers to the practice in evaluating the data by using the
statistical and the analytical tools fro discovering the useful information and helps the business in
making suitable decisions. The present report highlights the weather conditions of Edinburgh , a
city present in United Kingdom. Furthermore, the analysis is based on wind speed for the period
of ten days. Moreover, it involves the assessment average value, mid value, modal value, range
and standard deviation of the different variables.
1. Arranging data in tabular form
Data
Serial
no. Day
Sum of
Temperature
Sum of Wind
speed
Sum of Wind
direction
1 24 360.46 352.64 2902.14
2 25 338.24 329.38 2957.89
3 26 318.11 435.85 4950.27
4 27 263.38 356.58 5299.64
5 28 274.96 444.59 6458.5
6 29 284.66 314.48 2559.3
7 30 239.9 455.43 4231.89
8 1 215.88 598.04 2843.06
9 2 180.07 417.54 6999.31
10 3 200.93 332.64 3628.75
Grand
Total 2676.59 4037.17 42830.75
2. presenting data into 2 kinds of chart form
Document Page
Scattered chart- It is the simplest method that helps in studying correlation among the
variables within which the value for each of the variable is been plotted on the graph in form of
the dots and resulted in obtaining as much as points in a way of number of observation. Scatter
diagrams are counted as the convenient the mathematical diagram that uses cartesian coordinates
fro displaying the values typically for the dataset that involves two variables.
Bar graph- It means the chart that uses the bars for showing the comparison in between
the categories of the data. The bar graph is presented either in the vertical or in horizontal form.
Bar graphs are been used for comparing the things between the different groups or for tracking
the changes over the time. It is also been used for comparing values of various items within a
group at a particular point of time.
150 200 250 300 350 400
0
100
200
300
400
500
600
700
352.64
329.38
435.85
356.58
444.59
314.48
455.43
598.04
417.54
332.64
Sum of Wind speed
tabler-icon-diamond-filled.svg

Paraphrase This Document

Need a fresh take? Get an instant paraphrase of this document with our AI Paraphraser
Document Page
3. Computing central tendencies, range and std. Deviation
Serial No. Days
Sum of
Temperature
Sum of Wind
speed
Sum of Wind
direction
1 24 360.46 352.64 2902.14
2 25 338.24 329.38 2957.89
3 26 318.11 435.85 4950.27
4 27 263.38 356.58 5299.64
5 28 274.96 444.59 6458.5
6 29 284.66 314.48 2559.3
7 30 239.9 455.43 4231.89
8 1 215.88 598.04 2843.06
9 2 180.07 417.54 6999.31
10 3 200.93 332.64 3628.75
Total 2676.59 4037.17 42830.75
1 2 3 4 5 6 7 8 9 10
0
100
200
300
400
500
600
700
352.64 329.38
435.85
356.58
444.59
314.48
455.43
598.04
417.54
332.64
Sum of Wind speed
Document Page
Mean 267.659 403.717 4283.075
median 269.17 387.06 3930.32
Mode 0 0 0
Range 180.39 283.56 4440.01
Standard
deviation 59.6991292417 86.0889709093 1589.1248951773
Interpretation- The above evaluation depicts that the three variables reflecting a different
mean value as the 267.659 for temperature, 403.7 as an average value for wind speed and 4283.0
for wind direction. The median value resulted as 269.17, 387.06 & 3930.32 for all the three
variables that are temperature, wind speed and wind direction (Conoyer, Foegen and Lembke,
2016). This median value shows the centre value of the dataset which provides an idea of
distribution of the specific dataset. Moreover, the value of mode of the three variables evaluated
as nil because there is no any repetition of value in weather conditions in the 10 days. It tells
about the value that appears most often in the dataset which in turn means the value that is most
likely for being sampled. The value of range attained as 180.39 for the temperature and 283.56
for wind speed. The range for the third variable resulted as 4440.01 as subtracting the lowest or
minimum value from the largest or maximum value (Logan and Lowrie, 2017). The standards
deviation for the three variables evaluated as 59.69, 86.08 and 1589.12 for the temperature, wind
speed and the wind direction. It reflects the dispersion from the mean value and depicts the
presence of deviation among the variables.
4. Using the linear forecasting model, evaluating the value of m and c.
Date Number of
days (X) Total wind speed (Y) XY X^2
22/09/19 1 15.55 15.55 1
23/09/19 2 20.72 41.44 4
24/09/19 3 19.51 58.53 9
Document Page
25/09/19 4 15.5 62 16
26/09/19 5 25.74 128.7 25
27/09/19 6 20.33 121.98 36
28/09/19 7 19.67 137.69 49
29/09/19 8 17.71 141.68 64
30/09/19 9 22.42 201.78 81
particulars Formula Y = mX + c
m NΣxy – Σx Σy / NΣ x^2 – (Σx)^2
M = 10 (1142.05) - (55 * 200.42) /
(10 * 385) – (55)^2
m = (11420.5 –Jimenez, B. A. and
Staples, K., 2015 11023.1) / (3850 –
3025)
m = 397.4 / 825
m = 0.48169697
c Σy - mΣx / N
c = 200.42 (0.48169697 * 55) / 10
c = ( 200.42 26.49333335) / 10
c = 173.92666665 / 10
c =17.392666665
tabler-icon-diamond-filled.svg

Paraphrase This Document

Need a fresh take? Get an instant paraphrase of this document with our AI Paraphraser
Document Page
Forecasting
wind speed
for 14 days
Y = mX + c Here x = 14 days
Y = 0.48169697 (14) + 17.392666665
Y = 6.74375758 + 17.392666665
Y = 24.136424245
Forecasting
wind speed
for 21 days
Y = mX + c
Here x = 21 days
Y = 0.48169697 (21) + 17.392666665
Y = 10.11563637 + 17.392666665
Y = 27.508303035
CONCLUSION
The above report concludes that the weather conditions of Edinburgh showing the
increasing or decreasing trend with the passage of time.
Document Page
REFERENCES
Books and journals
Conoyer, S. J., Foegen, A. and Lembke, E. S., 2016. Early Numeracy Indicators: Examining
Predictive Utility Across Years and States. Remedial and Special Education. 37(3). pp.159-
171.
Jimenez, B. A. and Staples, K., 2015. Access to the common core state standards in mathematics
through early numeracy skill building for students with significant intellectual disability.
Education and Training in Autism and Developmental Disabilities. pp.17-30.
Logan, T. and Lowrie, T., 2017. Gender perspectives on spatial tasks in a national assessment: A
secondary data analysis. Research in Mathematics Education. 19(2). pp.199-216.
chevron_up_icon
1 out of 9
circle_padding
hide_on_mobile
zoom_out_icon
[object Object]