Economics and Quantitative Analysis: Education and Wage Report
VerifiedAdded on 2020/05/16
|10
|1710
|183
Report
AI Summary
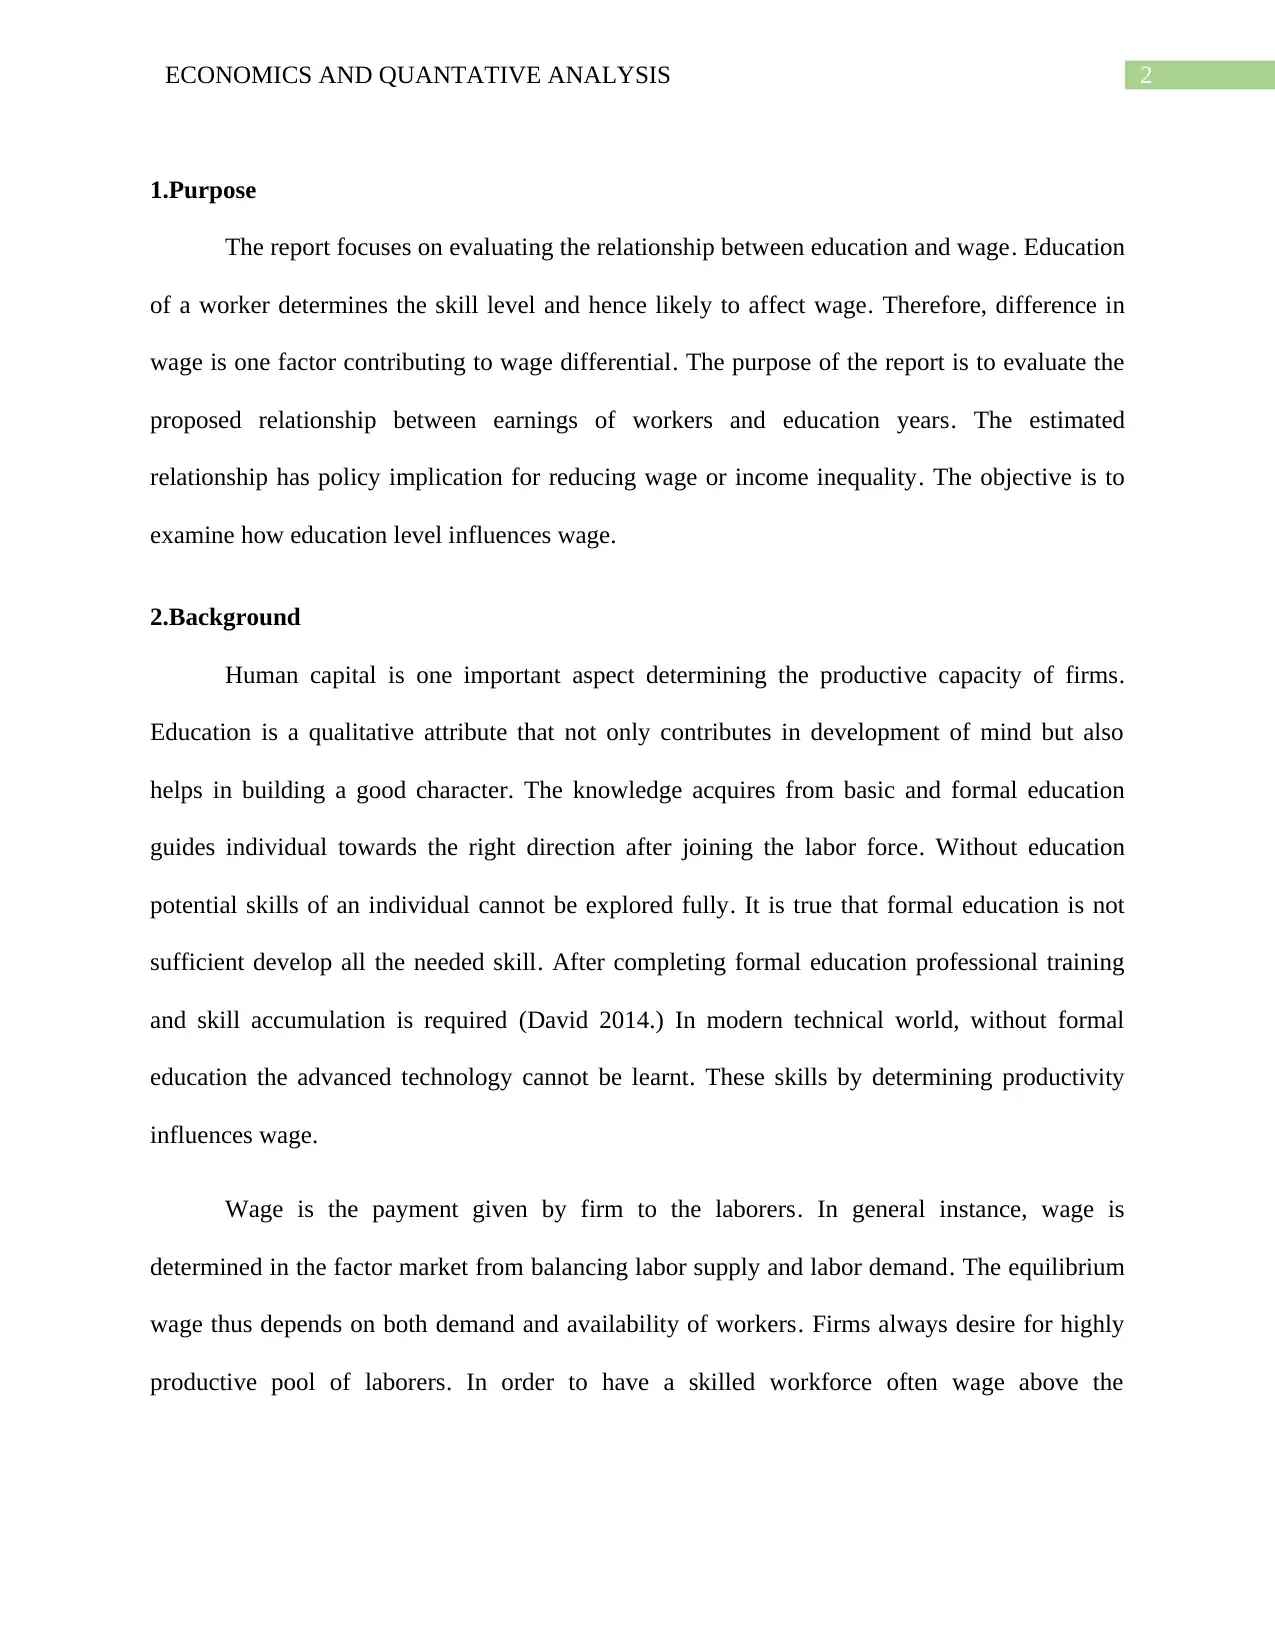
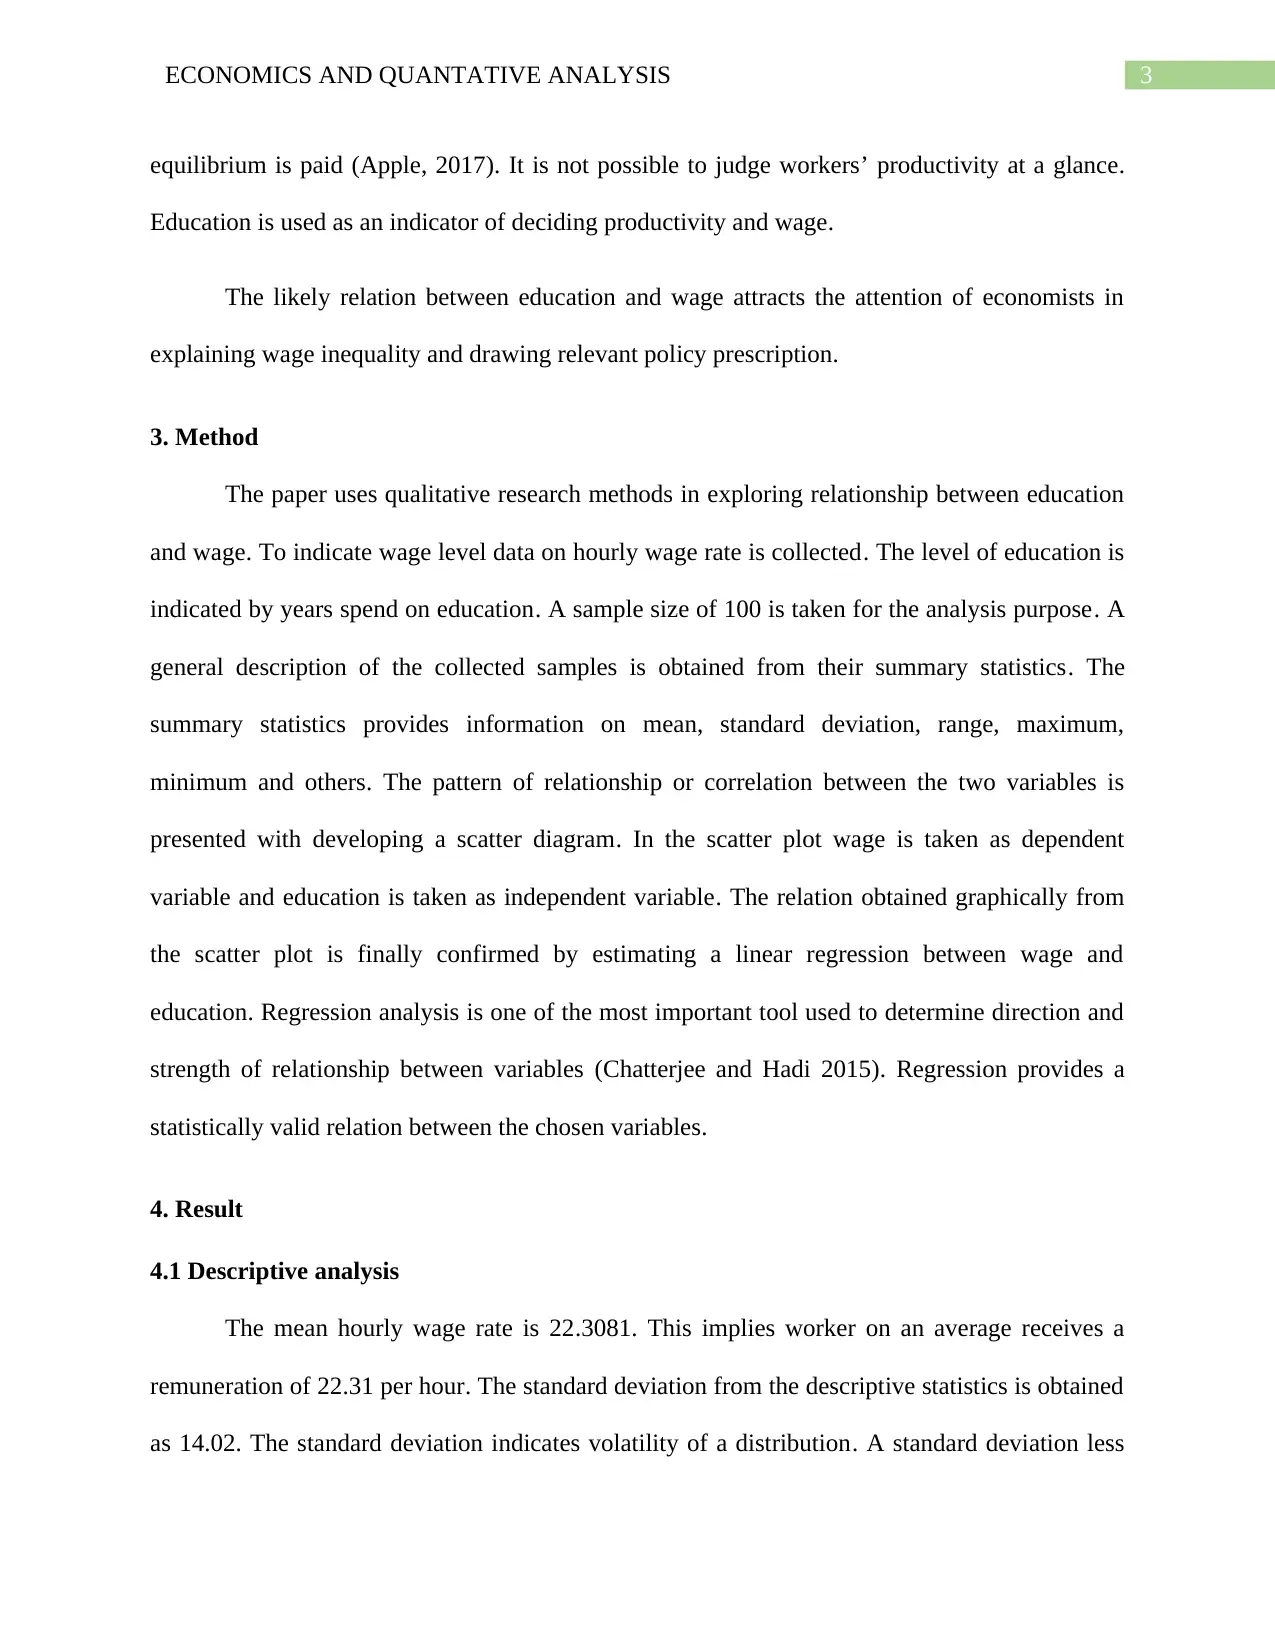
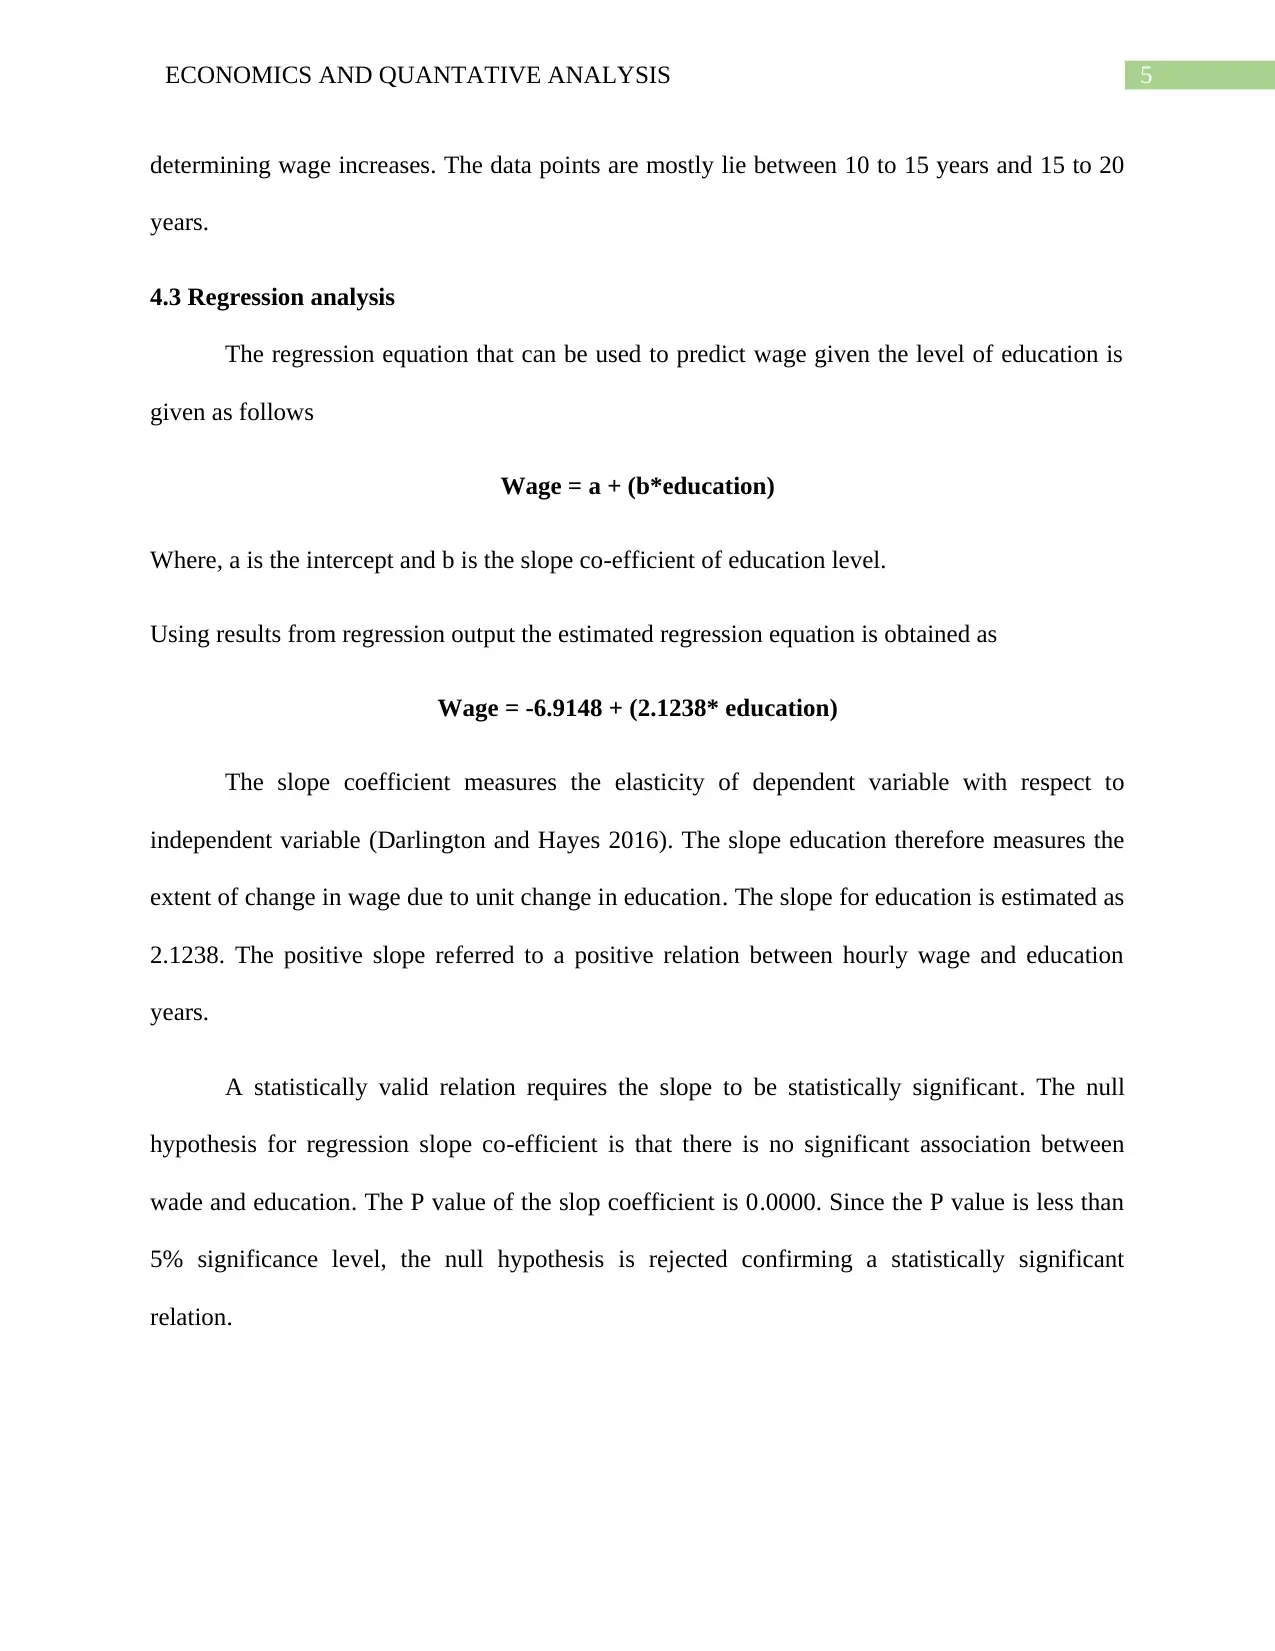
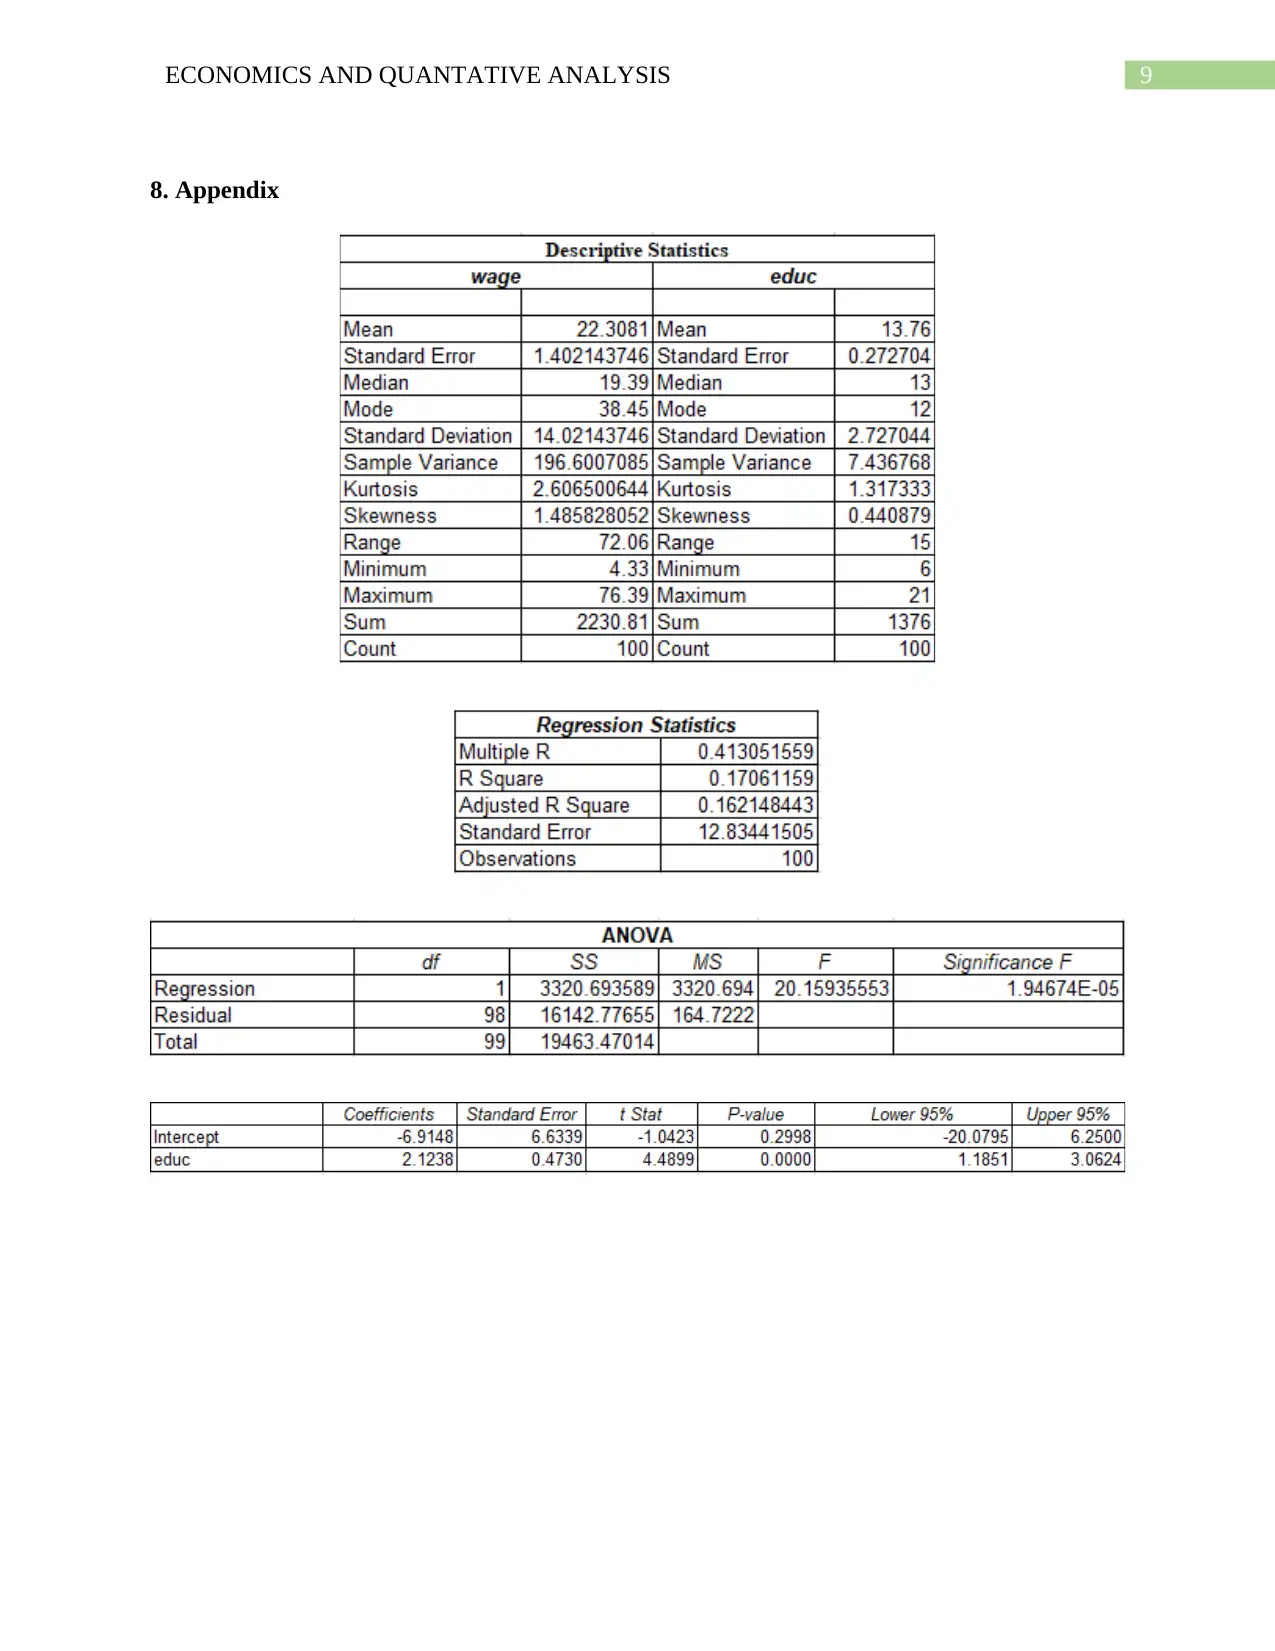
This report investigates the relationship between education and wage, aiming to evaluate how years of education influence a worker's earnings. It begins by outlining the purpose and background, emphasizing the importance of human capital and education in determining productivity and wage levels. The methodology section describes the use of quantitative research methods, including descriptive statistics, scatter diagrams, and regression analysis, to analyze a sample of 100 data points. The results section presents the descriptive analysis of wage and education data, the scatter diagram illustrating the positive correlation between education and wage, and the regression analysis results, including the regression equation, slope coefficient, goodness of fit (R-squared), and predicted wage calculations. The discussion section interprets the findings, highlighting the statistically significant positive relationship between education and wage, but also the model's limited explanatory power. Finally, the report recommends government promotion of education to address wage inequality and improve the wages of low-skilled workers.

Running Head: ECONOMICS AND QUANTATIVE ANALYSIS
Economics and Quantative Analysis
Name of the Student
Name of the University
Author note
Economics and Quantative Analysis
Name of the Student
Name of the University
Author note
Secure Best Marks with AI Grader
Need help grading? Try our AI Grader for instant feedback on your assignments.

1ECONOMICS AND QUANTATIVE ANALYSIS
Table of Contents
1.Purpose.........................................................................................................................................2
2.Background...................................................................................................................................2
3. Method.........................................................................................................................................3
4. Result...........................................................................................................................................3
4.1 Descriptive analysis...............................................................................................................3
4.2 Scatter diagram......................................................................................................................4
4.3 Regression analysis................................................................................................................5
4.4 Goodness of fit.......................................................................................................................5
4.5 Predicted Wage......................................................................................................................6
5. Discussion....................................................................................................................................7
6. Recommendation.........................................................................................................................7
7. References....................................................................................................................................8
8. Appendix......................................................................................................................................9

2ECONOMICS AND QUANTATIVE ANALYSIS
1.Purpose
The report focuses on evaluating the relationship between education and wage. Education
of a worker determines the skill level and hence likely to affect wage. Therefore, difference in
wage is one factor contributing to wage differential. The purpose of the report is to evaluate the
proposed relationship between earnings of workers and education years. The estimated
relationship has policy implication for reducing wage or income inequality. The objective is to
examine how education level influences wage.
2.Background
Human capital is one important aspect determining the productive capacity of firms.
Education is a qualitative attribute that not only contributes in development of mind but also
helps in building a good character. The knowledge acquires from basic and formal education
guides individual towards the right direction after joining the labor force. Without education
potential skills of an individual cannot be explored fully. It is true that formal education is not
sufficient develop all the needed skill. After completing formal education professional training
and skill accumulation is required (David 2014.) In modern technical world, without formal
education the advanced technology cannot be learnt. These skills by determining productivity
influences wage.
Wage is the payment given by firm to the laborers. In general instance, wage is
determined in the factor market from balancing labor supply and labor demand. The equilibrium
wage thus depends on both demand and availability of workers. Firms always desire for highly
productive pool of laborers. In order to have a skilled workforce often wage above the

3ECONOMICS AND QUANTATIVE ANALYSIS
equilibrium is paid (Apple, 2017). It is not possible to judge workers’ productivity at a glance.
Education is used as an indicator of deciding productivity and wage.
The likely relation between education and wage attracts the attention of economists in
explaining wage inequality and drawing relevant policy prescription.
3. Method
The paper uses qualitative research methods in exploring relationship between education
and wage. To indicate wage level data on hourly wage rate is collected. The level of education is
indicated by years spend on education. A sample size of 100 is taken for the analysis purpose. A
general description of the collected samples is obtained from their summary statistics. The
summary statistics provides information on mean, standard deviation, range, maximum,
minimum and others. The pattern of relationship or correlation between the two variables is
presented with developing a scatter diagram. In the scatter plot wage is taken as dependent
variable and education is taken as independent variable. The relation obtained graphically from
the scatter plot is finally confirmed by estimating a linear regression between wage and
education. Regression analysis is one of the most important tool used to determine direction and
strength of relationship between variables (Chatterjee and Hadi 2015). Regression provides a
statistically valid relation between the chosen variables.
4. Result
4.1 Descriptive analysis
The mean hourly wage rate is 22.3081. This implies worker on an average receives a
remuneration of 22.31 per hour. The standard deviation from the descriptive statistics is obtained
as 14.02. The standard deviation indicates volatility of a distribution. A standard deviation less
Secure Best Marks with AI Grader
Need help grading? Try our AI Grader for instant feedback on your assignments.

4ECONOMICS AND QUANTATIVE ANALYSIS
than average implies a less volatile distribution. Here average wage is greater than standard
deviation of the wage. Hence, wage distribution is not much volatile. The maximum and
minimum wage is 73.39 and 4.33 respectively.
The average of education year is obtained as 13.76 that is approximately 14 years. The
average shows workers on an average have 14 years of education. The maximum education year
is 21 while the minimum education year is 6. The standard deviation for education years is 2.72.
Here again the standard deviation is far less than mean education years implying a small
variation of the distribution.
4.2 Scatter diagram
The fitted trend line in the scatter diagram shows a positive association between hourly
wage and education years. As the education level increases, there is an increase in the wage rate.
For the education years between 5 and 10 there are only a few observations. Therefore, 5-10
years of education is not so much important. As the education years increases its importance in

5ECONOMICS AND QUANTATIVE ANALYSIS
determining wage increases. The data points are mostly lie between 10 to 15 years and 15 to 20
years.
4.3 Regression analysis
The regression equation that can be used to predict wage given the level of education is
given as follows
Wage = a + (b*education)
Where, a is the intercept and b is the slope co-efficient of education level.
Using results from regression output the estimated regression equation is obtained as
Wage = -6.9148 + (2.1238* education)
The slope coefficient measures the elasticity of dependent variable with respect to
independent variable (Darlington and Hayes 2016). The slope education therefore measures the
extent of change in wage due to unit change in education. The slope for education is estimated as
2.1238. The positive slope referred to a positive relation between hourly wage and education
years.
A statistically valid relation requires the slope to be statistically significant. The null
hypothesis for regression slope co-efficient is that there is no significant association between
wade and education. The P value of the slop coefficient is 0.0000. Since the P value is less than
5% significance level, the null hypothesis is rejected confirming a statistically significant
relation.

6ECONOMICS AND QUANTATIVE ANALYSIS
4.4 Goodness of fit
A model is said to be a good fit when most of the variation in the dependent variable is
explained by the independent variable. This is obtained from the measures of correlation co-
efficient or R square (Rumelhart 2017). The R square value for the model is 0.1706. This implies
in the wage model where education is used as the independent variable, most of the variation in
wage remained unexplained as only 17% variation is explained by education. Therefore, wage
model is not fitted good.
4.5 Predicted Wage
Wage = -6.9148 + (2.1238* education)
Using this equation wage can be predicted for any given level of education.
At education years of 12, predicted wage is
Wage = -6.9148 + (2.1238* education)
= -6.9148 + (2.1238*12)
= -6.9148 +25.4856
=18.5708
At education years of 14, predicted wage is
Wage = -6.9148 + (2.1238* education)
= -6.9148 + (2.1238*14)
= -6.9148 +29.7332
= 22.8184
Paraphrase This Document
Need a fresh take? Get an instant paraphrase of this document with our AI Paraphraser

7ECONOMICS AND QUANTATIVE ANALYSIS
Difference in hourly wage
22.8184 – 18.5708
= 4.2476
5. Discussion
From the regression result, a positive relation is found between education and wage. The
positive significant relation implies with increase in education years, wage level increases. The
mean hourly wage is 22.61 and that of mean education year is 14. The model though gives a
statistically significant result but is not fitted goods having a very small R square.
The quantitative analysis used in the research paper has several advantages. A definite
outcome is obtained and the result based on selected samples can be approximate for population.
However, the result satisfies the expected positive relationship between education and wage and
provides statistically significant result. A relatively small sample size is both the strength and
weakness of the study. A very small R square value is obtained making the model a bad fit.
The result of present research is consistent with many other research papers developed in
this field. These papers establish education as one of the significant factors causing wage
differential (Bárány 2016). Based on the significant association between hourly wage and
education policy can be undertaken to improve wage level.
6. Recommendation
Wage inequality is a problem in most of the developing nation. Government in these
nation should promote education as a tool to raise wages to low paid unskilled workers.

8ECONOMICS AND QUANTATIVE ANALYSIS
In addition to basic education, government should ensure that education is continued for
sufficient years. As suggested from the paper, worker should have 10 to 20 years of education.
Educating workers is a better tool to improve wage level than using minimum wage
legislation. The policy of minimum wage ends up with unemployment. However, education
raises skills and workers’ productivity benefitting both the employer and worker.
7. References
Apple, M.W. ed., 2017. Cultural and economic reproduction in education: Essays on class,
ideology and the state (Vol. 53). Routledge.
Bárány, Z.L., 2016. The minimum wage and inequality: The effects of education and
technology. Journal of Labor Economics, 34(1), pp.237-274.
Chatterjee, S. and Hadi, A.S., 2015. Regression analysis by example. John Wiley & Sons.
Darlington, R.B. and Hayes, A.F., 2016. Regression analysis and linear models: Concepts,
applications, and implementation. Guilford Publications.
David, H., 2014. Skills, education, and the rise of earnings inequality among the" other 99
percent".
Rumelhart, D.E., 2017. Schemata: The building blocks. Theoretical issues in reading
comprehension: Perspectives from cognitive psychology, linguistics, artificial intelligence and
education, 11, p.33.

9ECONOMICS AND QUANTATIVE ANALYSIS
8. Appendix
8. Appendix
1 out of 10
Related Documents

Your All-in-One AI-Powered Toolkit for Academic Success.
+13062052269
info@desklib.com
Available 24*7 on WhatsApp / Email
Unlock your academic potential
© 2024 | Zucol Services PVT LTD | All rights reserved.