ITECH7406: EEA Greenhouse Gas Emission Control Measures Report
VerifiedAdded on  2022/11/13
|21
|4436
|162
Report
AI Summary
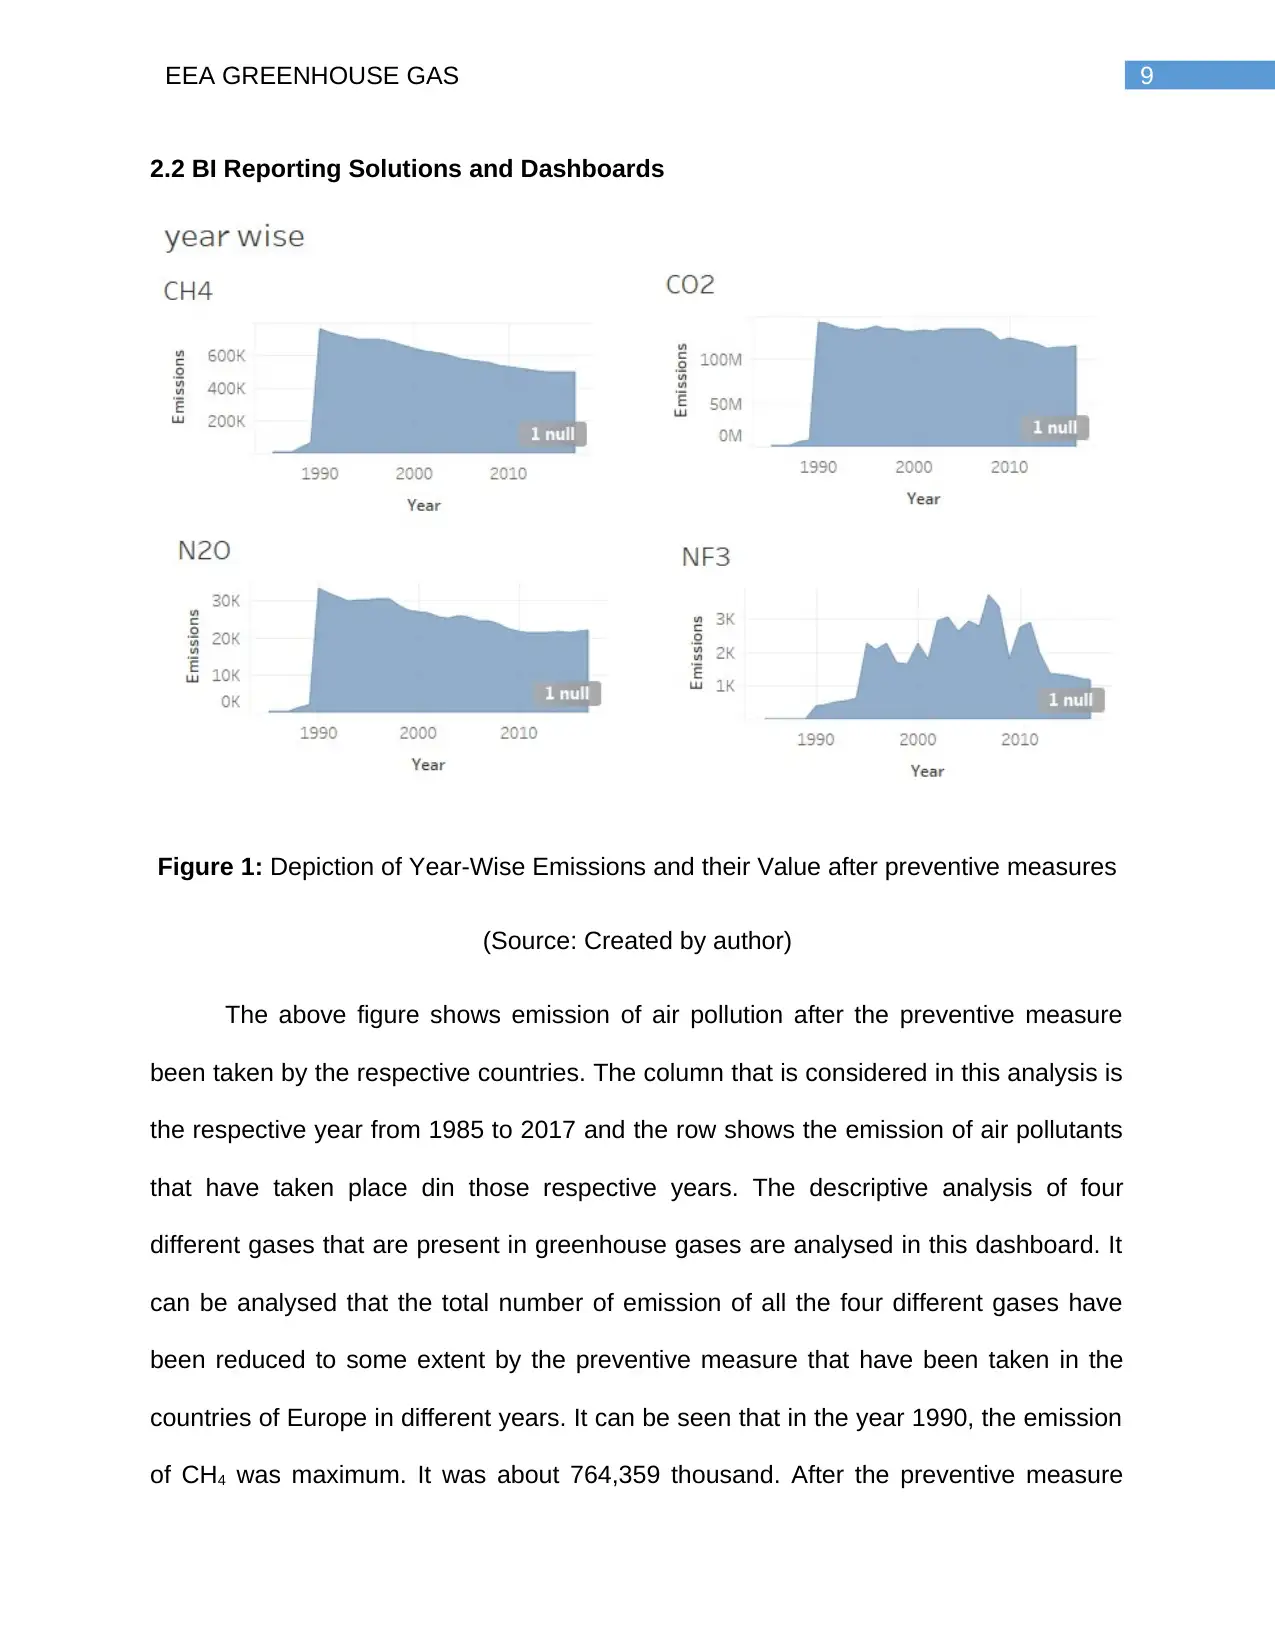
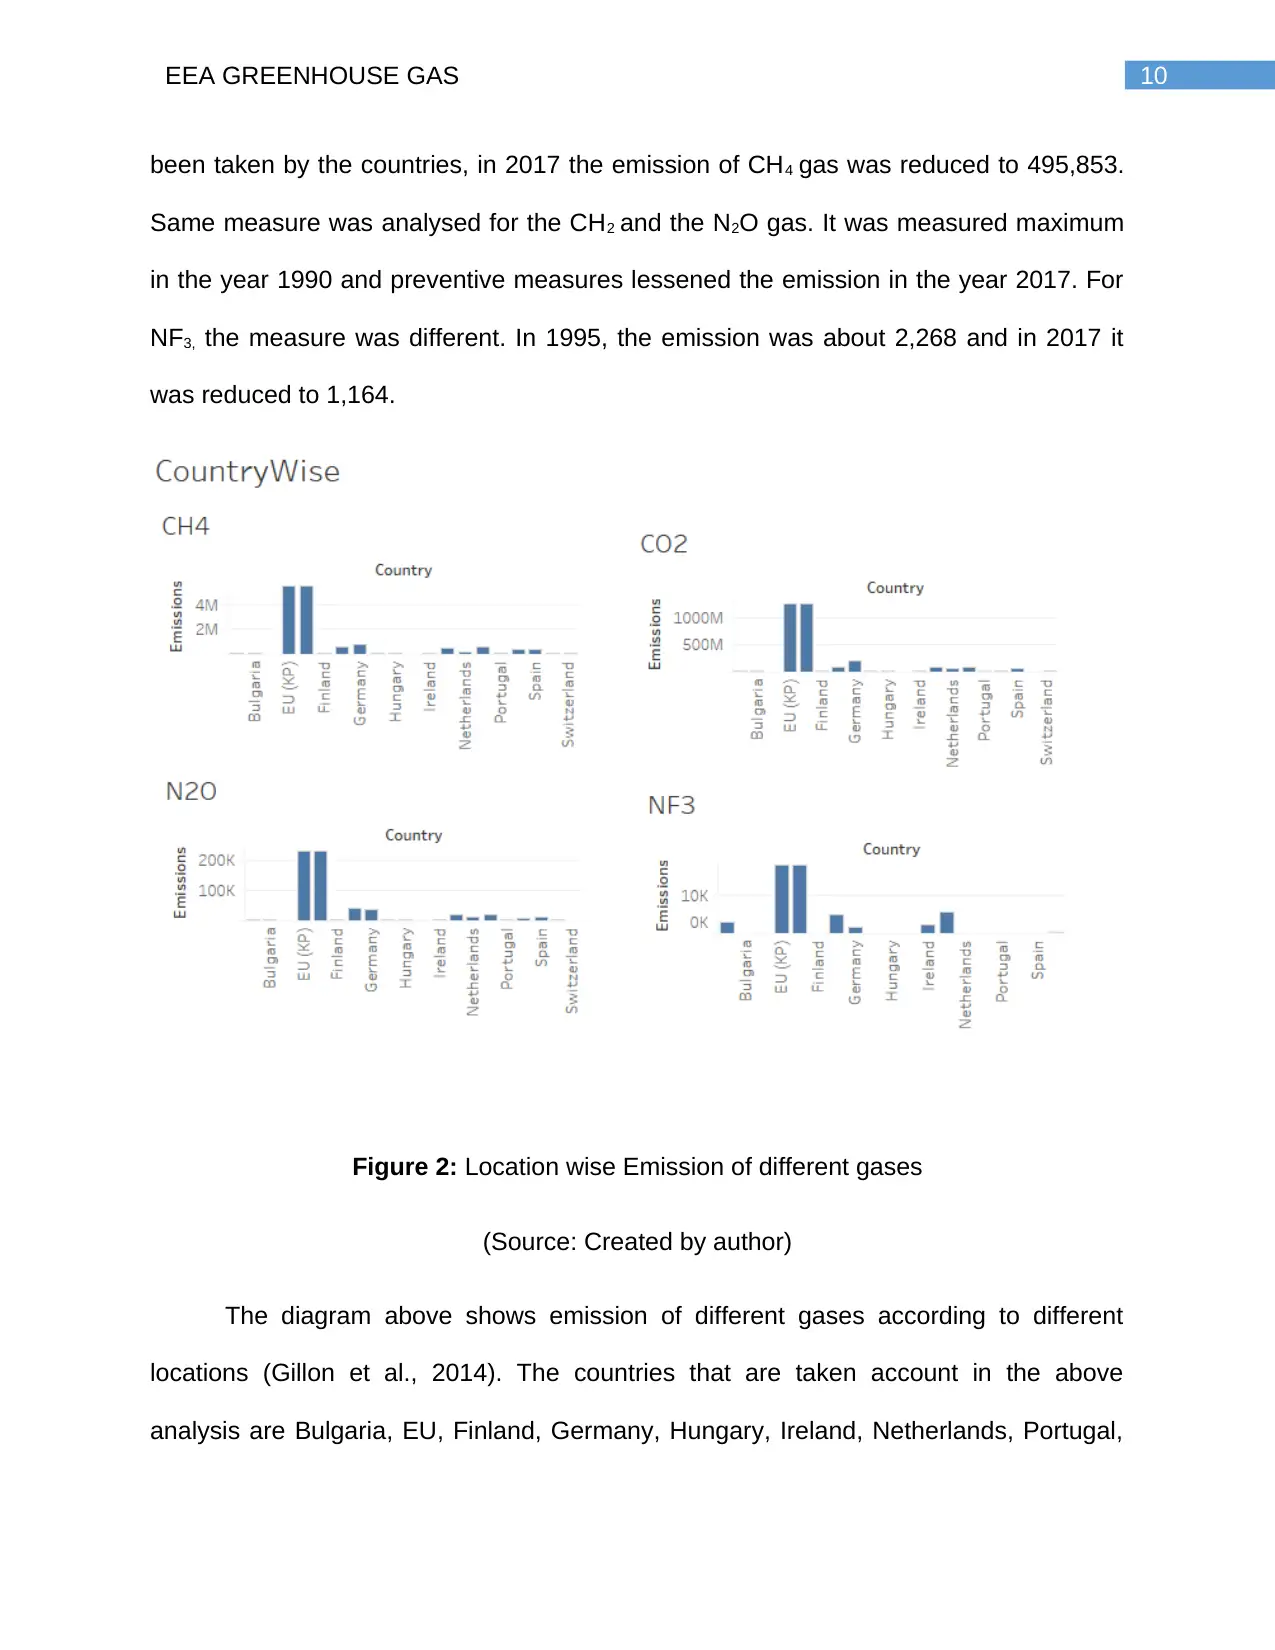
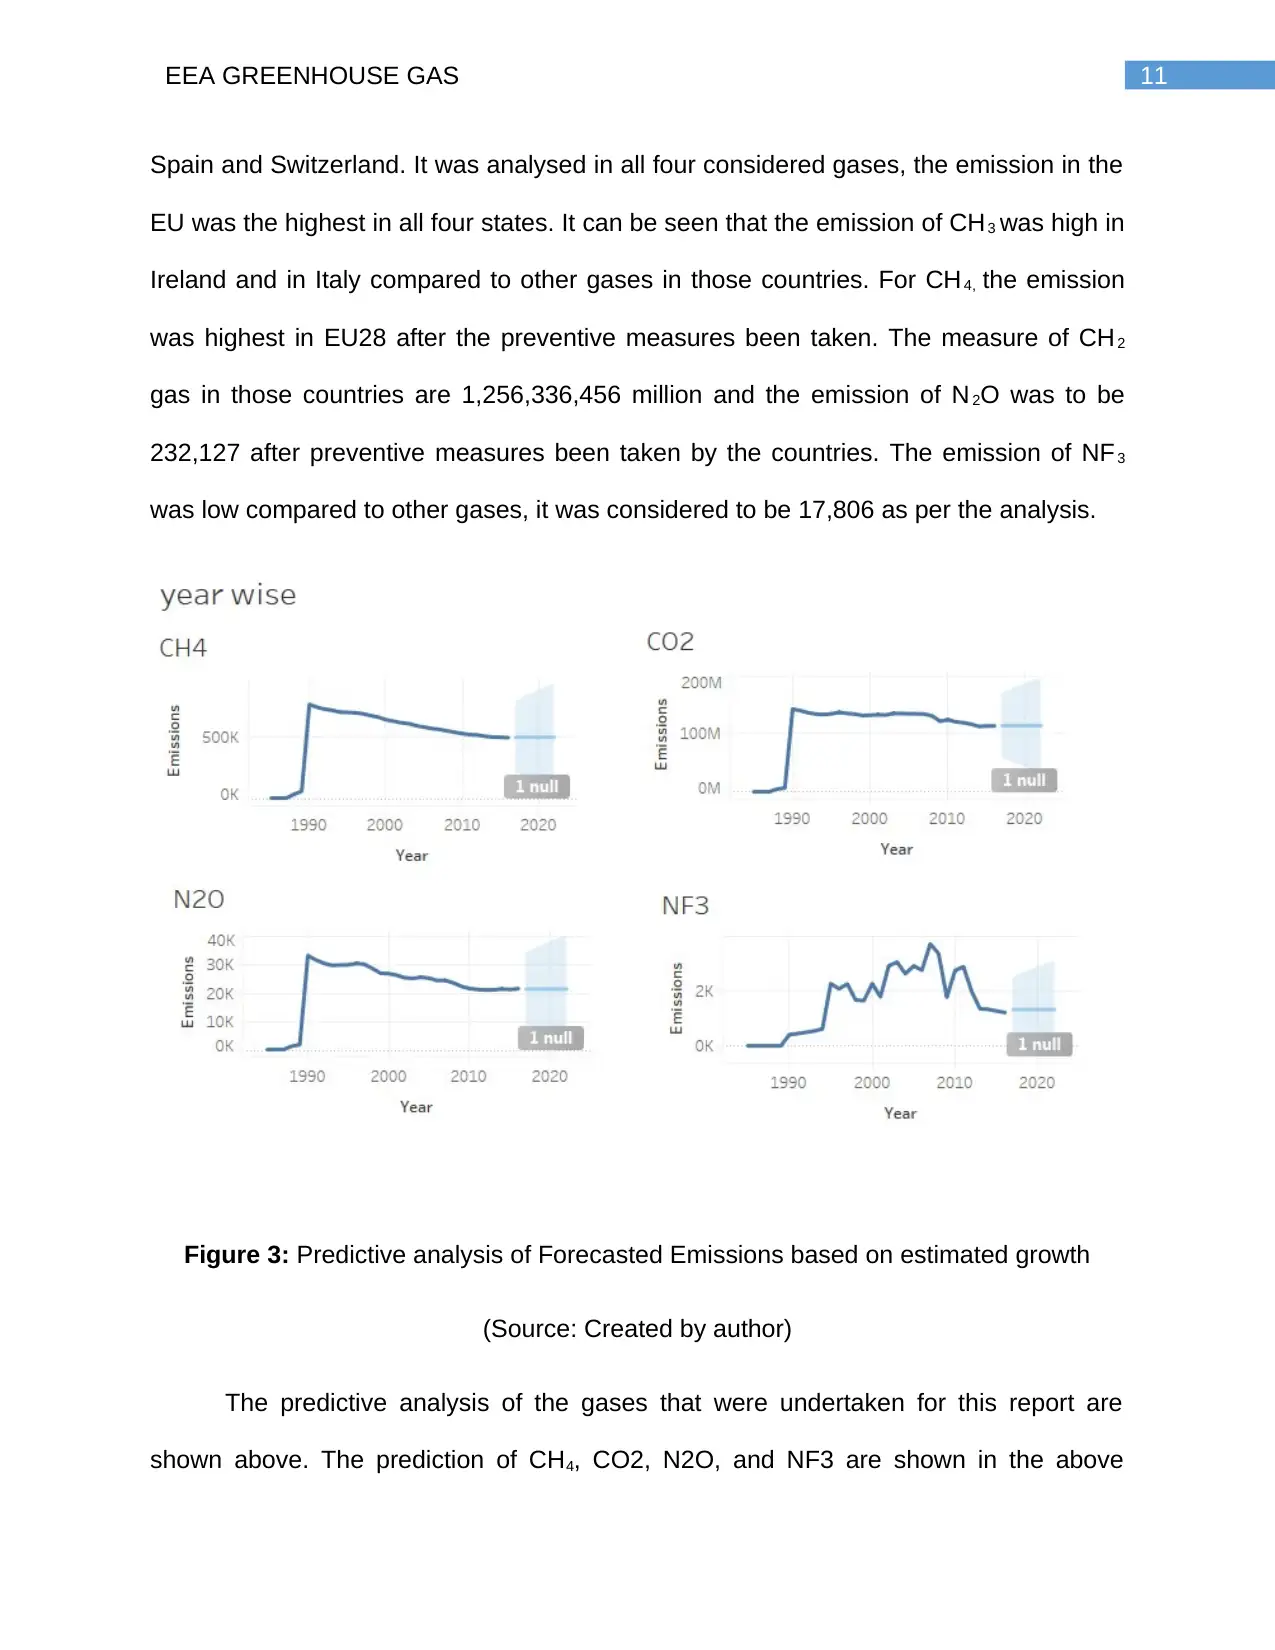
This report provides a comprehensive analysis of greenhouse gas emissions in Europe, focusing on data reported by the EEA and submitted to the UNFCCC. It examines the impact of various control measures implemented across different European countries to reduce emissions. The report utilizes business intelligence tools and techniques, including descriptive and predictive analysis, to evaluate trends in CO2, CH4, N2O, and NF3 emissions. Data visualizations, such as dashboards, are used to present year-wise emissions, location-based emission comparisons, and predictive models forecasting future emission trends. The analysis incorporates datasets from the UNFCCC and the EU Greenhouse Gas Monitoring Mechanism, aiming to assess the effectiveness of emission reduction strategies and their impact on climate change and air pollution. The report highlights the European Union's goals to reduce greenhouse gas emissions and promote energy efficiency, aligning with broader objectives to combat climate change. The report concludes by summarizing the findings and the effectiveness of the measures taken.

Running head: EEA GREENHOUSE GAS
EEA Greenhouse gas
Name of the Student
Name of the University
Author note
EEA Greenhouse gas
Name of the Student
Name of the University
Author note
Paraphrase This Document
Need a fresh take? Get an instant paraphrase of this document with our AI Paraphraser

1EEA GREENHOUSE GAS
Executive Summary
This report mainly focuses on the impact of measures that has been taken by different
industries of Europe as per the policies and standards made by EEA to reduce the
greenhouse gases. There is a huge rise in the harmful greenhouse gases and all the
rise in greenhouse gases have high impact on the environment. The emission of
greenhouse gases have resulted in the change of climate and have affected the farming
sector the most. This has also resulted in global warming. The air pollution in Europe
has been increasing eventually and the first initiative that has been undertaken is
controlling the air pollution in and around school environment.

2EEA GREENHOUSE GAS
Table of Contents
1. Introduction....................................................................................................................3
2. Discussion......................................................................................................................5
2.1 Discussion on Business Analytics...........................................................................5
2.2 BI Reporting Solutions and Dashboards..................................................................8
3. Conclusion...................................................................................................................12
4. Cover Letter.................................................................................................................14
Bibliography.....................................................................................................................16
⊘ This is a preview!⊘
Do you want full access?
Subscribe today to unlock all pages.

Trusted by 1+ million students worldwide

3EEA GREENHOUSE GAS
1. Introduction
This report deals with the study with the data of different greenhouse gases in
different countries as reported by EEA. The countries in the recent times emits large
amount of greenhouse gases that are very harmful for the people on the planet. The
greenhouse gas comprises mainly of seven different gases which directly effects the
climate change on the planet (Sun, Strang & Firmin, 2017). The gases that are known
as greenhouse gases are carbon di oxide, methane, chlorofluorocarbons, nitrous oxide,
perfluorocarbons, sulphur hexafluoride and nitrogen trifluoride. This report explains the
greenhouse gas control measures that are taken in Europe to lower the emission of
gases in the environment. The data that is taken in this report is reported to the
UNFCCC and to the Greenhouse Gas Monitoring Mechanism. All the countries have
submitted their air controls and harmful gas removal data to environment climate control
of United Nations. The data set has the latest update data of 2018. The increase in
greenhouse gases in the European countries are result of human activities. Thus
measure are to be taken to control the emission of greenhouse gases to save the
planet.
The emission of greenhouse gases have resulted in the change of climate and
have affected the farming sector the most. This has also resulted in global warming.
The air pollution in Europe has been increasing eventually and the first initiative that has
been undertaken is controlling the air pollution in and around school environment
(Tessum, Hill & Marshall, 2014). As a control measure the car manufacturers were told
to meet their CO2 control emission and according to the data, almost all of them have
met their target on the new sales. This report will mainly discuss the analysis of data
Paraphrase This Document
Need a fresh take? Get an instant paraphrase of this document with our AI Paraphraser

4EEA GREENHOUSE GAS
regarding control measures of greenhouse gases in Europe. This data analysis will be
carried out using tools of business intelligence to depict the control of air control
emission in Europe.
regarding control measures of greenhouse gases in Europe. This data analysis will be
carried out using tools of business intelligence to depict the control of air control
emission in Europe.

5EEA GREENHOUSE GAS
2. Discussion
2.1 Discussion on Business Analytics
There are many different platforms as well as analytical tool that can be used
together with proper succession form so that the companies and organizations can
analyse them and make use of the data. The technologies have changed rapidly and
there has been growth in the technologies. The business analytical tools has been used
by businesses all over the world to get a detailed business analysis with the available
statistical data (Schniederjans & Starkey, 2014). There are different types of analytical
tool that have been used by the businesses helping the organization to get the
performance of the business or the organization with different operations such as
integration of data, collaboration with various analytical forms and manage the data in
proper way. The concept of business analytics are used in most of the business sectors.
The process of business analytics is defined as studying of different types of data
for the purpose of performing different operations as well as analysis of statistical data.
The business analytics tool is also used for forming different models that applies
techniques based on different data optimization. Using the concept of business
analytics, predictive models can be formed by the process of data optimization. This
analytics can also help one business to establish partnership with another business in
the market and form partnership with different business executives who are responsible
to make different decisions that are based on the market conditions (Nisbet,
Dlugokencky & Bousquet, 2014). The business analytics process mainly requires
developing many quantitative methods as well as performing the analysis that include
data having evidence. The big data is a concept that generally includes large data
⊘ This is a preview!⊘
Do you want full access?
Subscribe today to unlock all pages.

Trusted by 1+ million students worldwide

6EEA GREENHOUSE GAS
volume that are gathered from wide sources. The data that comprises of big data
consists of both unstructured as well as structured data form. The big data mainly have
updates on daily business process. When the big data are used by the companies, the
companies use them by using the business analytics that helps to derive all insights.
This would help the business to make better use of the big data and take better
decisions for the business. With the help of business analytics, the business and the
organizations can make strategic decisions and make strategic moves that are best for
business perspectives.
This report consists of different types of data characteristics as well as trends
that helps to evaluate the control of different greenhouse gases in Europe (Laursen &
Thorlund, 2016). Different organization have taken different measures to control the
emission of greenhouse gases in Europe. All those data related to control measures
that have been taken to lessen the air pollution in Europe have been analysed in this
report. The data that have been analysed in this report was collected from UNFCC and
to the Greenhouse Gas Monitoring Mechanism. The data shows the inventory data of
greenhouse gases that were reported to United Nations Framework Convention for
Climate Change (UNFCC). The data submitted by the state member of EU were also
used in this analytics that were submitted EU Greenhouse Gas Monitoring Mechanism.
The main aim of the UNFCC is to prevent the dangerous human interface along with
climate system. This organization first recognizes the problem, set specific goals, puts
different countries in to work to cut down the emission of greenhouse gases and
provides funds to execute the measures to reduce air pollution in different developing
countries (Kanemoto et al., 2014). The measures that have been taken to control the air
Paraphrase This Document
Need a fresh take? Get an instant paraphrase of this document with our AI Paraphraser

7EEA GREENHOUSE GAS
pollution have impact over the environment change with the help of UNFCC. The
datasets that have been taken to analyse the measures of air control will help in
changing the trends that would determine the manmade emissions of air pollutants from
different sources. The main motive of European government is to prevent the affected
climate and to improve the condition of the climate. This is the prime objective of the
European government. The government of Europe needs to cut the emission of
greenhouse gas that would encourage other nations smoothly. The main target of the
European gases is to cut down the emission of greenhouse gases by 20% compared to
that of in the year 1990, use renewable energy is to be used for energy consumption in
the system. The energy efficiency is to be increased by 20% in the European nations.
The EU also has long term goals to cut the emission of greenhouse gases by
80% to 95% as compared to 1990. The long term goal of Europe is to turn Europe to an
energy efficient as well as economy that include low carbon. This will include create
jobs as well as strengthen the competitiveness in Europe. According to the budget of
EU, 20% of the budget comprising of about 180 billion euro is to be spent for protecting
the global climate. The finance of EU includes low energy carbon demonstration
projects from emission certificates sale. This might include technology that traps the
CO2 gas from all power stations and in the industrial installations as well as storing CO 2
in the ground.
The dataset that have been analysed in this report consists of 625790 data which
are classified according to different parameters. There are different parameters that
have been analysed to find out the pollution emission after the preventive measures that
have been taken by different countries in Europe (Huo et al., 2015). The parameters

8EEA GREENHOUSE GAS
that have been considered for analysing the air pollution control in different countries,
the pollutant names, the year wise air control measure emissions, and the emission that
took place in the respective country and respective year. The first column that have be
taken in to consideration is the country wise air control emission and the year wise year
control emission that have been taken place in the European countries. The
greenhouse gases that are analysed in this business analytics are CO2, CH4, N2O, and
NF3. The measure value of the pollutants are done in million tones and in thousand
tones. All the detailed analysis and the observation are carried out in the following
section of this report. Three dashboards have been presented in the next section that
states two descriptive analysis and one predictive analysis.
⊘ This is a preview!⊘
Do you want full access?
Subscribe today to unlock all pages.

Trusted by 1+ million students worldwide

9EEA GREENHOUSE GAS
2.2 BI Reporting Solutions and Dashboards
Figure 1: Depiction of Year-Wise Emissions and their Value after preventive measures
(Source: Created by author)
The above figure shows emission of air pollution after the preventive measure
been taken by the respective countries. The column that is considered in this analysis is
the respective year from 1985 to 2017 and the row shows the emission of air pollutants
that have taken place din those respective years. The descriptive analysis of four
different gases that are present in greenhouse gases are analysed in this dashboard. It
can be analysed that the total number of emission of all the four different gases have
been reduced to some extent by the preventive measure that have been taken in the
countries of Europe in different years. It can be seen that in the year 1990, the emission
of CH4 was maximum. It was about 764,359 thousand. After the preventive measure
Paraphrase This Document
Need a fresh take? Get an instant paraphrase of this document with our AI Paraphraser

10EEA GREENHOUSE GAS
been taken by the countries, in 2017 the emission of CH4 gas was reduced to 495,853.
Same measure was analysed for the CH2 and the N2O gas. It was measured maximum
in the year 1990 and preventive measures lessened the emission in the year 2017. For
NF3, the measure was different. In 1995, the emission was about 2,268 and in 2017 it
was reduced to 1,164.
Figure 2: Location wise Emission of different gases
(Source: Created by author)
The diagram above shows emission of different gases according to different
locations (Gillon et al., 2014). The countries that are taken account in the above
analysis are Bulgaria, EU, Finland, Germany, Hungary, Ireland, Netherlands, Portugal,

11EEA GREENHOUSE GAS
Spain and Switzerland. It was analysed in all four considered gases, the emission in the
EU was the highest in all four states. It can be seen that the emission of CH3 was high in
Ireland and in Italy compared to other gases in those countries. For CH4, the emission
was highest in EU28 after the preventive measures been taken. The measure of CH2
gas in those countries are 1,256,336,456 million and the emission of N2O was to be
232,127 after preventive measures been taken by the countries. The emission of NF3
was low compared to other gases, it was considered to be 17,806 as per the analysis.
Figure 3: Predictive analysis of Forecasted Emissions based on estimated growth
(Source: Created by author)
The predictive analysis of the gases that were undertaken for this report are
shown above. The prediction of CH4, CO2, N2O, and NF3 are shown in the above
⊘ This is a preview!⊘
Do you want full access?
Subscribe today to unlock all pages.

Trusted by 1+ million students worldwide
1 out of 21
Related Documents

Your All-in-One AI-Powered Toolkit for Academic Success.
 +13062052269
info@desklib.com
Available 24*7 on WhatsApp / Email
Unlock your academic potential
Copyright © 2020–2025 A2Z Services. All Rights Reserved. Developed and managed by ZUCOL.