EFB344 Risk Management & Derivatives: VaR & Hedging Analysis
VerifiedAdded on 2023/06/03
|15
|2387
|260
Report
AI Summary
This report focuses on calculating Value at Risk (VaR) for a portfolio of Qantas and Fairfax Media shares and analyzing hedging strategies using derivatives. It compares VaR estimates using normal distribution with a rolling window, EWMA, and historical simulation, selecting the best model based on Basel traffic lights. The report also details beta calculation, the number of future contracts needed for hedging, and the valuation of put options, including a six-step put option valuation. Finally, it includes a profit diagram illustrating the potential payoff from the investment strategy. Desklib provides access to similar solved assignments and study tools for students.
Running head: RISK MANAGEMENT
Risk Management
Name of the Student
Name of the University
Authors Note
Course ID
Risk Management
Name of the Student
Name of the University
Authors Note
Course ID
Paraphrase This Document
Need a fresh take? Get an instant paraphrase of this document with our AI Paraphraser
1
RISK MANAGEMENT
Table of contents
1. Choosing adequate VAR with a confidence level of 99%:....................................................2
2.1 Calculating VAR with normal distribution based on 252 rolling window:.........................2
2.2 Calculating normal distribution with EWMA:.....................................................................2
2.3 Calculating historical simulation based on 252 days:..........................................................3
3. Selecting the best model for selecting required VAR (10, 99%) for January 3, 2016:..........5
4. Calculating the hedging strategy:...........................................................................................6
4.1 Beta calculation:...................................................................................................................6
4.2 Number of future contract:...................................................................................................6
4.3 VAR of the portfolio:...........................................................................................................8
4.4 Valuation of Put option:.......................................................................................................8
4.5 Valuation of six step put option:..........................................................................................9
4.5 Profit diagram:...................................................................................................................12
Bibliography:............................................................................................................................13
2
RISK MANAGEMENT
1. Choosing adequate VAR with a confidence level of 99%:
The choice of adequate VAR is mainly essential as it mainly helpful in making
sufficient investment decisions by calculating the overall risk from investment. The following
choice needs to be conducted for identifying the adequate VAR (i) normal distribution based
on a 252-day rolling window, (ii) the normal distribution with a variance estimated by the
EWMA, and(iii) historical simulation based on a window of 252 days.
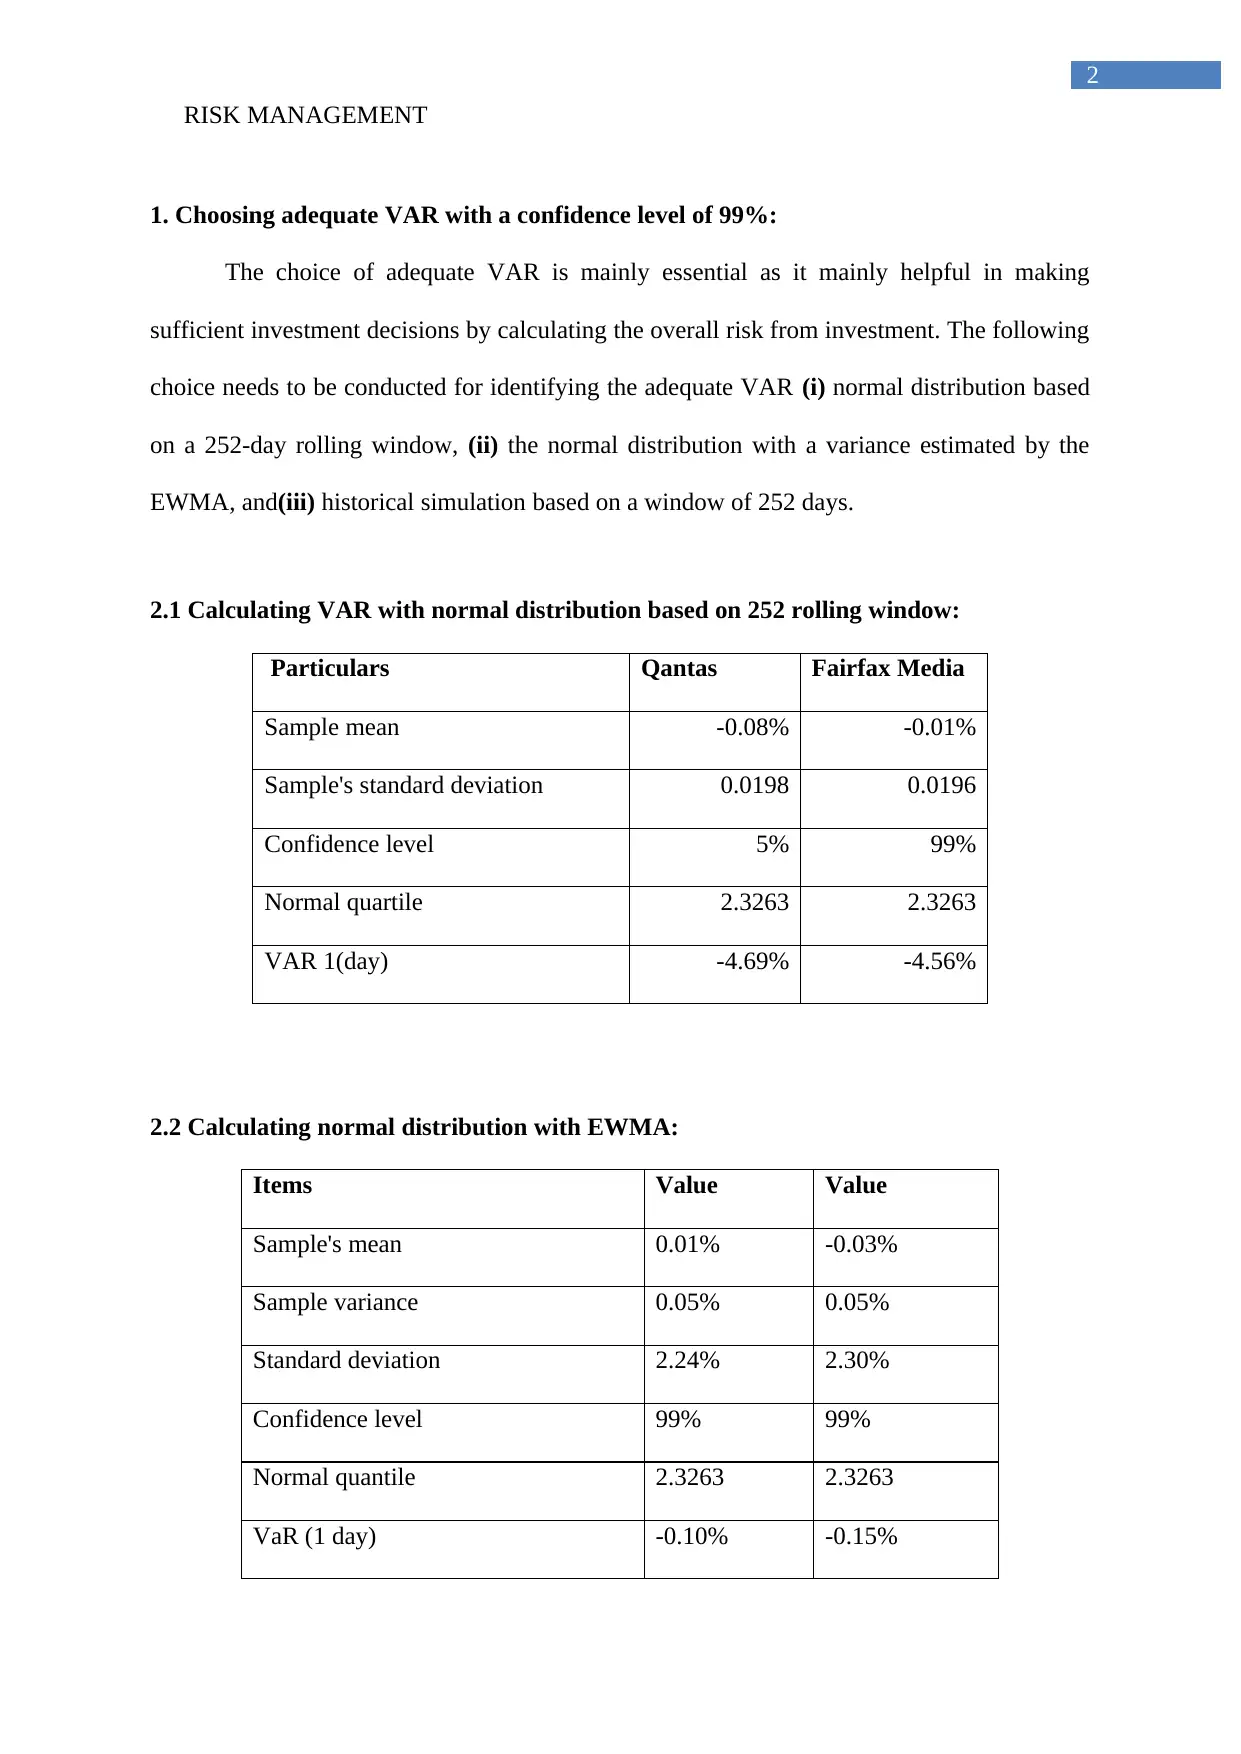
2.1 Calculating VAR with normal distribution based on 252 rolling window:
Particulars Qantas Fairfax Media
Sample mean -0.08% -0.01%
Sample's standard deviation 0.0198 0.0196
Confidence level 5% 99%
Normal quartile 2.3263 2.3263
VAR 1(day) -4.69% -4.56%
2.2 Calculating normal distribution with EWMA:
Items Value Value
Sample's mean 0.01% -0.03%
Sample variance 0.05% 0.05%
Standard deviation 2.24% 2.30%
Confidence level 99% 99%
Normal quantile 2.3263 2.3263
VaR (1 day) -0.10% -0.15%
RISK MANAGEMENT
1. Choosing adequate VAR with a confidence level of 99%:
The choice of adequate VAR is mainly essential as it mainly helpful in making
sufficient investment decisions by calculating the overall risk from investment. The following
choice needs to be conducted for identifying the adequate VAR (i) normal distribution based
on a 252-day rolling window, (ii) the normal distribution with a variance estimated by the
EWMA, and(iii) historical simulation based on a window of 252 days.
2.1 Calculating VAR with normal distribution based on 252 rolling window:
Particulars Qantas Fairfax Media
Sample mean -0.08% -0.01%
Sample's standard deviation 0.0198 0.0196
Confidence level 5% 99%
Normal quartile 2.3263 2.3263
VAR 1(day) -4.69% -4.56%
2.2 Calculating normal distribution with EWMA:
Items Value Value
Sample's mean 0.01% -0.03%
Sample variance 0.05% 0.05%
Standard deviation 2.24% 2.30%
Confidence level 99% 99%
Normal quantile 2.3263 2.3263
VaR (1 day) -0.10% -0.15%
⊘ This is a preview!⊘
Do you want full access?
Subscribe today to unlock all pages.
Trusted by 1+ million students worldwide
3
RISK MANAGEMENT
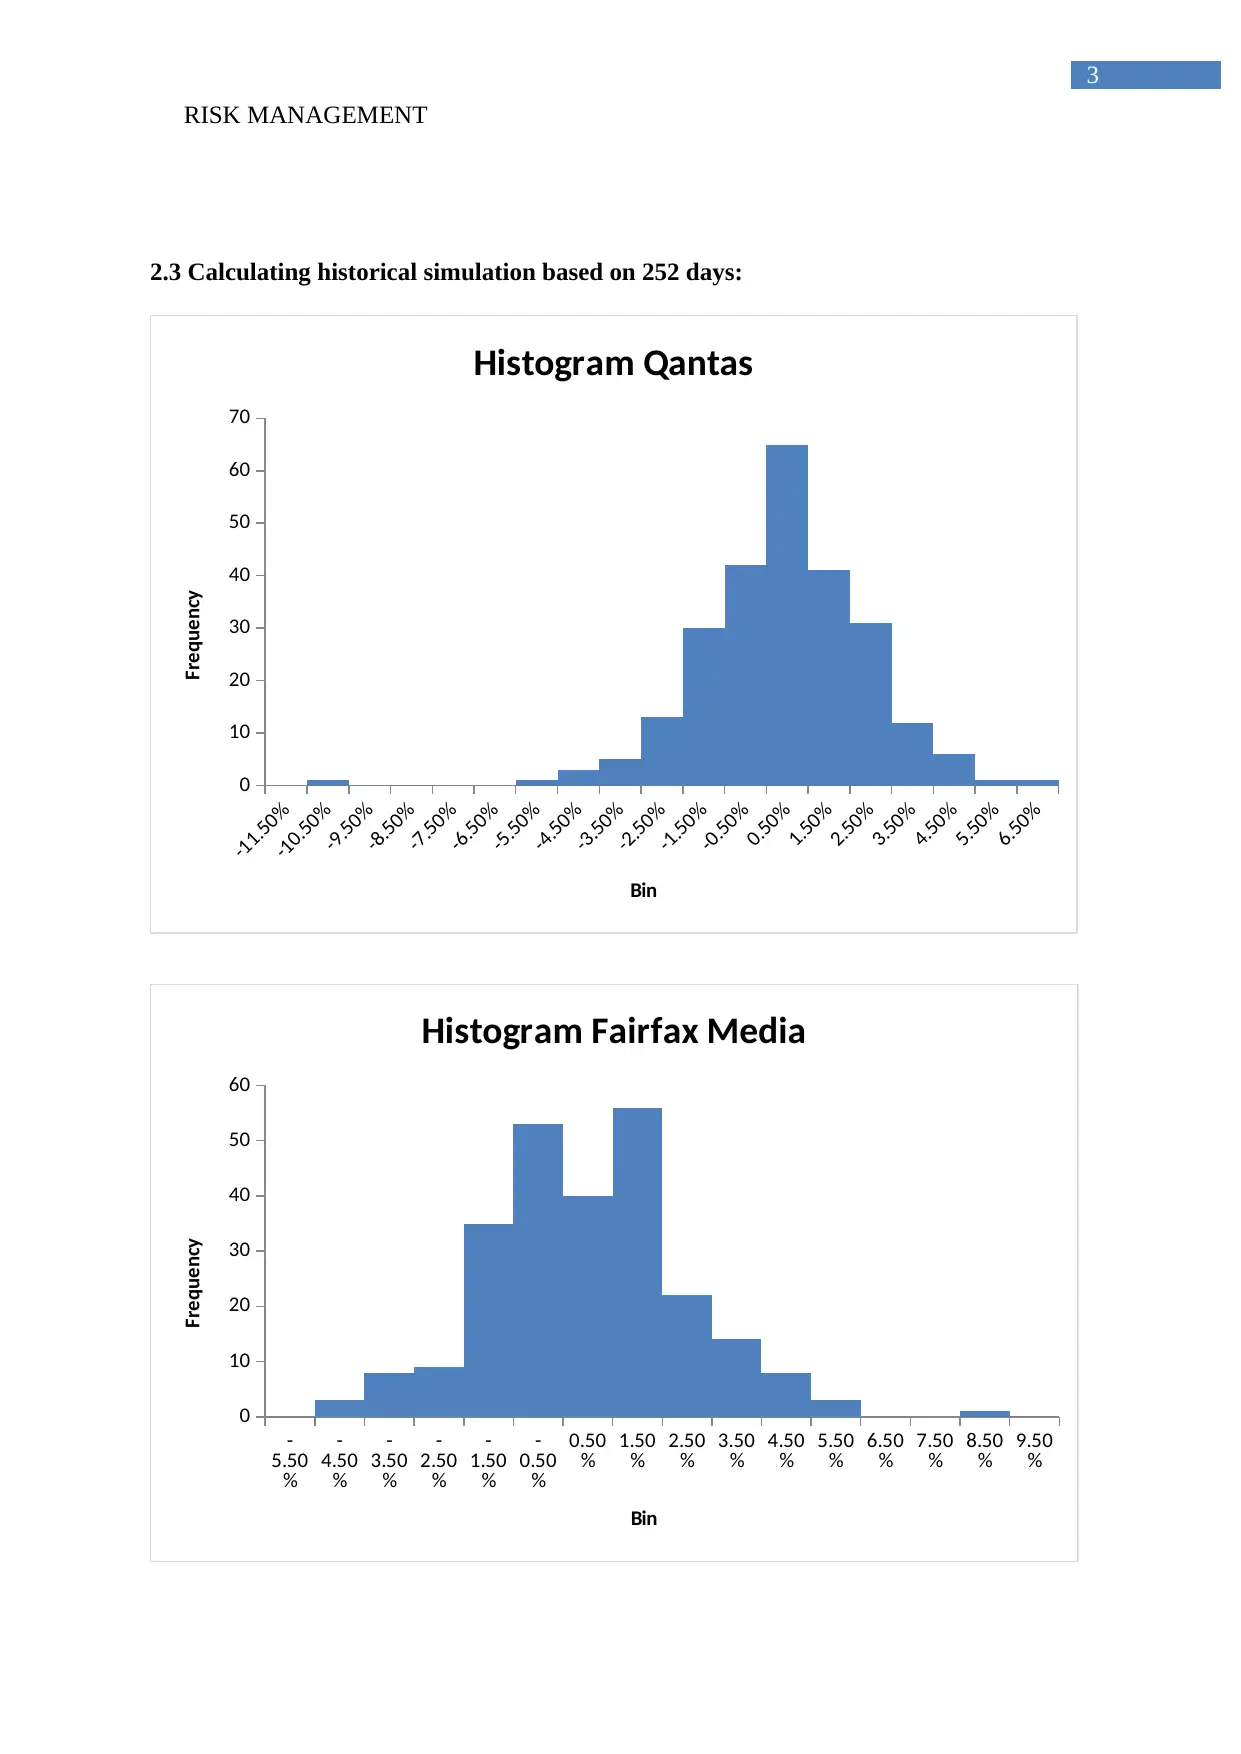
2.3 Calculating historical simulation based on 252 days:
-11.50%
-10.50%
-9.50%
-8.50%
-7.50%
-6.50%
-5.50%
-4.50%
-3.50%
-2.50%
-1.50%
-0.50%
0.50%
1.50%
2.50%
3.50%
4.50%
5.50%
6.50%
0
10
20
30
40
50
60
70
Histogram Qantas
Bin
Frequency
-
5.50
%
-
4.50
%
-
3.50
%
-
2.50
%
-
1.50
%
-
0.50
%
0.50
% 1.50
% 2.50
% 3.50
% 4.50
% 5.50
% 6.50
% 7.50
% 8.50
% 9.50
%
0
10
20
30
40
50
60
Histogram Fairfax Media
Bin
Frequency
RISK MANAGEMENT
2.3 Calculating historical simulation based on 252 days:
-11.50%
-10.50%
-9.50%
-8.50%
-7.50%
-6.50%
-5.50%
-4.50%
-3.50%
-2.50%
-1.50%
-0.50%
0.50%
1.50%
2.50%
3.50%
4.50%
5.50%
6.50%
0
10
20
30
40
50
60
70
Histogram Qantas
Bin
Frequency
-
5.50
%
-
4.50
%
-
3.50
%
-
2.50
%
-
1.50
%
-
0.50
%
0.50
% 1.50
% 2.50
% 3.50
% 4.50
% 5.50
% 6.50
% 7.50
% 8.50
% 9.50
%
0
10
20
30
40
50
60
Histogram Fairfax Media
Bin
Frequency
Paraphrase This Document
Need a fresh take? Get an instant paraphrase of this document with our AI Paraphraser
4
RISK MANAGEMENT
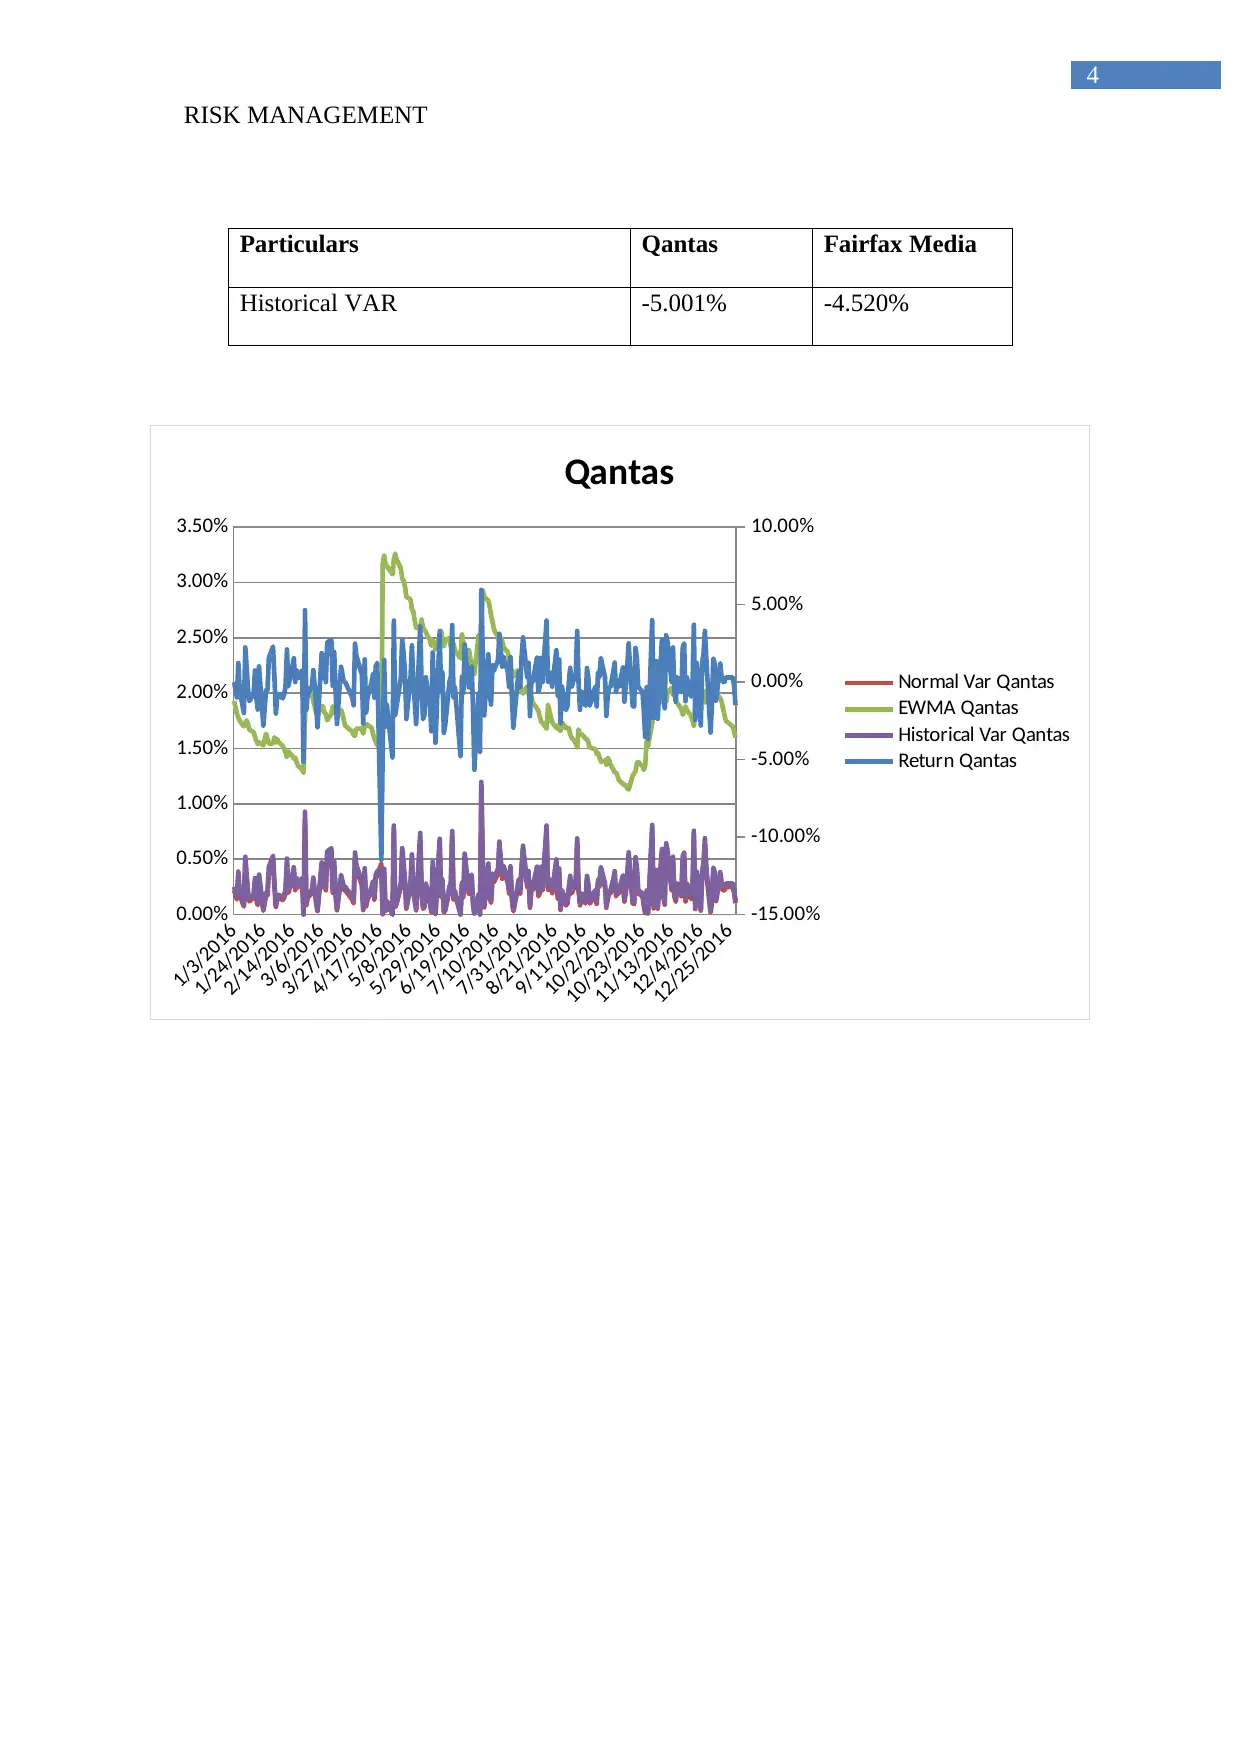
Particulars Qantas Fairfax Media
Historical VAR -5.001% -4.520%
1/3/2016
1/24/2016
2/14/2016
3/6/2016
3/27/2016
4/17/2016
5/8/2016
5/29/2016
6/19/2016
7/10/2016
7/31/2016
8/21/2016
9/11/2016
10/2/2016
10/23/2016
11/13/2016
12/4/2016
12/25/2016
0.00%
0.50%
1.00%
1.50%
2.00%
2.50%
3.00%
3.50%
-15.00%
-10.00%
-5.00%
0.00%
5.00%
10.00%
Qantas
Normal Var Qantas
EWMA Qantas
Historical Var Qantas
Return Qantas
RISK MANAGEMENT
Particulars Qantas Fairfax Media
Historical VAR -5.001% -4.520%
1/3/2016
1/24/2016
2/14/2016
3/6/2016
3/27/2016
4/17/2016
5/8/2016
5/29/2016
6/19/2016
7/10/2016
7/31/2016
8/21/2016
9/11/2016
10/2/2016
10/23/2016
11/13/2016
12/4/2016
12/25/2016
0.00%
0.50%
1.00%
1.50%
2.00%
2.50%
3.00%
3.50%
-15.00%
-10.00%
-5.00%
0.00%
5.00%
10.00%
Qantas
Normal Var Qantas
EWMA Qantas
Historical Var Qantas
Return Qantas
5
RISK MANAGEMENT
1/3/2016
1/24/2016
2/14/2016
3/6/2016
3/27/2016
4/17/2016
5/8/2016
5/29/2016
6/19/2016
7/10/2016
7/31/2016
8/21/2016
9/11/2016
10/2/2016
10/23/2016
11/13/2016
12/4/2016
12/25/2016
0.00%
0.50%
1.00%
1.50%
2.00%
2.50%
3.00%
3.50%
-6.00%
-4.00%
-2.00%
0.00%
2.00%
4.00%
6.00%
8.00%
10.00%
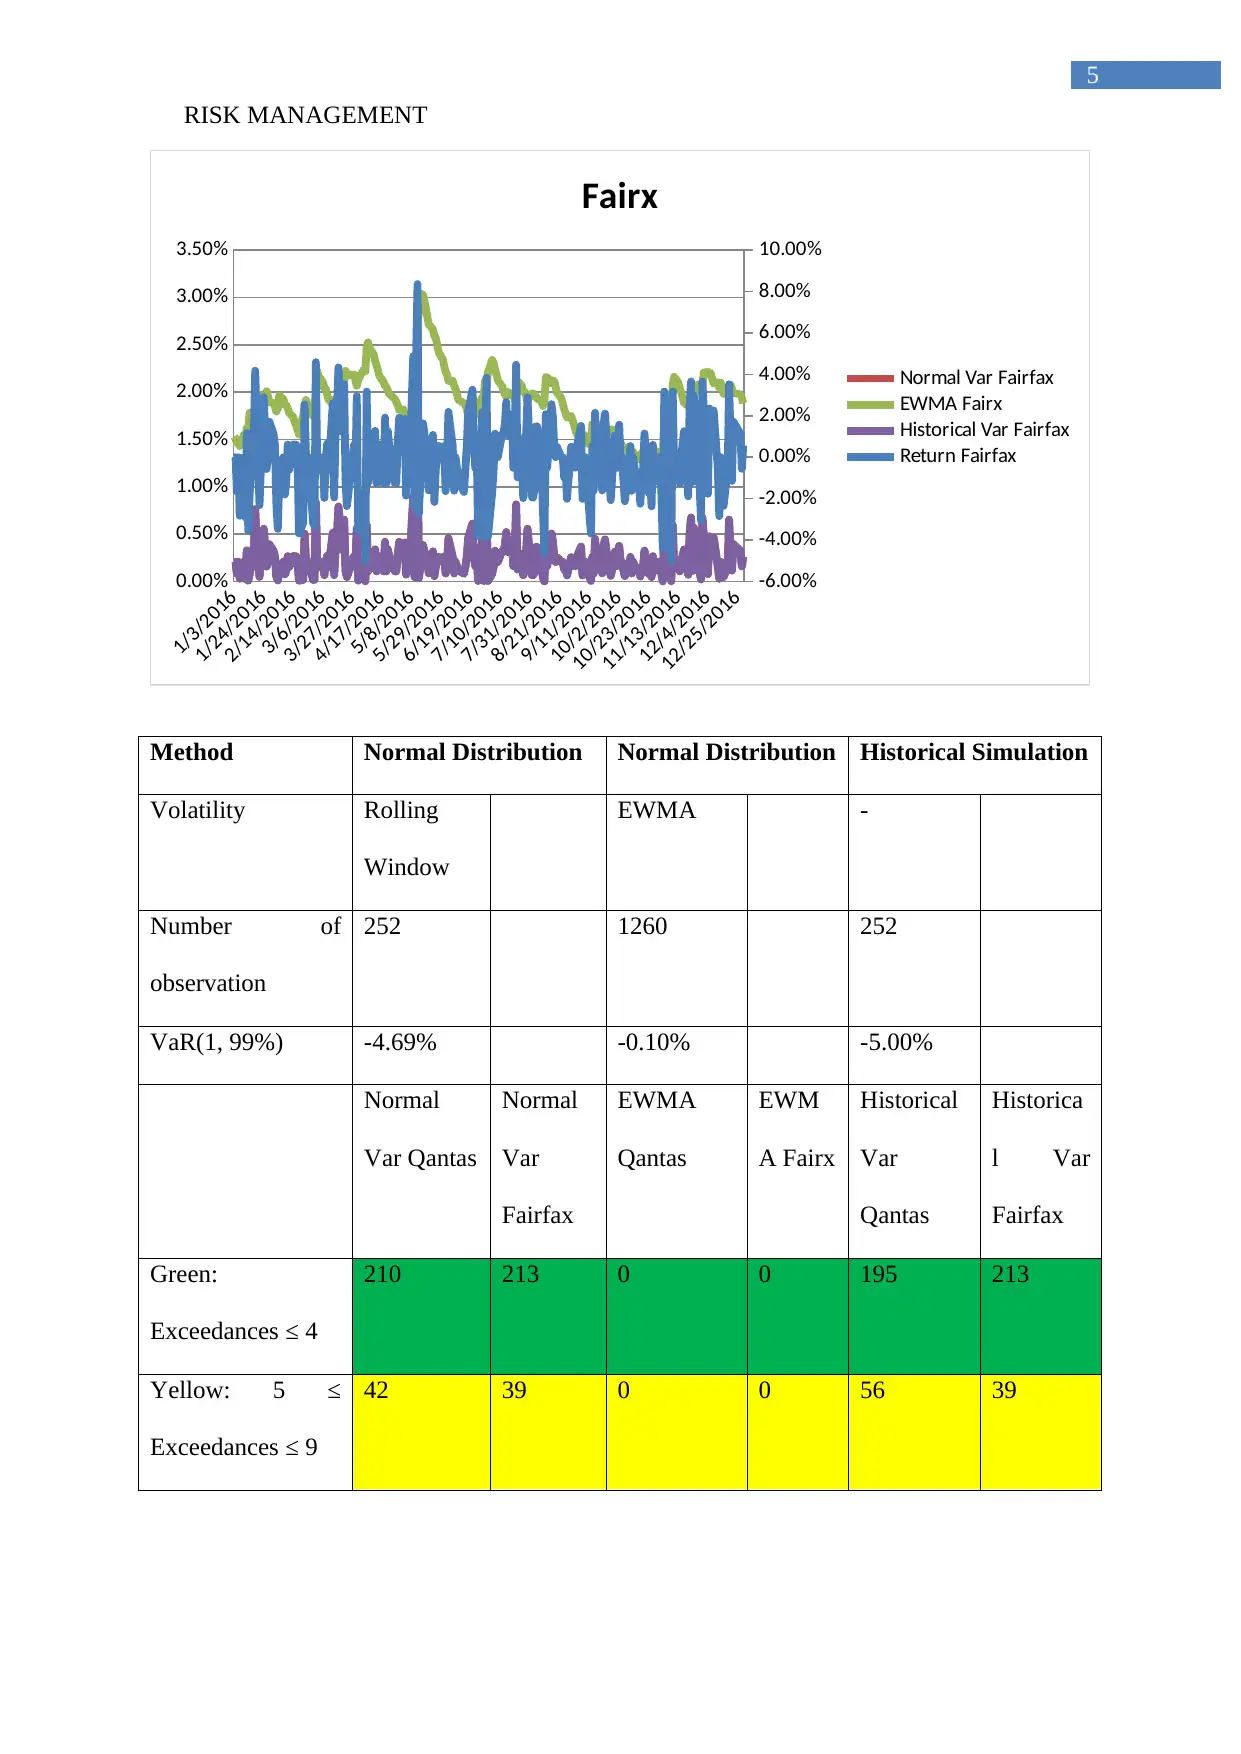
Fairx
Normal Var Fairfax
EWMA Fairx
Historical Var Fairfax
Return Fairfax
Method Normal Distribution Normal Distribution Historical Simulation
Volatility Rolling
Window
EWMA -
Number of
observation
252 1260 252
VaR(1, 99%) -4.69% -0.10% -5.00%
Normal
Var Qantas
Normal
Var
Fairfax
EWMA
Qantas
EWM
A Fairx
Historical
Var
Qantas
Historica
l Var
Fairfax
Green:
Exceedances ≤ 4
210 213 0 0 195 213
Yellow: 5 ≤
Exceedances ≤ 9
42 39 0 0 56 39
RISK MANAGEMENT
1/3/2016
1/24/2016
2/14/2016
3/6/2016
3/27/2016
4/17/2016
5/8/2016
5/29/2016
6/19/2016
7/10/2016
7/31/2016
8/21/2016
9/11/2016
10/2/2016
10/23/2016
11/13/2016
12/4/2016
12/25/2016
0.00%
0.50%
1.00%
1.50%
2.00%
2.50%
3.00%
3.50%
-6.00%
-4.00%
-2.00%
0.00%
2.00%
4.00%
6.00%
8.00%
10.00%
Fairx
Normal Var Fairfax
EWMA Fairx
Historical Var Fairfax
Return Fairfax
Method Normal Distribution Normal Distribution Historical Simulation
Volatility Rolling
Window
EWMA -
Number of
observation
252 1260 252
VaR(1, 99%) -4.69% -0.10% -5.00%
Normal
Var Qantas
Normal
Var
Fairfax
EWMA
Qantas
EWM
A Fairx
Historical
Var
Qantas
Historica
l Var
Fairfax
Green:
Exceedances ≤ 4
210 213 0 0 195 213
Yellow: 5 ≤
Exceedances ≤ 9
42 39 0 0 56 39
⊘ This is a preview!⊘
Do you want full access?
Subscribe today to unlock all pages.
Trusted by 1+ million students worldwide
6
RISK MANAGEMENT
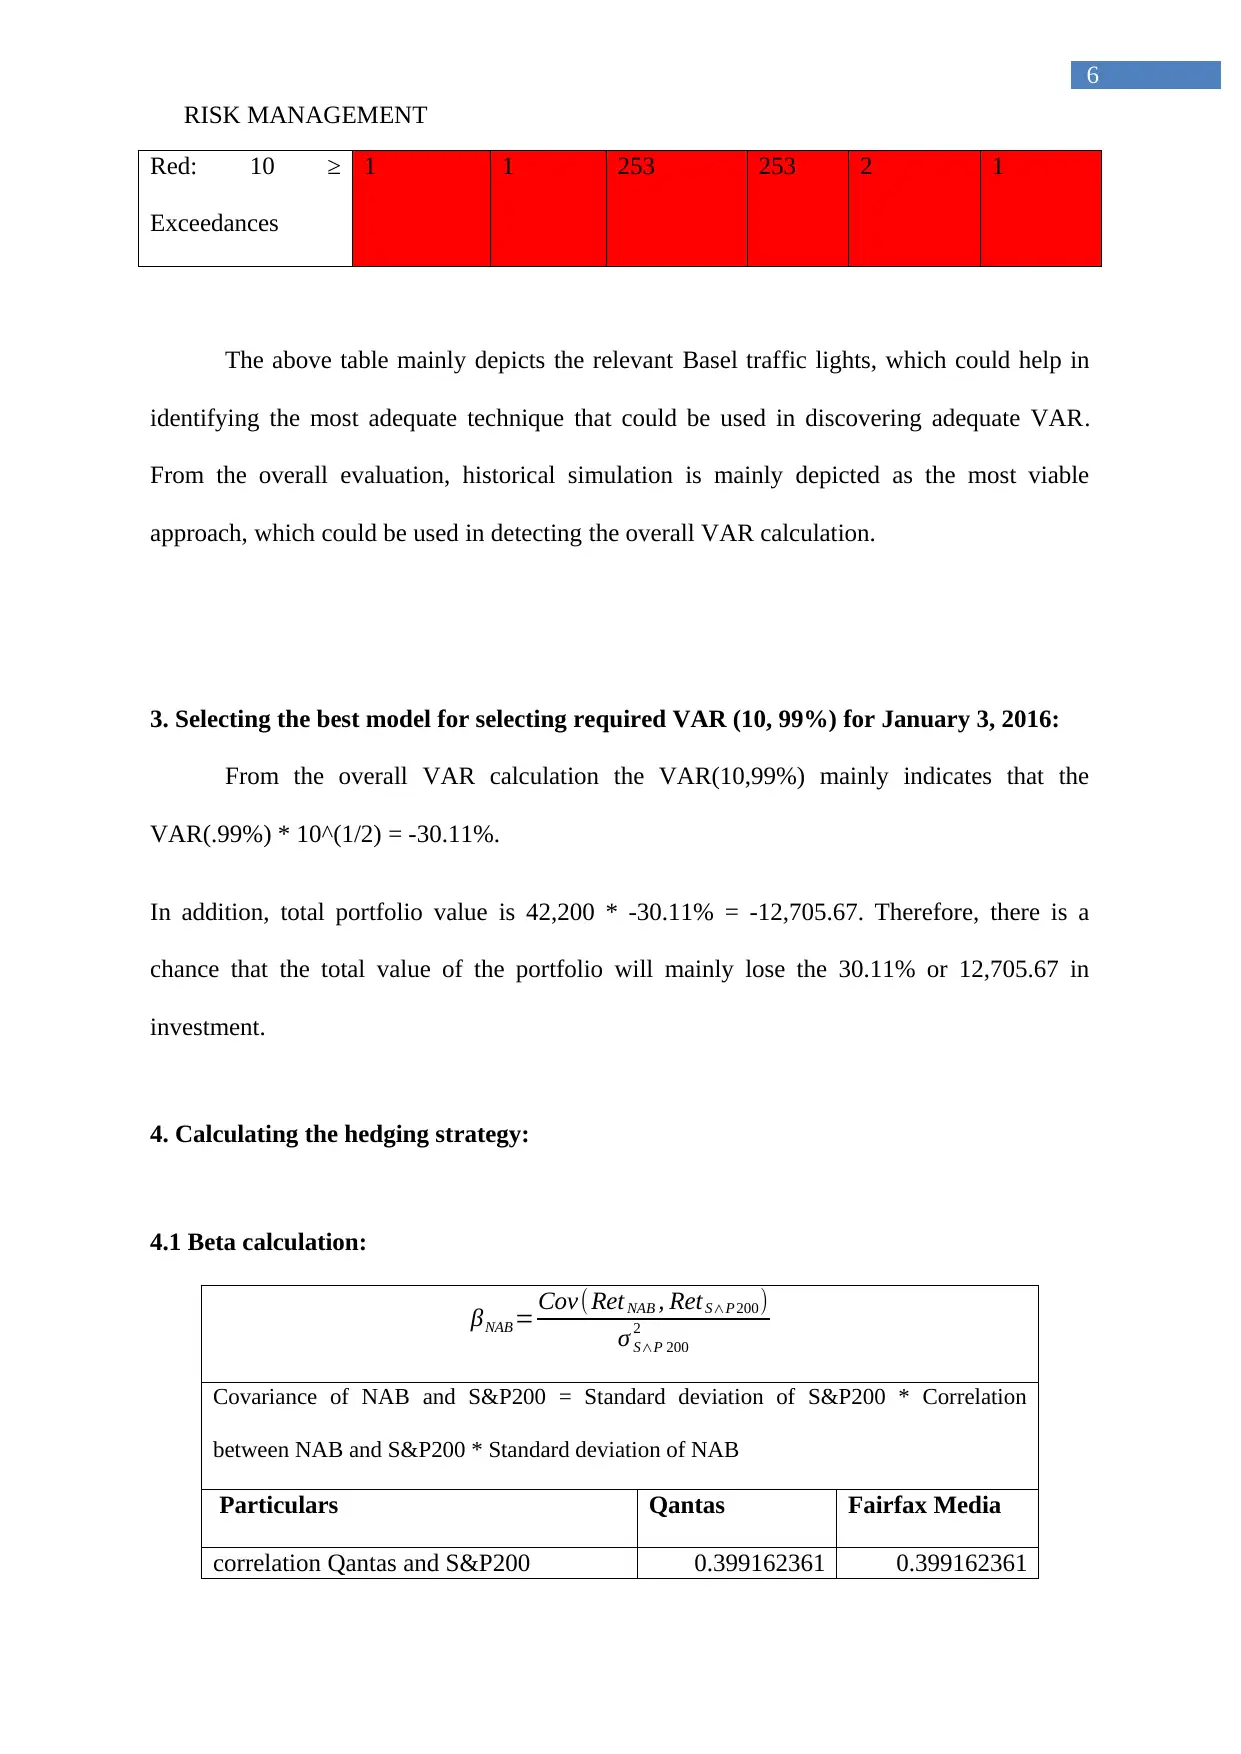
Red: 10 ≥
Exceedances
1 1 253 253 2 1
The above table mainly depicts the relevant Basel traffic lights, which could help in
identifying the most adequate technique that could be used in discovering adequate VAR.
From the overall evaluation, historical simulation is mainly depicted as the most viable
approach, which could be used in detecting the overall VAR calculation.
3. Selecting the best model for selecting required VAR (10, 99%) for January 3, 2016:
From the overall VAR calculation the VAR(10,99%) mainly indicates that the
VAR(.99%) * 10^(1/2) = -30.11%.
In addition, total portfolio value is 42,200 * -30.11% = -12,705.67. Therefore, there is a
chance that the total value of the portfolio will mainly lose the 30.11% or 12,705.67 in
investment.
4. Calculating the hedging strategy:
4.1 Beta calculation:
βNAB= Cov(Ret NAB , Ret S∧P 200)
σ S∧P 200
2
Covariance of NAB and S&P200 = Standard deviation of S&P200 * Correlation
between NAB and S&P200 * Standard deviation of NAB
Particulars Qantas Fairfax Media
correlation Qantas and S&P200 0.399162361 0.399162361
RISK MANAGEMENT
Red: 10 ≥
Exceedances
1 1 253 253 2 1
The above table mainly depicts the relevant Basel traffic lights, which could help in
identifying the most adequate technique that could be used in discovering adequate VAR.
From the overall evaluation, historical simulation is mainly depicted as the most viable
approach, which could be used in detecting the overall VAR calculation.
3. Selecting the best model for selecting required VAR (10, 99%) for January 3, 2016:
From the overall VAR calculation the VAR(10,99%) mainly indicates that the
VAR(.99%) * 10^(1/2) = -30.11%.
In addition, total portfolio value is 42,200 * -30.11% = -12,705.67. Therefore, there is a
chance that the total value of the portfolio will mainly lose the 30.11% or 12,705.67 in
investment.
4. Calculating the hedging strategy:
4.1 Beta calculation:
βNAB= Cov(Ret NAB , Ret S∧P 200)
σ S∧P 200
2
Covariance of NAB and S&P200 = Standard deviation of S&P200 * Correlation
between NAB and S&P200 * Standard deviation of NAB
Particulars Qantas Fairfax Media
correlation Qantas and S&P200 0.399162361 0.399162361
Paraphrase This Document
Need a fresh take? Get an instant paraphrase of this document with our AI Paraphraser
7
RISK MANAGEMENT
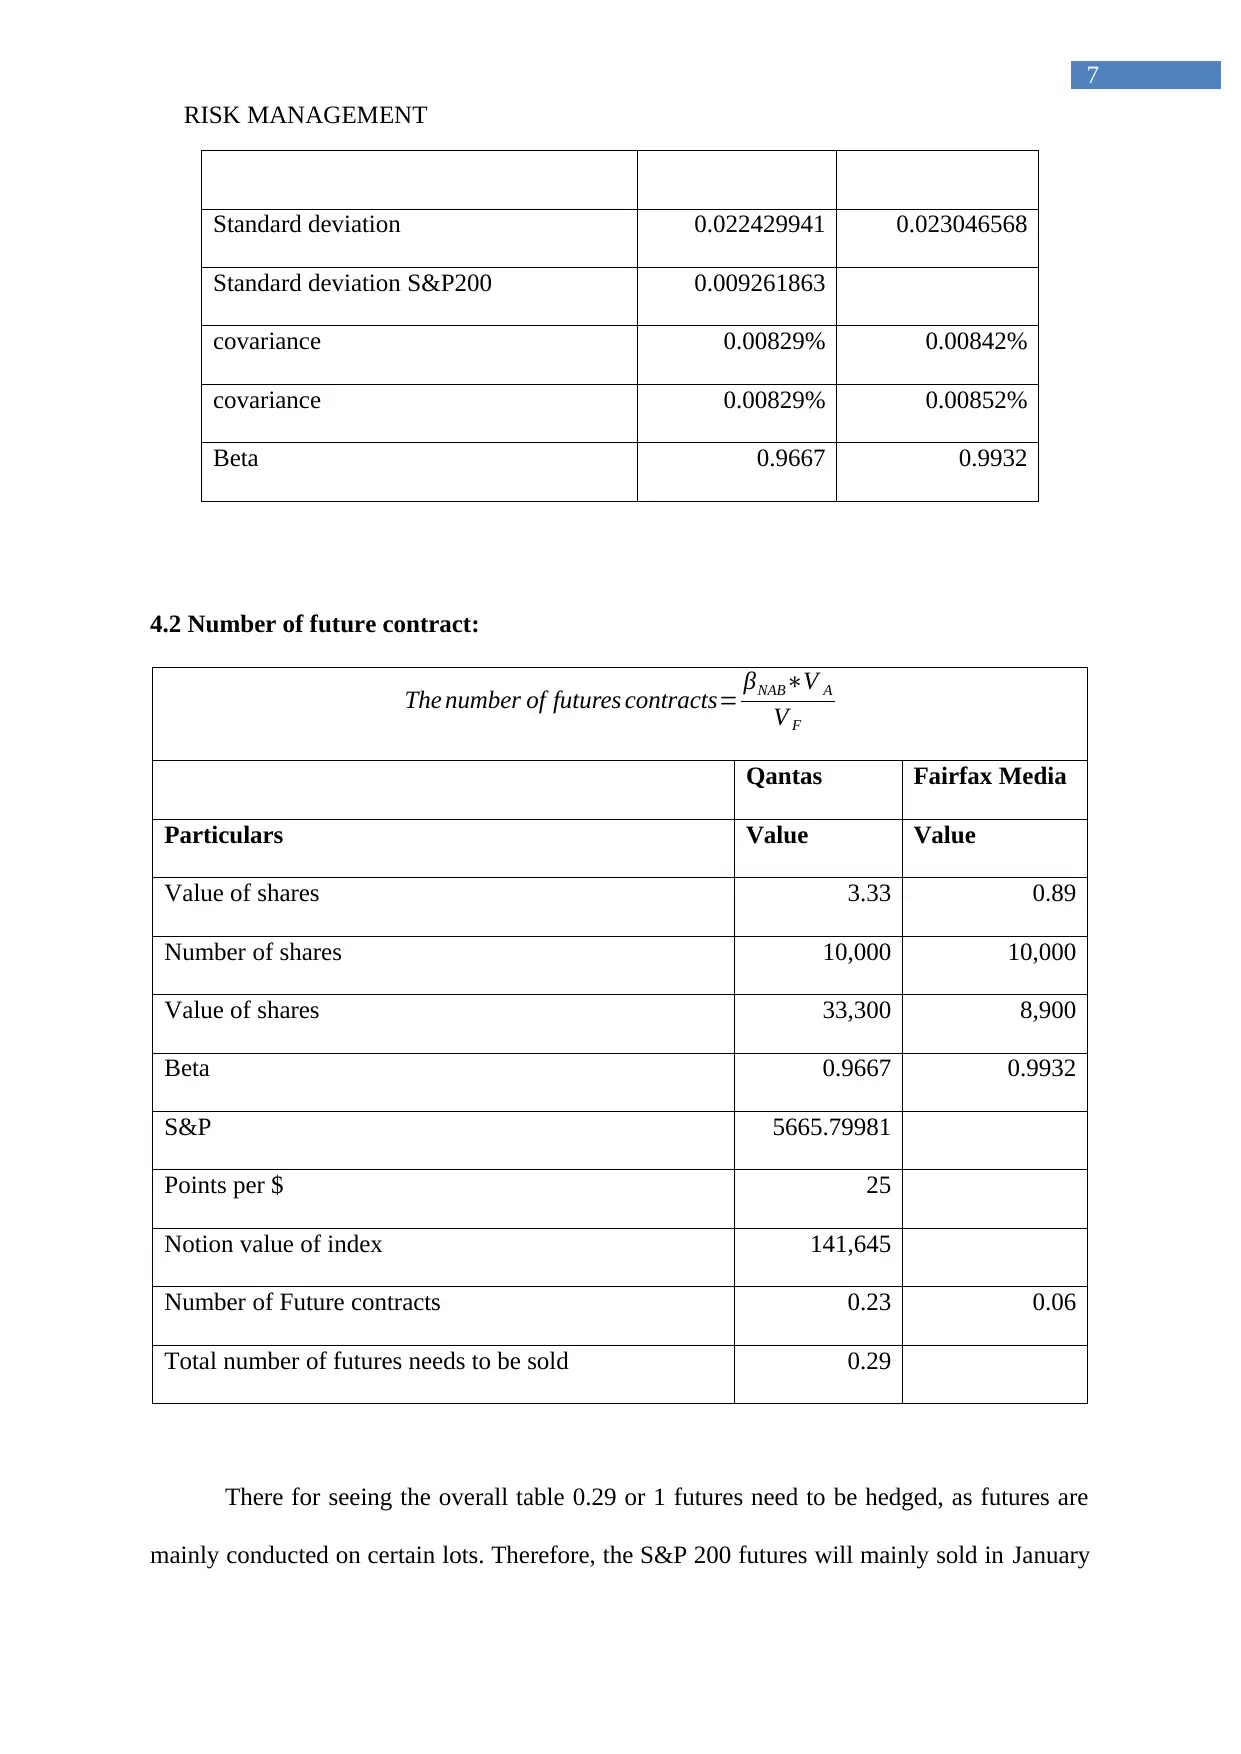
Standard deviation 0.022429941 0.023046568
Standard deviation S&P200 0.009261863
covariance 0.00829% 0.00842%
covariance 0.00829% 0.00852%
Beta 0.9667 0.9932
4.2 Number of future contract:
The number of futures contracts= βNAB∗V A
V F
Qantas Fairfax Media
Particulars Value Value
Value of shares 3.33 0.89
Number of shares 10,000 10,000
Value of shares 33,300 8,900
Beta 0.9667 0.9932
S&P 5665.79981
Points per $ 25
Notion value of index 141,645
Number of Future contracts 0.23 0.06
Total number of futures needs to be sold 0.29
There for seeing the overall table 0.29 or 1 futures need to be hedged, as futures are
mainly conducted on certain lots. Therefore, the S&P 200 futures will mainly sold in January
RISK MANAGEMENT
Standard deviation 0.022429941 0.023046568
Standard deviation S&P200 0.009261863
covariance 0.00829% 0.00842%
covariance 0.00829% 0.00852%
Beta 0.9667 0.9932
4.2 Number of future contract:
The number of futures contracts= βNAB∗V A
V F
Qantas Fairfax Media
Particulars Value Value
Value of shares 3.33 0.89
Number of shares 10,000 10,000
Value of shares 33,300 8,900
Beta 0.9667 0.9932
S&P 5665.79981
Points per $ 25
Notion value of index 141,645
Number of Future contracts 0.23 0.06
Total number of futures needs to be sold 0.29
There for seeing the overall table 0.29 or 1 futures need to be hedged, as futures are
mainly conducted on certain lots. Therefore, the S&P 200 futures will mainly sold in January
8
RISK MANAGEMENT
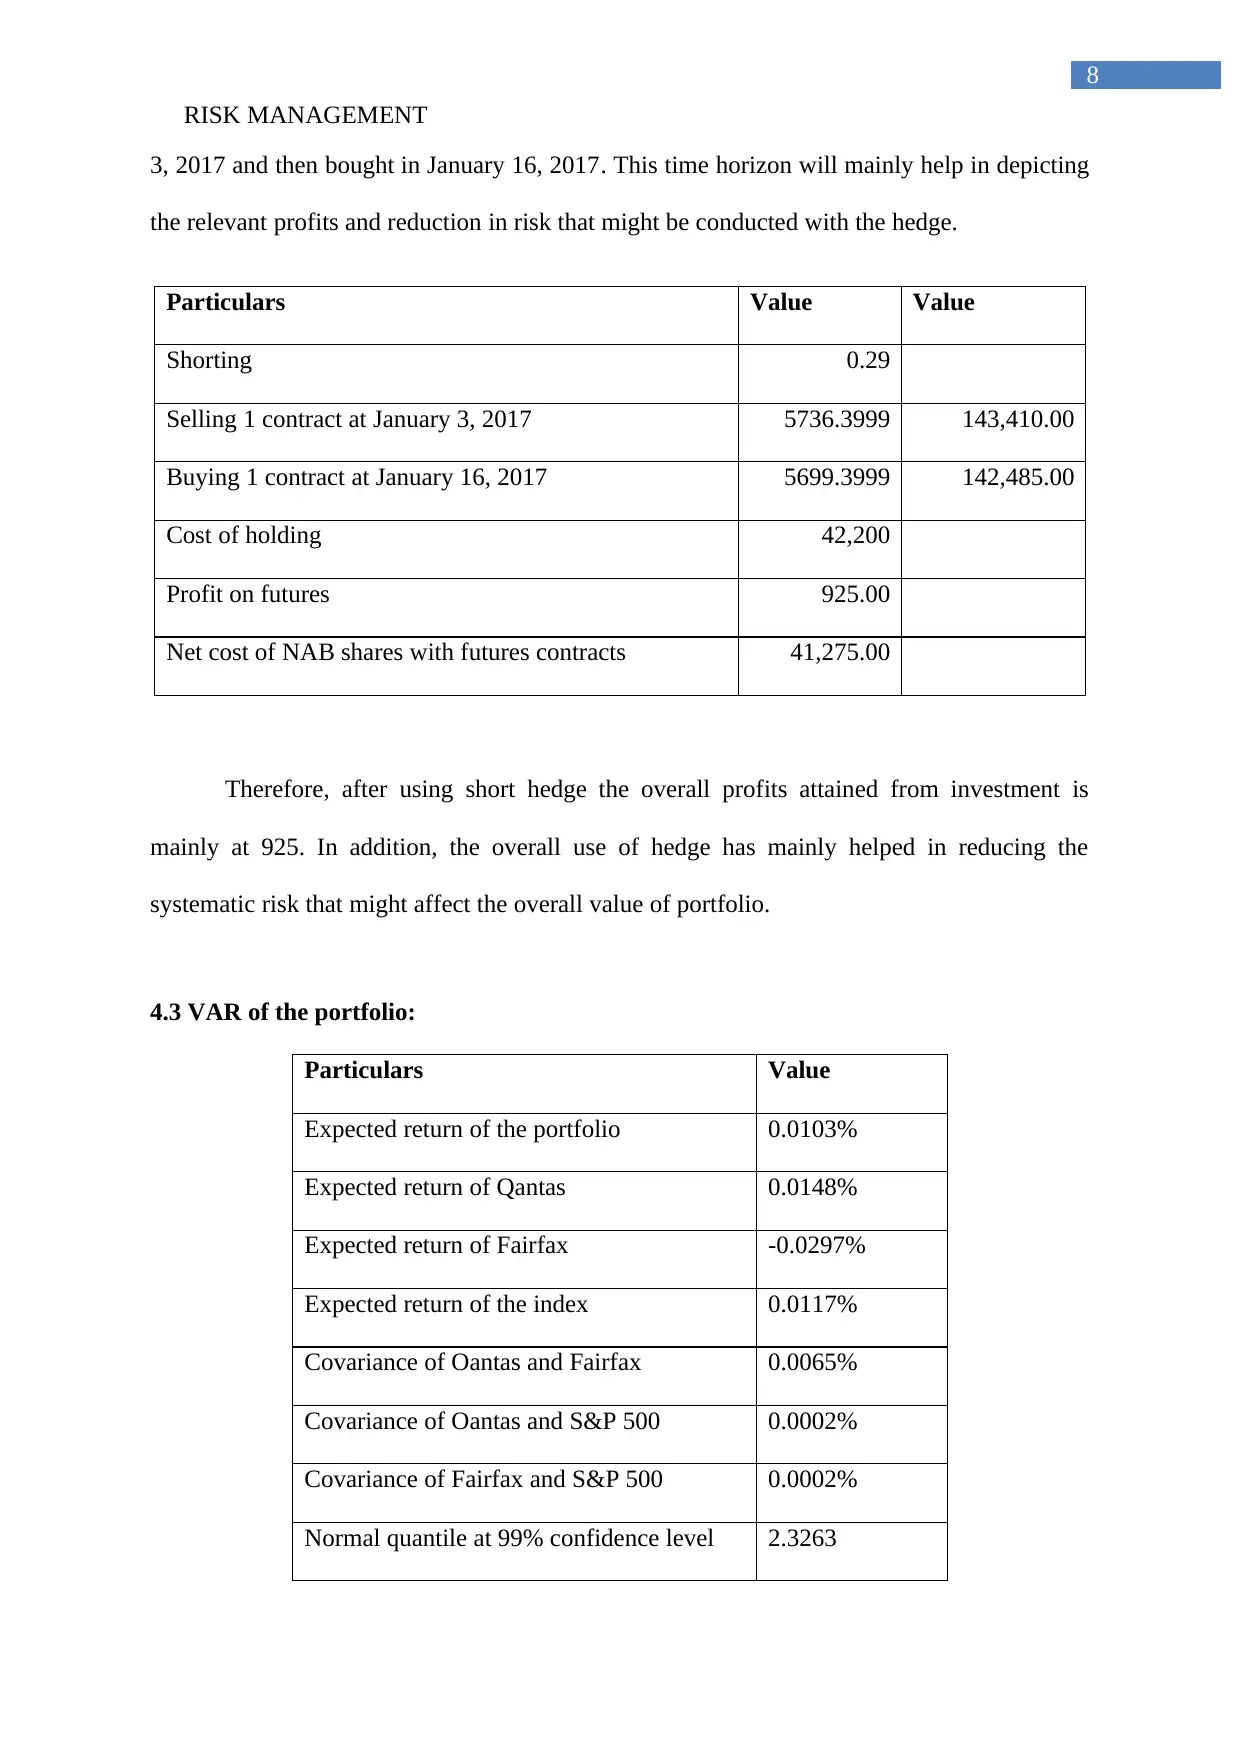
3, 2017 and then bought in January 16, 2017. This time horizon will mainly help in depicting
the relevant profits and reduction in risk that might be conducted with the hedge.
Particulars Value Value
Shorting 0.29
Selling 1 contract at January 3, 2017 5736.3999 143,410.00
Buying 1 contract at January 16, 2017 5699.3999 142,485.00
Cost of holding 42,200
Profit on futures 925.00
Net cost of NAB shares with futures contracts 41,275.00
Therefore, after using short hedge the overall profits attained from investment is
mainly at 925. In addition, the overall use of hedge has mainly helped in reducing the
systematic risk that might affect the overall value of portfolio.
4.3 VAR of the portfolio:
Particulars Value
Expected return of the portfolio 0.0103%
Expected return of Qantas 0.0148%
Expected return of Fairfax -0.0297%
Expected return of the index 0.0117%
Covariance of Oantas and Fairfax 0.0065%
Covariance of Oantas and S&P 500 0.0002%
Covariance of Fairfax and S&P 500 0.0002%
Normal quantile at 99% confidence level 2.3263
RISK MANAGEMENT
3, 2017 and then bought in January 16, 2017. This time horizon will mainly help in depicting
the relevant profits and reduction in risk that might be conducted with the hedge.
Particulars Value Value
Shorting 0.29
Selling 1 contract at January 3, 2017 5736.3999 143,410.00
Buying 1 contract at January 16, 2017 5699.3999 142,485.00
Cost of holding 42,200
Profit on futures 925.00
Net cost of NAB shares with futures contracts 41,275.00
Therefore, after using short hedge the overall profits attained from investment is
mainly at 925. In addition, the overall use of hedge has mainly helped in reducing the
systematic risk that might affect the overall value of portfolio.
4.3 VAR of the portfolio:
Particulars Value
Expected return of the portfolio 0.0103%
Expected return of Qantas 0.0148%
Expected return of Fairfax -0.0297%
Expected return of the index 0.0117%
Covariance of Oantas and Fairfax 0.0065%
Covariance of Oantas and S&P 500 0.0002%
Covariance of Fairfax and S&P 500 0.0002%
Normal quantile at 99% confidence level 2.3263
⊘ This is a preview!⊘
Do you want full access?
Subscribe today to unlock all pages.
Trusted by 1+ million students worldwide
9
RISK MANAGEMENT
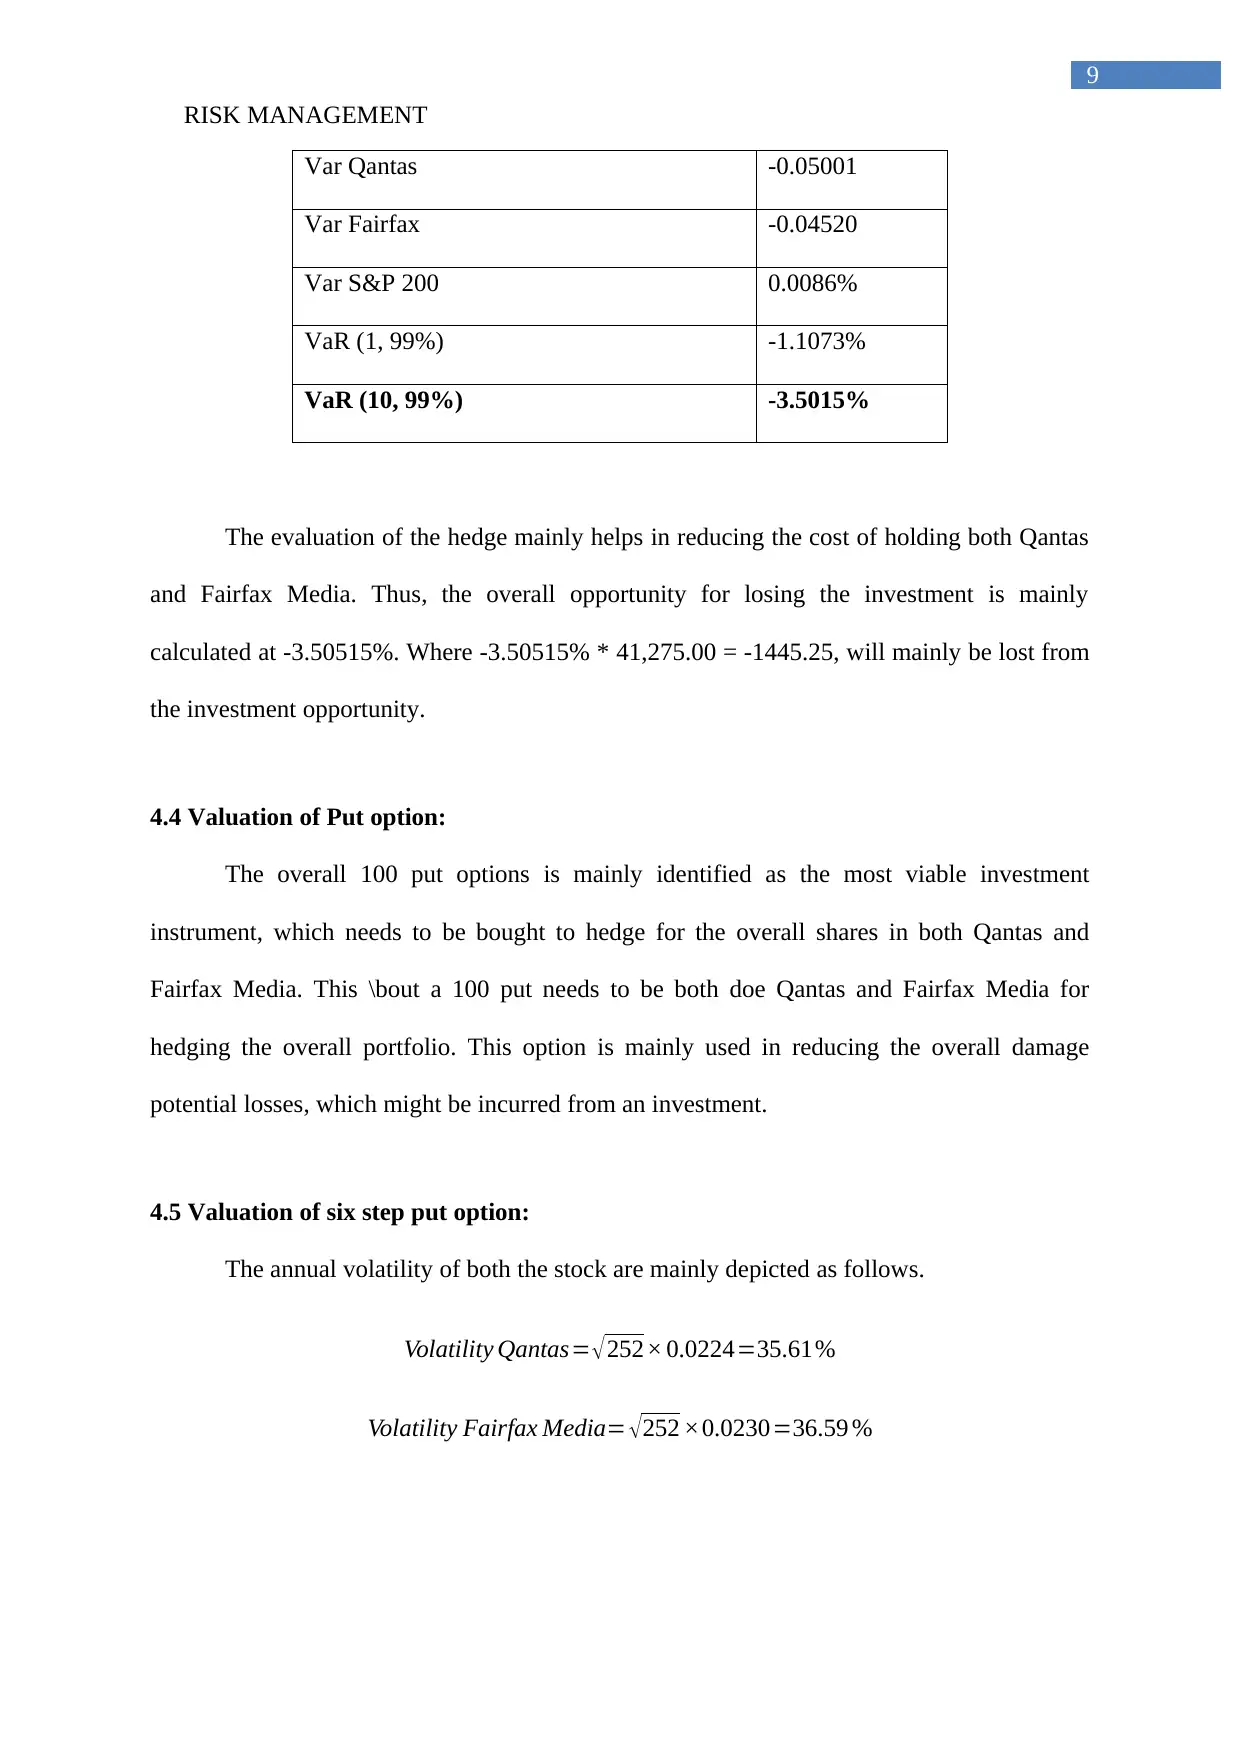
Var Qantas -0.05001
Var Fairfax -0.04520
Var S&P 200 0.0086%
VaR (1, 99%) -1.1073%
VaR (10, 99%) -3.5015%
The evaluation of the hedge mainly helps in reducing the cost of holding both Qantas
and Fairfax Media. Thus, the overall opportunity for losing the investment is mainly
calculated at -3.50515%. Where -3.50515% * 41,275.00 = -1445.25, will mainly be lost from
the investment opportunity.
4.4 Valuation of Put option:
The overall 100 put options is mainly identified as the most viable investment
instrument, which needs to be bought to hedge for the overall shares in both Qantas and
Fairfax Media. This \bout a 100 put needs to be both doe Qantas and Fairfax Media for
hedging the overall portfolio. This option is mainly used in reducing the overall damage
potential losses, which might be incurred from an investment.
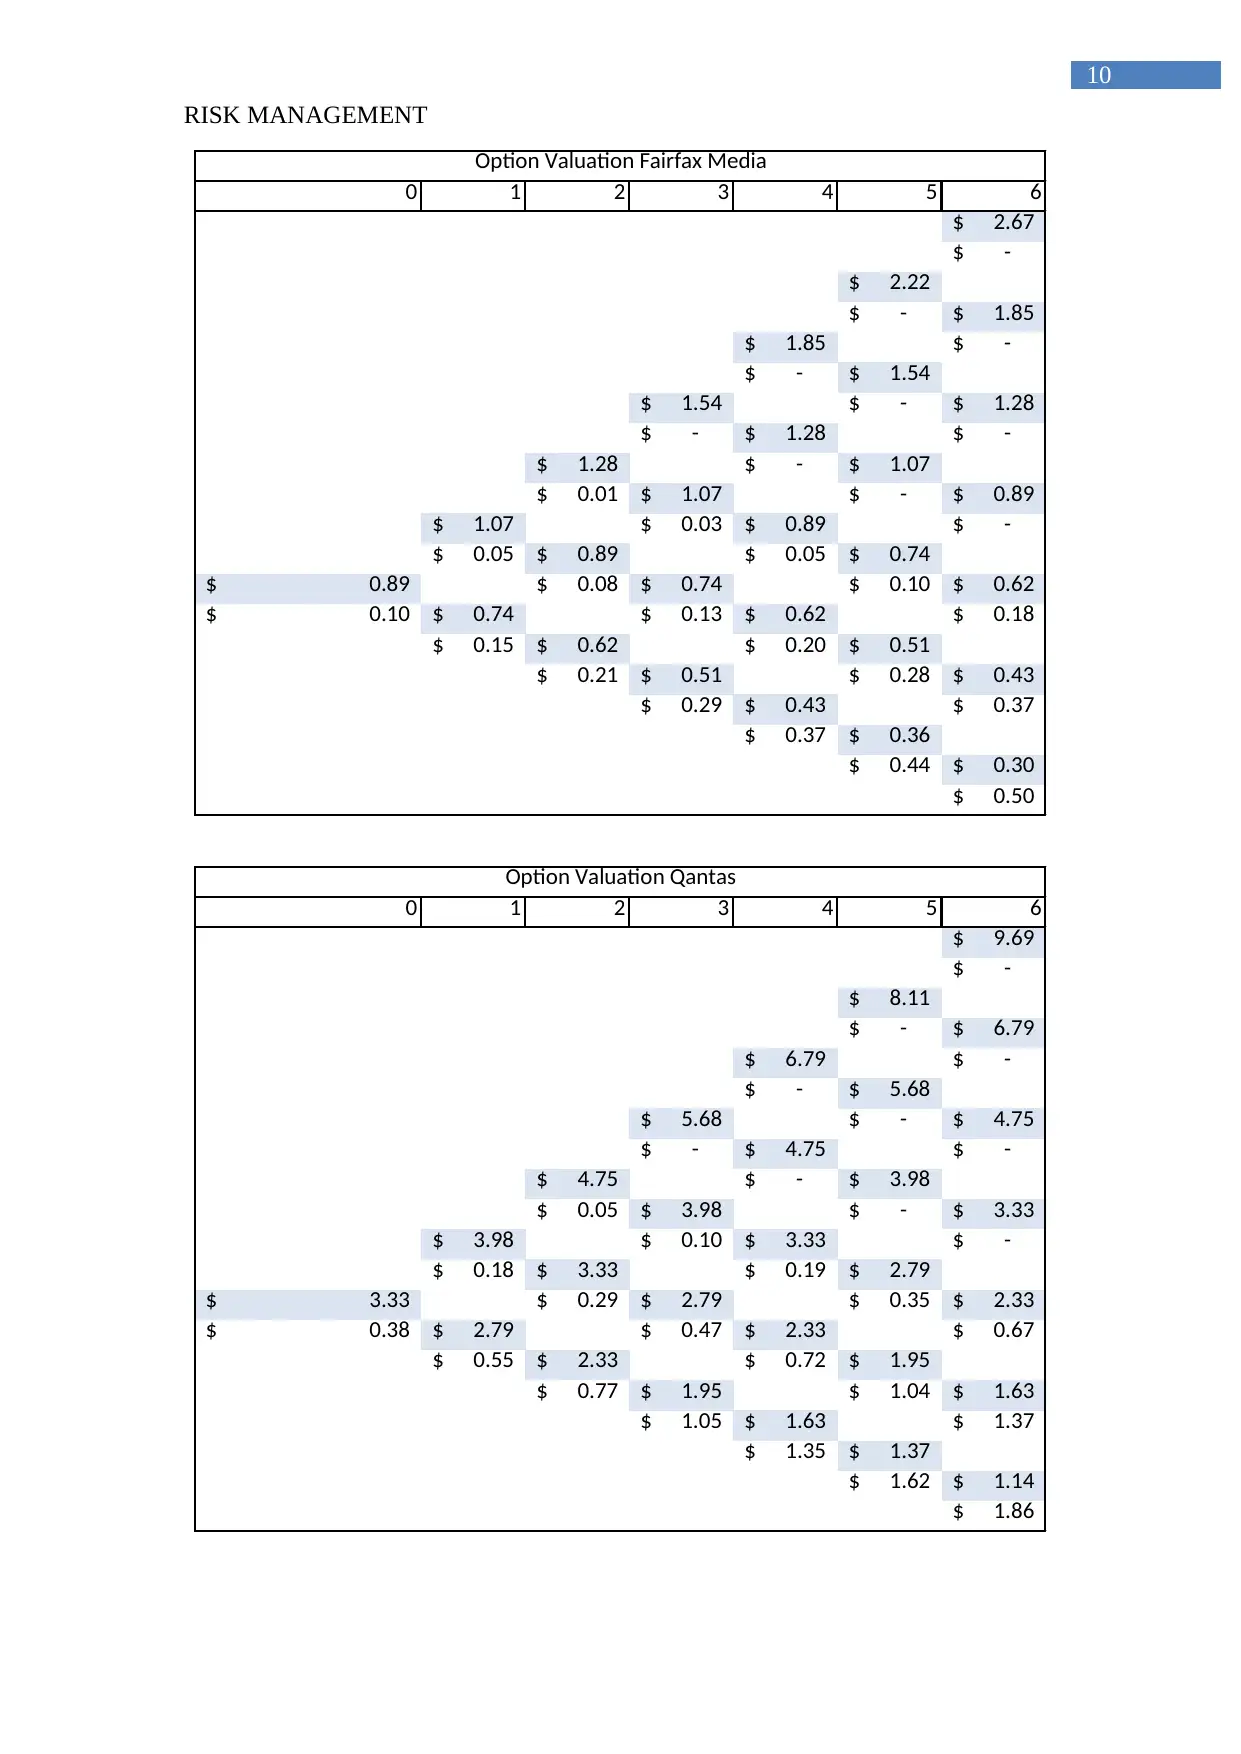
4.5 Valuation of six step put option:
The annual volatility of both the stock are mainly depicted as follows.
Volatility Qantas= √252× 0.0224=35.61%
Volatility Fairfax Media= √252 ×0.0230=36.59 %
RISK MANAGEMENT
Var Qantas -0.05001
Var Fairfax -0.04520
Var S&P 200 0.0086%
VaR (1, 99%) -1.1073%
VaR (10, 99%) -3.5015%
The evaluation of the hedge mainly helps in reducing the cost of holding both Qantas
and Fairfax Media. Thus, the overall opportunity for losing the investment is mainly
calculated at -3.50515%. Where -3.50515% * 41,275.00 = -1445.25, will mainly be lost from
the investment opportunity.
4.4 Valuation of Put option:
The overall 100 put options is mainly identified as the most viable investment
instrument, which needs to be bought to hedge for the overall shares in both Qantas and
Fairfax Media. This \bout a 100 put needs to be both doe Qantas and Fairfax Media for
hedging the overall portfolio. This option is mainly used in reducing the overall damage
potential losses, which might be incurred from an investment.
4.5 Valuation of six step put option:
The annual volatility of both the stock are mainly depicted as follows.
Volatility Qantas= √252× 0.0224=35.61%
Volatility Fairfax Media= √252 ×0.0230=36.59 %
Paraphrase This Document
Need a fresh take? Get an instant paraphrase of this document with our AI Paraphraser
10
RISK MANAGEMENT
0 1 2 3 4 5 6
2.67$
-$
2.22$
-$ 1.85$
1.85$ -$
-$ 1.54$
1.54$ -$ 1.28$
-$ 1.28$ -$
1.28$ -$ 1.07$
0.01$ 1.07$ -$ 0.89$
1.07$ 0.03$ 0.89$ -$
0.05$ 0.89$ 0.05$ 0.74$
0.89$ 0.08$ 0.74$ 0.10$ 0.62$
0.10$ 0.74$ 0.13$ 0.62$ 0.18$
0.15$ 0.62$ 0.20$ 0.51$
0.21$ 0.51$ 0.28$ 0.43$
0.29$ 0.43$ 0.37$
0.37$ 0.36$
0.44$ 0.30$
0.50$
Option Valuation Fairfax Media
0 1 2 3 4 5 6
9.69$
-$
8.11$
-$ 6.79$
6.79$ -$
-$ 5.68$
5.68$ -$ 4.75$
-$ 4.75$ -$
4.75$ -$ 3.98$
0.05$ 3.98$ -$ 3.33$
3.98$ 0.10$ 3.33$ -$
0.18$ 3.33$ 0.19$ 2.79$
3.33$ 0.29$ 2.79$ 0.35$ 2.33$
0.38$ 2.79$ 0.47$ 2.33$ 0.67$
0.55$ 2.33$ 0.72$ 1.95$
0.77$ 1.95$ 1.04$ 1.63$
1.05$ 1.63$ 1.37$
1.35$ 1.37$
1.62$ 1.14$
1.86$
Option Valuation Qantas
11
RISK MANAGEMENT
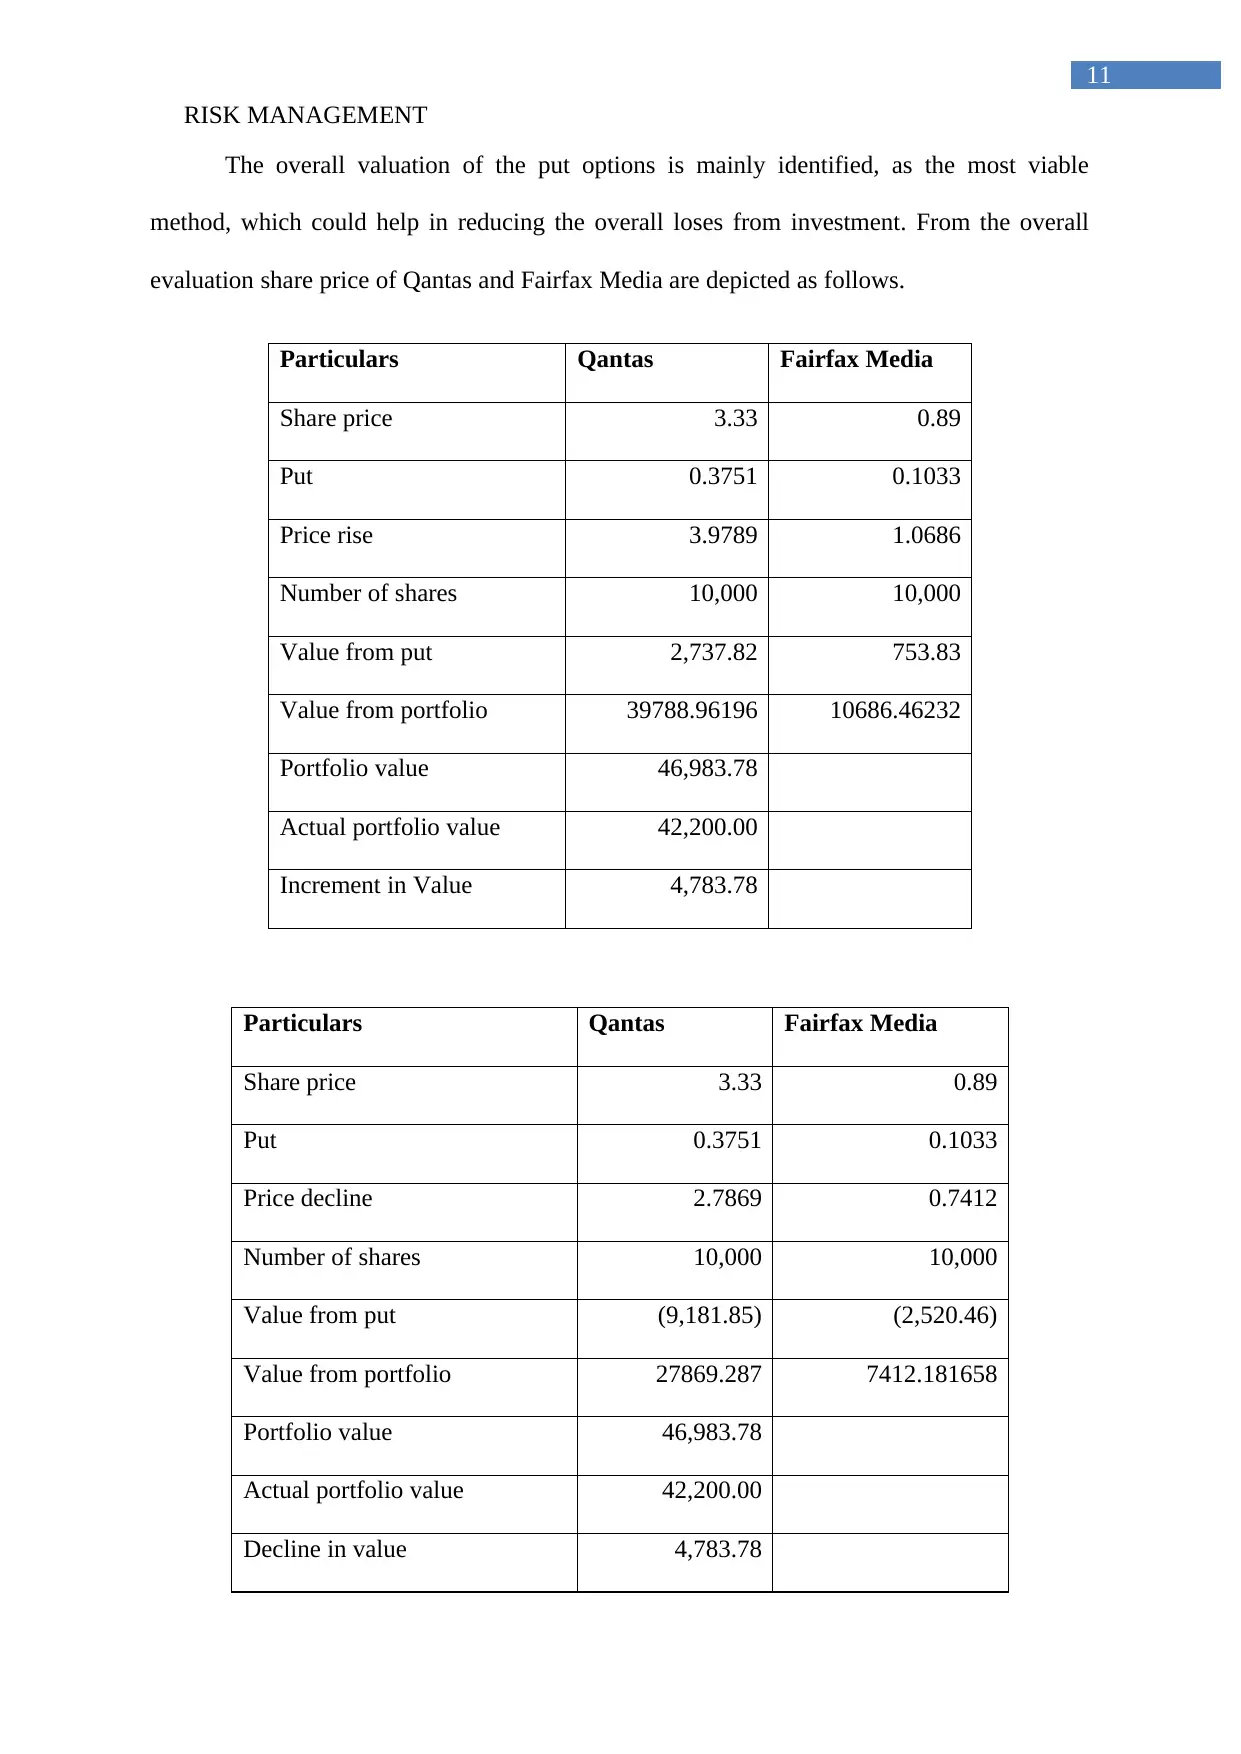
The overall valuation of the put options is mainly identified, as the most viable
method, which could help in reducing the overall loses from investment. From the overall
evaluation share price of Qantas and Fairfax Media are depicted as follows.
Particulars Qantas Fairfax Media
Share price 3.33 0.89
Put 0.3751 0.1033
Price rise 3.9789 1.0686
Number of shares 10,000 10,000
Value from put 2,737.82 753.83
Value from portfolio 39788.96196 10686.46232
Portfolio value 46,983.78
Actual portfolio value 42,200.00
Increment in Value 4,783.78
Particulars Qantas Fairfax Media
Share price 3.33 0.89
Put 0.3751 0.1033
Price decline 2.7869 0.7412
Number of shares 10,000 10,000
Value from put (9,181.85) (2,520.46)
Value from portfolio 27869.287 7412.181658
Portfolio value 46,983.78
Actual portfolio value 42,200.00
Decline in value 4,783.78
RISK MANAGEMENT
The overall valuation of the put options is mainly identified, as the most viable
method, which could help in reducing the overall loses from investment. From the overall
evaluation share price of Qantas and Fairfax Media are depicted as follows.
Particulars Qantas Fairfax Media
Share price 3.33 0.89
Put 0.3751 0.1033
Price rise 3.9789 1.0686
Number of shares 10,000 10,000
Value from put 2,737.82 753.83
Value from portfolio 39788.96196 10686.46232
Portfolio value 46,983.78
Actual portfolio value 42,200.00
Increment in Value 4,783.78
Particulars Qantas Fairfax Media
Share price 3.33 0.89
Put 0.3751 0.1033
Price decline 2.7869 0.7412
Number of shares 10,000 10,000
Value from put (9,181.85) (2,520.46)
Value from portfolio 27869.287 7412.181658
Portfolio value 46,983.78
Actual portfolio value 42,200.00
Decline in value 4,783.78
⊘ This is a preview!⊘
Do you want full access?
Subscribe today to unlock all pages.
Trusted by 1+ million students worldwide
1 out of 15
Your All-in-One AI-Powered Toolkit for Academic Success.
+13062052269
info@desklib.com
Available 24*7 on WhatsApp / Email
![[object Object]](/_next/static/media/star-bottom.7253800d.svg)
Unlock your academic potential
Copyright © 2020–2026 A2Z Services. All Rights Reserved. Developed and managed by ZUCOL.