Experimental Analysis: Salt Concentration and Yeast Fermentation

Verified

Added on  2023/06/13

|8
|1909
|62
Report
AI Summary
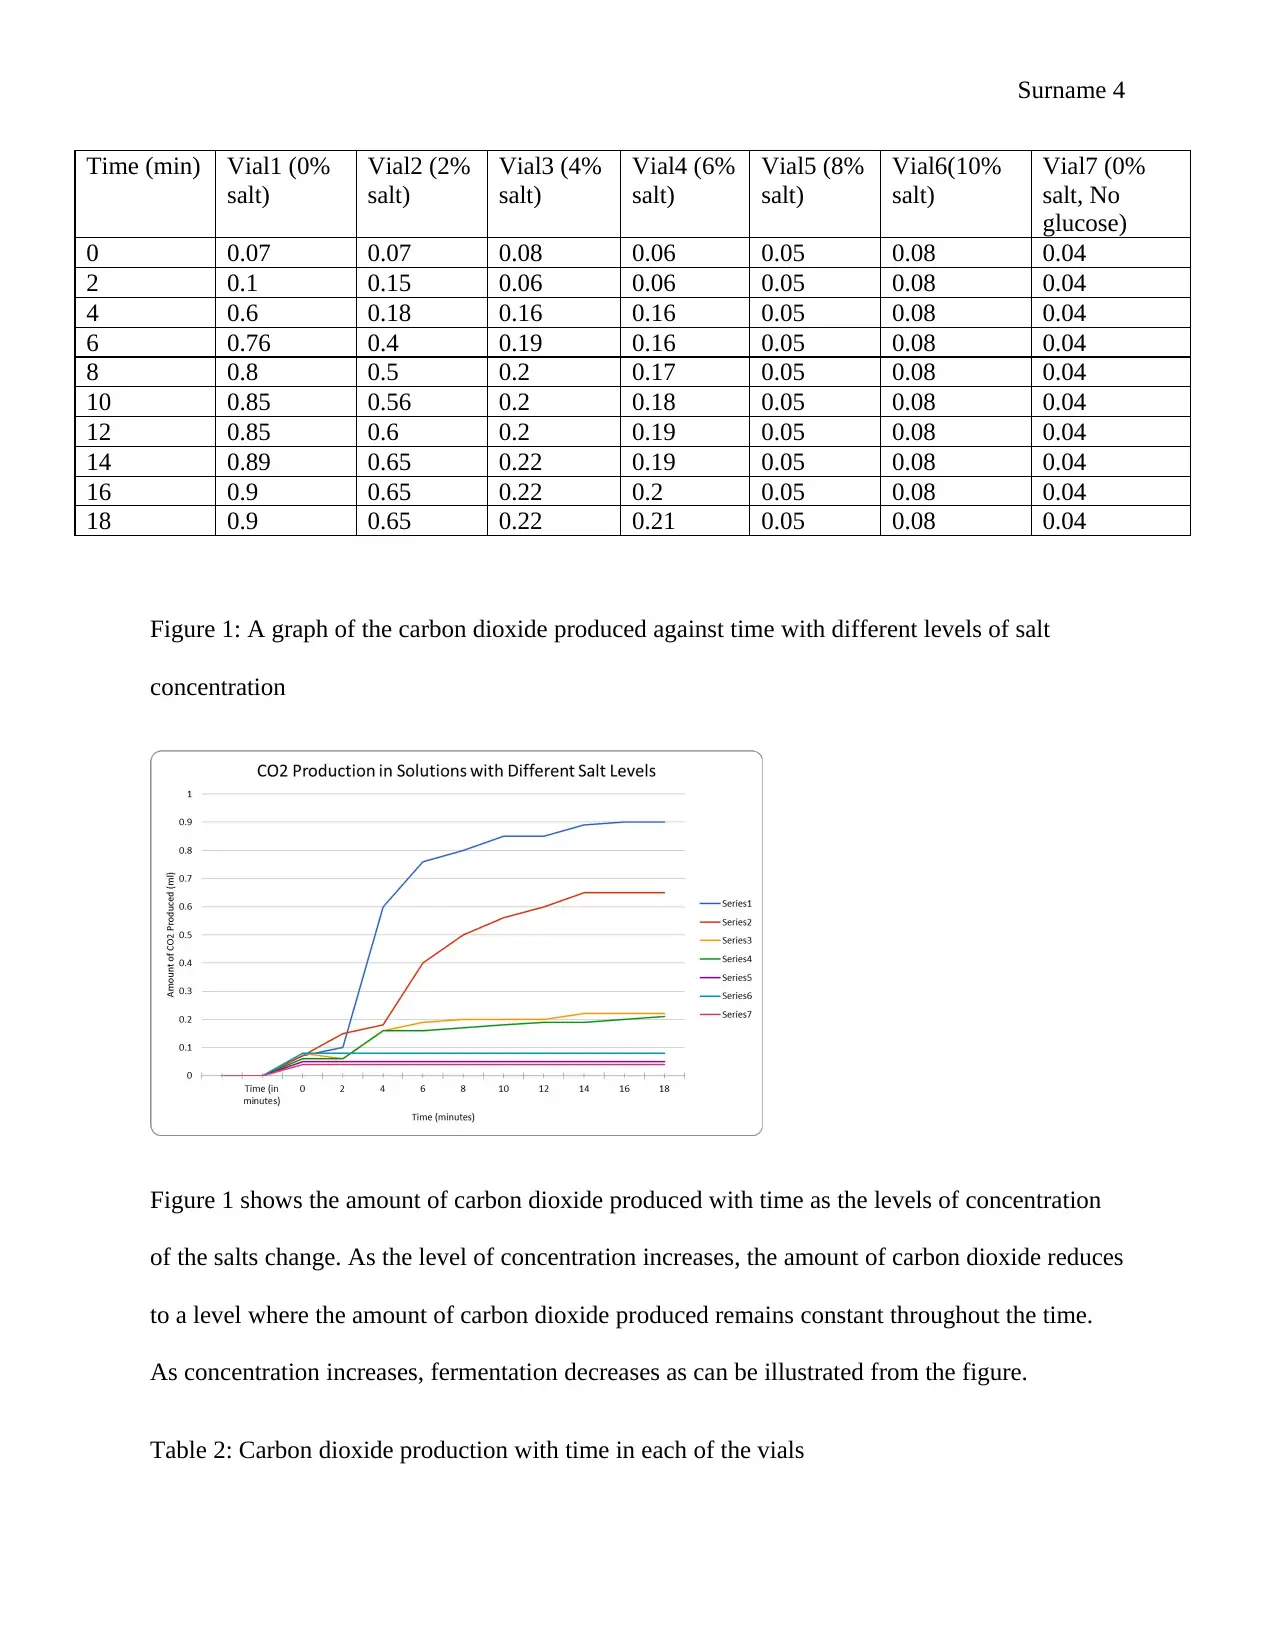
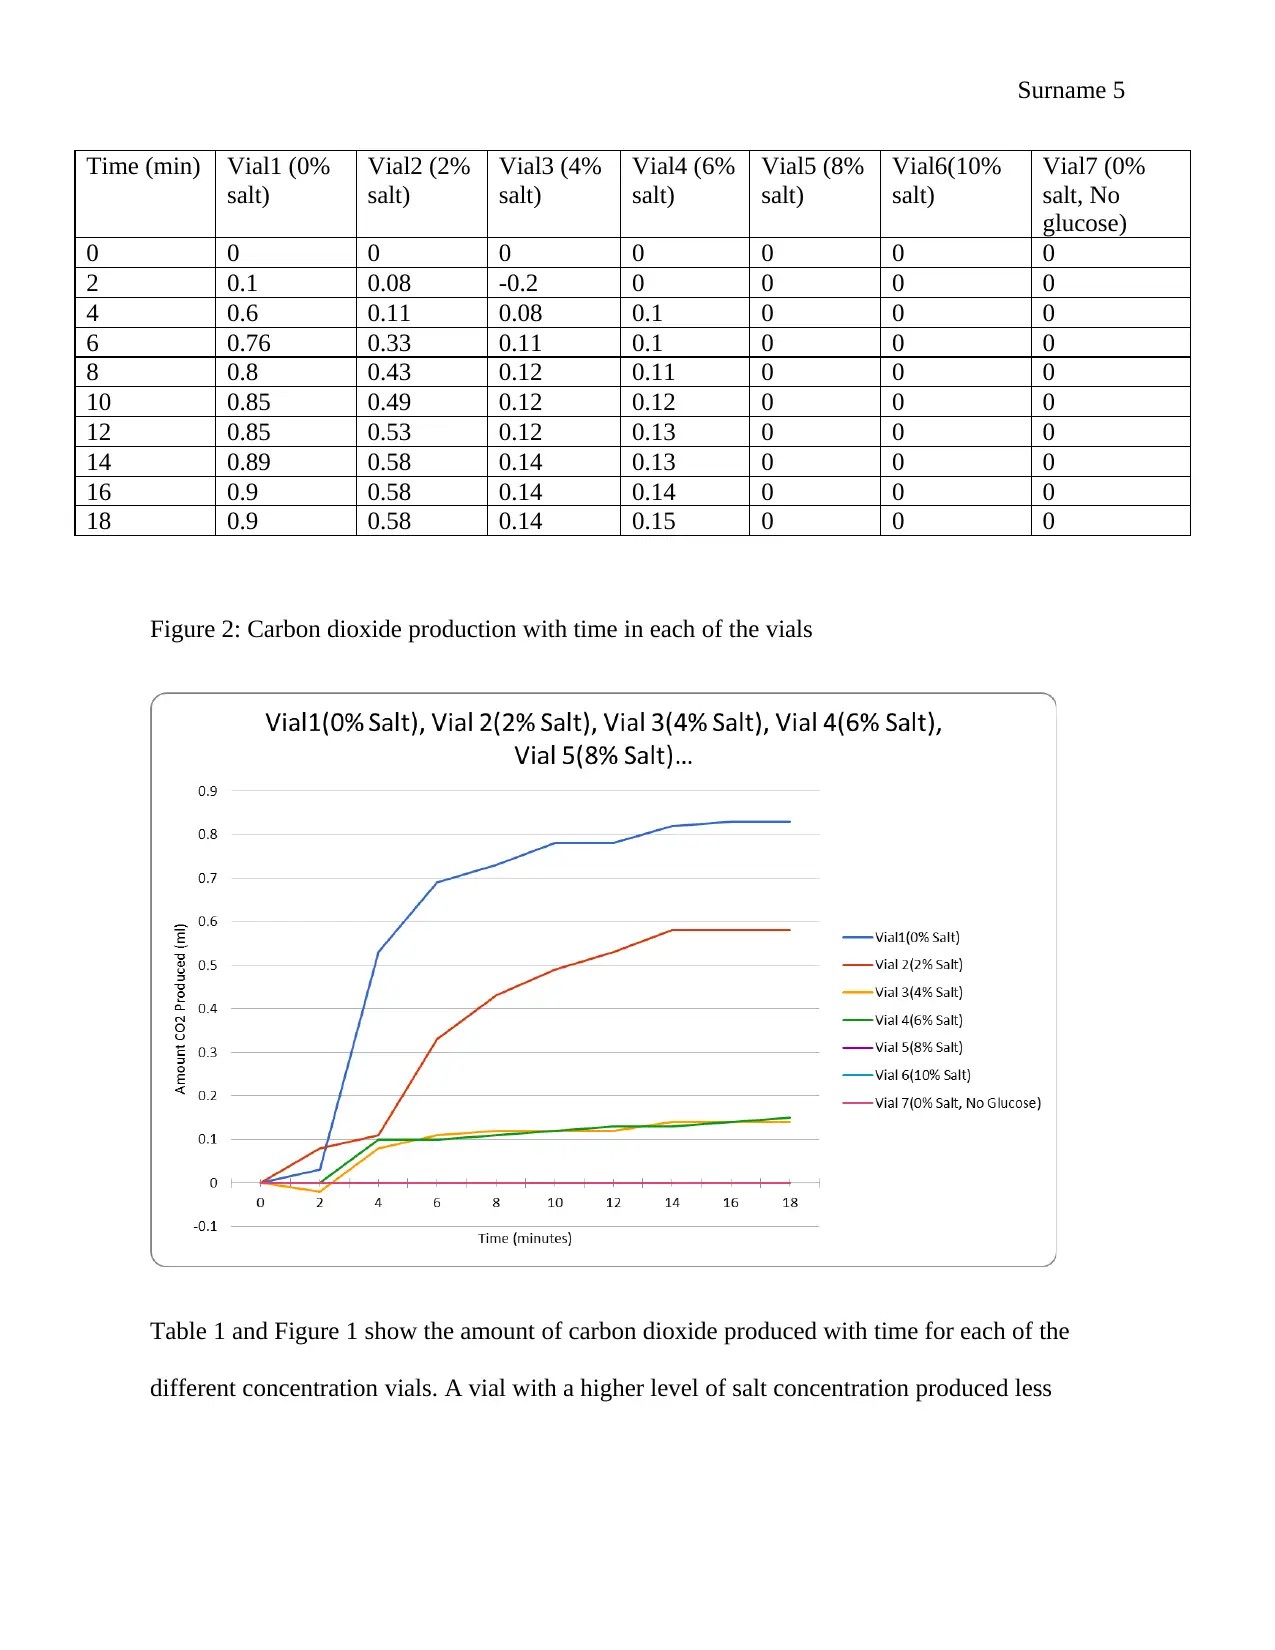
This report investigates the effect of salt concentration on yeast fermentation by measuring carbon dioxide production. The experiment involved varying salt concentrations in yeast solutions and monitoring the amount of carbon dioxide released over time. The results indicated that increasing salt concentration decreases the rate of fermentation, supporting the hypothesis. Higher salt concentrations led to reduced or negligible carbon dioxide production, suggesting that yeast cell function is inhibited at elevated salinity levels. While the experiment provided valuable insights, potential errors such as liquid spillage were noted. The findings contribute to understanding environmental impacts on fermentation and can inform further research on different cell types and fermentation processes. Desklib provides similar solved assignments for students.
tabler-icon-diamond-filled.svg

Contribute Materials

Your contribution can guide someone’s learning journey. Share your documents today.
Document Page
Surname 1
Name:
Institution:
Instructor:
Date:
The Effect of Salt Concentration on Fermentation of Yeast
Abstract
Fermentation occurs in anaerobic organisms in which the main product is carbon dioxide. This
process in itself is not energy generating but instead supports glycolysis, the process that
produces energy. In this experiment, the effect of the level of concentration of salt on the rate of
fermentation was examined. Yeast and salts of different concentrations were used as the
materials in which the amount of carbon dioxide produced within some time at a certain salt
concentration is established. The results obtained indicated that an increase in the concentration
of salt decrease the rate of production of carbon dioxide and hence the rate of fermentation in
yeast. Numerous tests were done hence higher accuracy levels obtained. Spillage of the liquid
was the main source of error that could give significant deviations in the masses and hence less
accurate amount of carbon dioxide measured to be produced.
Introduction
Fermentation is a biological process carried out to enable organisms to release energy without
undergoing cellular respiration. Fermentation occurs in two ways, yeast fermentation and
alcoholic fermentation (Spencer 169). One of the most common products of fermentation of
alcohol is carbon dioxide. Fermentation a process does not release energy but instead allows for
tabler-icon-diamond-filled.svg

Secure Best Marks with AI Grader

Need help grading? Try our AI Grader for instant feedback on your assignments.
Document Page
Surname 2
the continuation of the process of glycolysis which leads to the formation of energy stored in the
form of Adenosine Triphosphate, ATP. Fermentation takes place in the absence of oxygen since
it is possible for cellular respiration to occur besides glycolysis in the presence of oxygen.
Cellular respiration yields a higher amount of oxygen as compared to glycolysis alone (Reed 88).
Important to note is that there are organisms, for example, yeast cultures which undergo
fermentation even in the presence of oxygen.
The production of energy through fermentation in anaerobic organisms has brought about
concerns on the process of production of energy in different living organisms. Environments in
which fermentation process cannot process tend to be harmful to the cells and to the organisms
as a whole which respire in the absence of oxygen (Boulton 239). In a bid to understanding and
evaluate the impacts of different environments on fermentation, salt was introduced during the
process of fermentation. At varying levels of concentration of salts, fermentation of yeast was
allowed to process to find out what impact the level of a salt concentration had on fermentation.
The rate of fermentation was established through the evaluation of the amount of carbon dioxide
produced after fermentation of the yeast solutions (Mehta 116). The volume of carbon dioxide
produced was determined by measuring the mass of the yeast before and after fermentation.
Hypothesis
An increase in the concentration of salt decreases the rate of fermentation in yeast cells.
Materials and Methods
A 20% salt solution was prepared using sodium chloride and 20mL of glucose solution in a
beaker. 2 ml of the solution composed of both glucose and the salt was added to 7 test tubes
labeled to distinguish the time interval and trial. Each of the tube used had a small hole created at
Document Page
Surname 3
the top to permit the escape of the gas formed. 2 mL of yeast solution was then poured into each
of the 7 test tubes creating 5% salinity within the test tube (Harrigan 177). The weight of each of
the tube was taken immediately yeast was added. The tubes were transferred to a floating rack
where they were placed upside down and the rack immersed in water whose temperature is 40C.
The tubes were flipped right side up, and their weight measured.
The procedure was repeated for the remaining 5 tubes, this time not removing the tubes from the
water immediately. One tube was removed after every 5 minutes for twenty minutes and the
measurement of the mass taken. All the supplies and the apparatus were cleaned and dried. The
whole experiment was done four times more, once adding 4% sodium chloride solution to each
of the seven test tube bringing a slat total percentage to 16% after the addition of the yeast
solution, once adding 4% sodium chloride solution to each of the seven test tube bringing a slat
total percentage to 12% after the addition of the yeast solution (Evranuz 189).
It was continued, once adding 4% sodium chloride solution to each of the seven test tube
bringing a slat total percentage to 8% after the addition of the yeast solution, once adding 4%
sodium chloride solution to each of the seven test tube bringing a slat total percentage to 4%
after the addition of the yeast solution and once adding 4% sodium chloride solution to each of
the seven test tube bringing a slat total percentage to 0% after the addition of the yeast solution.
The data for the 0% salt concentration was collected on a different day by the laboratory
technician who provided it for use in the experiment. All the masses were taken note of
throughout the experiment (VanLancker 156).
Results
Table 1: Carbon dioxide production at different salt concentrations
Document Page
Surname 4
Time (min) Vial1 (0%
salt)
Vial2 (2%
salt)
Vial3 (4%
salt)
Vial4 (6%
salt)
Vial5 (8%
salt)
Vial6(10%
salt)
Vial7 (0%
salt, No
glucose)
0 0.07 0.07 0.08 0.06 0.05 0.08 0.04
2 0.1 0.15 0.06 0.06 0.05 0.08 0.04
4 0.6 0.18 0.16 0.16 0.05 0.08 0.04
6 0.76 0.4 0.19 0.16 0.05 0.08 0.04
8 0.8 0.5 0.2 0.17 0.05 0.08 0.04
10 0.85 0.56 0.2 0.18 0.05 0.08 0.04
12 0.85 0.6 0.2 0.19 0.05 0.08 0.04
14 0.89 0.65 0.22 0.19 0.05 0.08 0.04
16 0.9 0.65 0.22 0.2 0.05 0.08 0.04
18 0.9 0.65 0.22 0.21 0.05 0.08 0.04
Figure 1: A graph of the carbon dioxide produced against time with different levels of salt
concentration
Figure 1 shows the amount of carbon dioxide produced with time as the levels of concentration
of the salts change. As the level of concentration increases, the amount of carbon dioxide reduces
to a level where the amount of carbon dioxide produced remains constant throughout the time.
As concentration increases, fermentation decreases as can be illustrated from the figure.
Table 2: Carbon dioxide production with time in each of the vials
tabler-icon-diamond-filled.svg

Secure Best Marks with AI Grader

Need help grading? Try our AI Grader for instant feedback on your assignments.
Document Page
Surname 5
Time (min) Vial1 (0%
salt)
Vial2 (2%
salt)
Vial3 (4%
salt)
Vial4 (6%
salt)
Vial5 (8%
salt)
Vial6(10%
salt)
Vial7 (0%
salt, No
glucose)
0 0 0 0 0 0 0 0
2 0.1 0.08 -0.2 0 0 0 0
4 0.6 0.11 0.08 0.1 0 0 0
6 0.76 0.33 0.11 0.1 0 0 0
8 0.8 0.43 0.12 0.11 0 0 0
10 0.85 0.49 0.12 0.12 0 0 0
12 0.85 0.53 0.12 0.13 0 0 0
14 0.89 0.58 0.14 0.13 0 0 0
16 0.9 0.58 0.14 0.14 0 0 0
18 0.9 0.58 0.14 0.15 0 0 0
Figure 2: Carbon dioxide production with time in each of the vials
Table 1 and Figure 1 show the amount of carbon dioxide produced with time for each of the
different concentration vials. A vial with a higher level of salt concentration produced less
Document Page
Surname 6
carbon dioxide in comparison with one whose level of concentration is lower. As concentration
increases, fermentation decreases as can be illustrated by the figure and the table.
Discussion
Upon assessment under 7 levels of concentration of salts, 0%, 2%, 4%, 6%, 8%, 10% and 0% no
glucose, it was observed that yeast experiences the highest rate of fermentation under the lowest
concentrations of salts. The findings and data of this research are supportive of the hypothesis
statement that an increase in the level of salt concentration decreases the rate of fermentation of
yeast cells (Evranuz 222). As the last three concentrations of salts indicated the same amount of
carbon dioxide generated which was zero. This illustrates that at such levels of salt
concentrations, the yeast cells are non-functional. The cells have been dehydrated due to the high
solute concentration to death, and thus no fermentation takes place.
The number of tests done for this experiment was to a greater extent its strength. The experiment
includes relatively a range of conditions tested hence increasing the level of accuracy of the
experiment. By testing a greater level of concentration of the salt, it is possible to estimate to
greater levels of accuracy the impacts of salt concentration on the rate of fermentation. This
makes the results very significant (VanLancker 332). A source of error in the experiment is the
spillage of the liquid that was within the tubes through the holes made at the top to provide an
escape for carbon dioxide. The escaping fluid resulted in significant reduction in the masses of
the fluids which likely meant more carbon dioxide produced, despite this not being the case.
The results obtained from the experiments are a true reflection of the impacts of the
concentration of salts on fermentation of yeast. However, the results do not rule out obtaining
different results if the experiment was done using other different cell types for example
Document Page
Surname 7
fermentation of lactic acid (Engineers 116). Analysis of the findings of this experiment is a
fundamental aspect of further research.
Works Cited
Boulton, Christopher. Brewing Yeast and Fermentation. New York: John Wiley & Sons, 2013.
tabler-icon-diamond-filled.svg

Paraphrase This Document

Need a fresh take? Get an instant paraphrase of this document with our AI Paraphraser
Document Page
Surname 8
Engineers, NPCS Board of Consultants &. Handbook on Fermented Foods and Chemicals.
Manchester: ASIA PACIFIC BUSINESS PRESS Inc., 2011.
Evranuz, Özgül. Handbook of Plant-Based Fermented Food and Beverage Technology, Second
Edition. Beijing: CRC Press, 2012.
Harrigan, W. F. Laboratory Methods in Microbiology. Kansas: Elsevier Science, 2014.
Mehta, Bhavbhuti M. Fermentation: Effects on Food Properties. Sydney: CRC Press, 2012.
Metz, Thomas O. Metabolic Profiling: Methods and Protocols. London: Humana Press, 2012.
Reed, Gerald. Yeast technology. Chicago: Springer Science & Business Media, 2012.
Spencer, John F.T. Yeasts in Natural and Artificial Habitats. London: Springer Science &
Business Media, 2013.
VanLancker, J.L. Molecules, Cells, and Disease: An Introduction to the Biology of Disease. New
York: Springer Science & Business Media, 2012.
chevron_up_icon
1 out of 8
circle_padding
hide_on_mobile
zoom_out_icon
logo.png

Your All-in-One AI-Powered Toolkit for Academic Success.

Available 24*7 on WhatsApp / Email

[object Object]