EGR 100 Take-Home Exam: Analyzing Thermistor Resistance & Temperature
VerifiedAdded on 2023/06/03
|9
|1431
|220
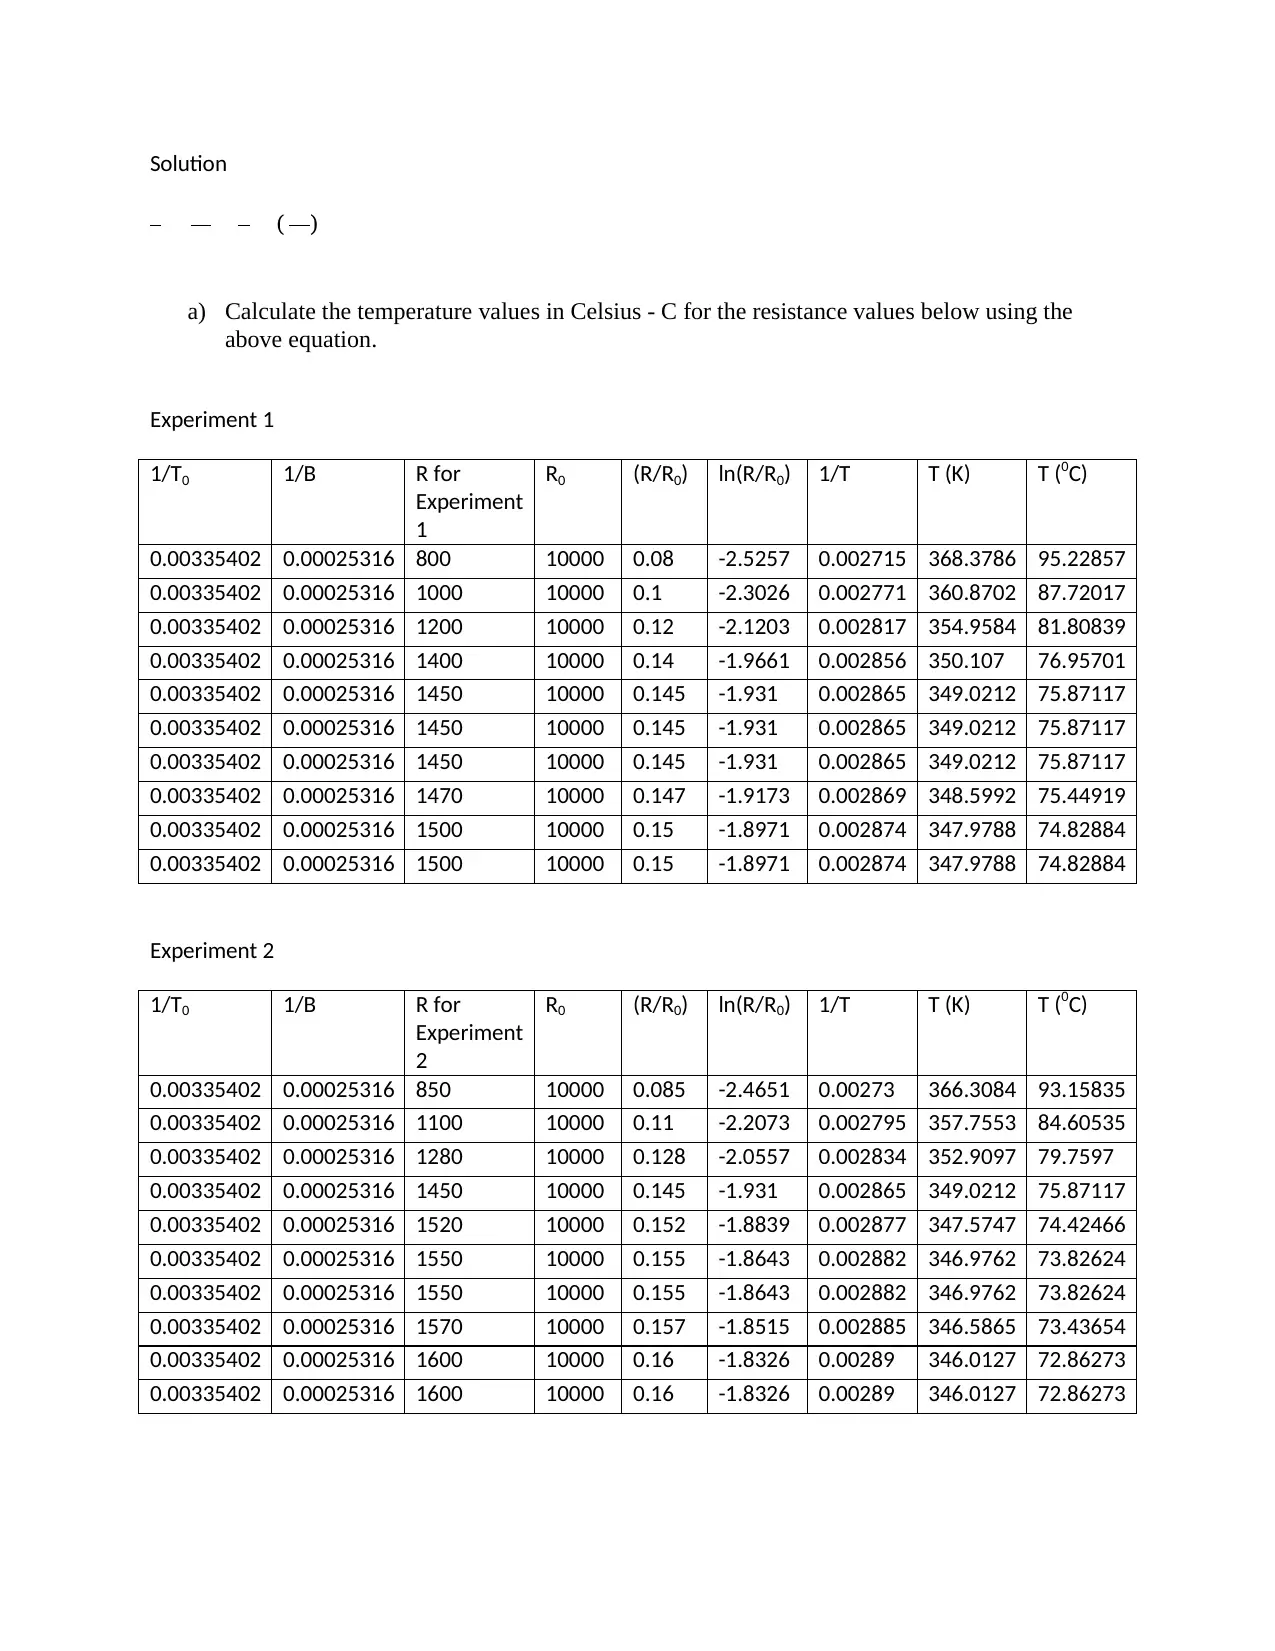
Homework Assignment
AI Summary
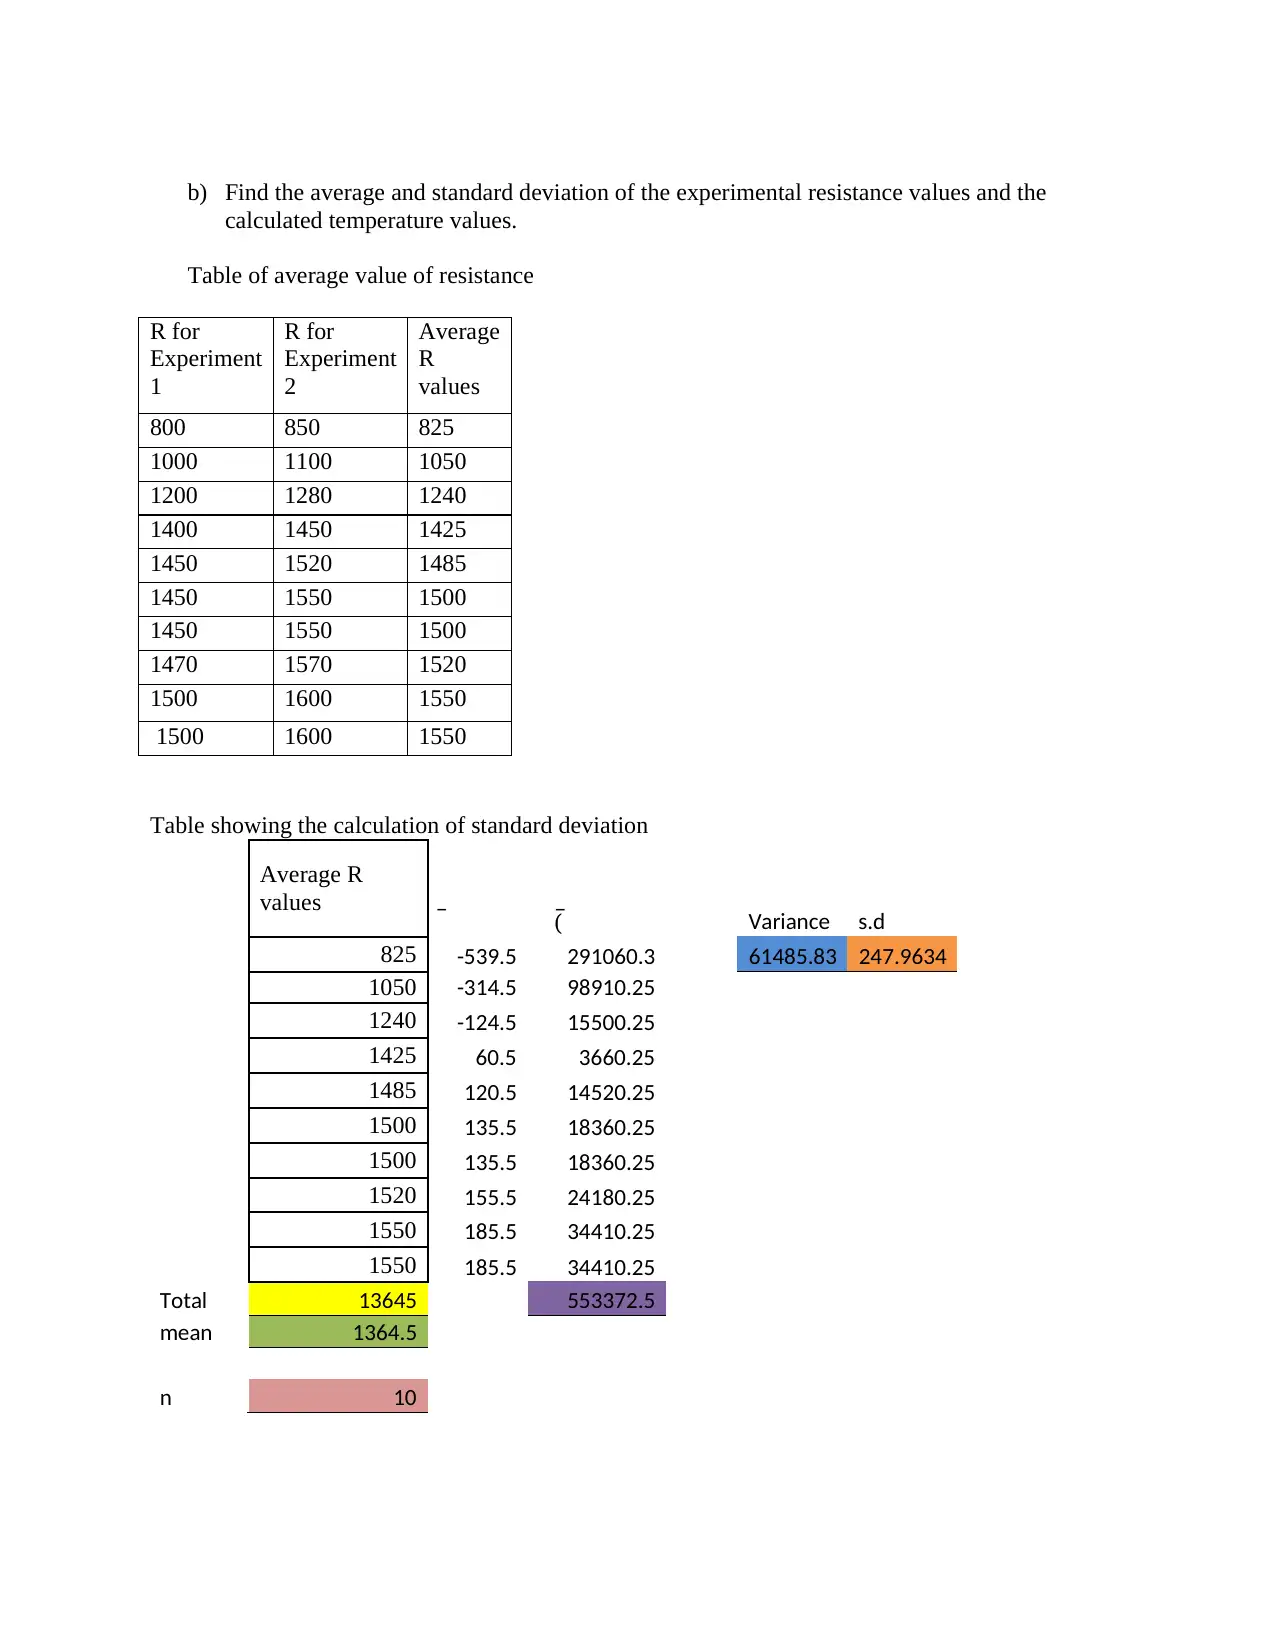
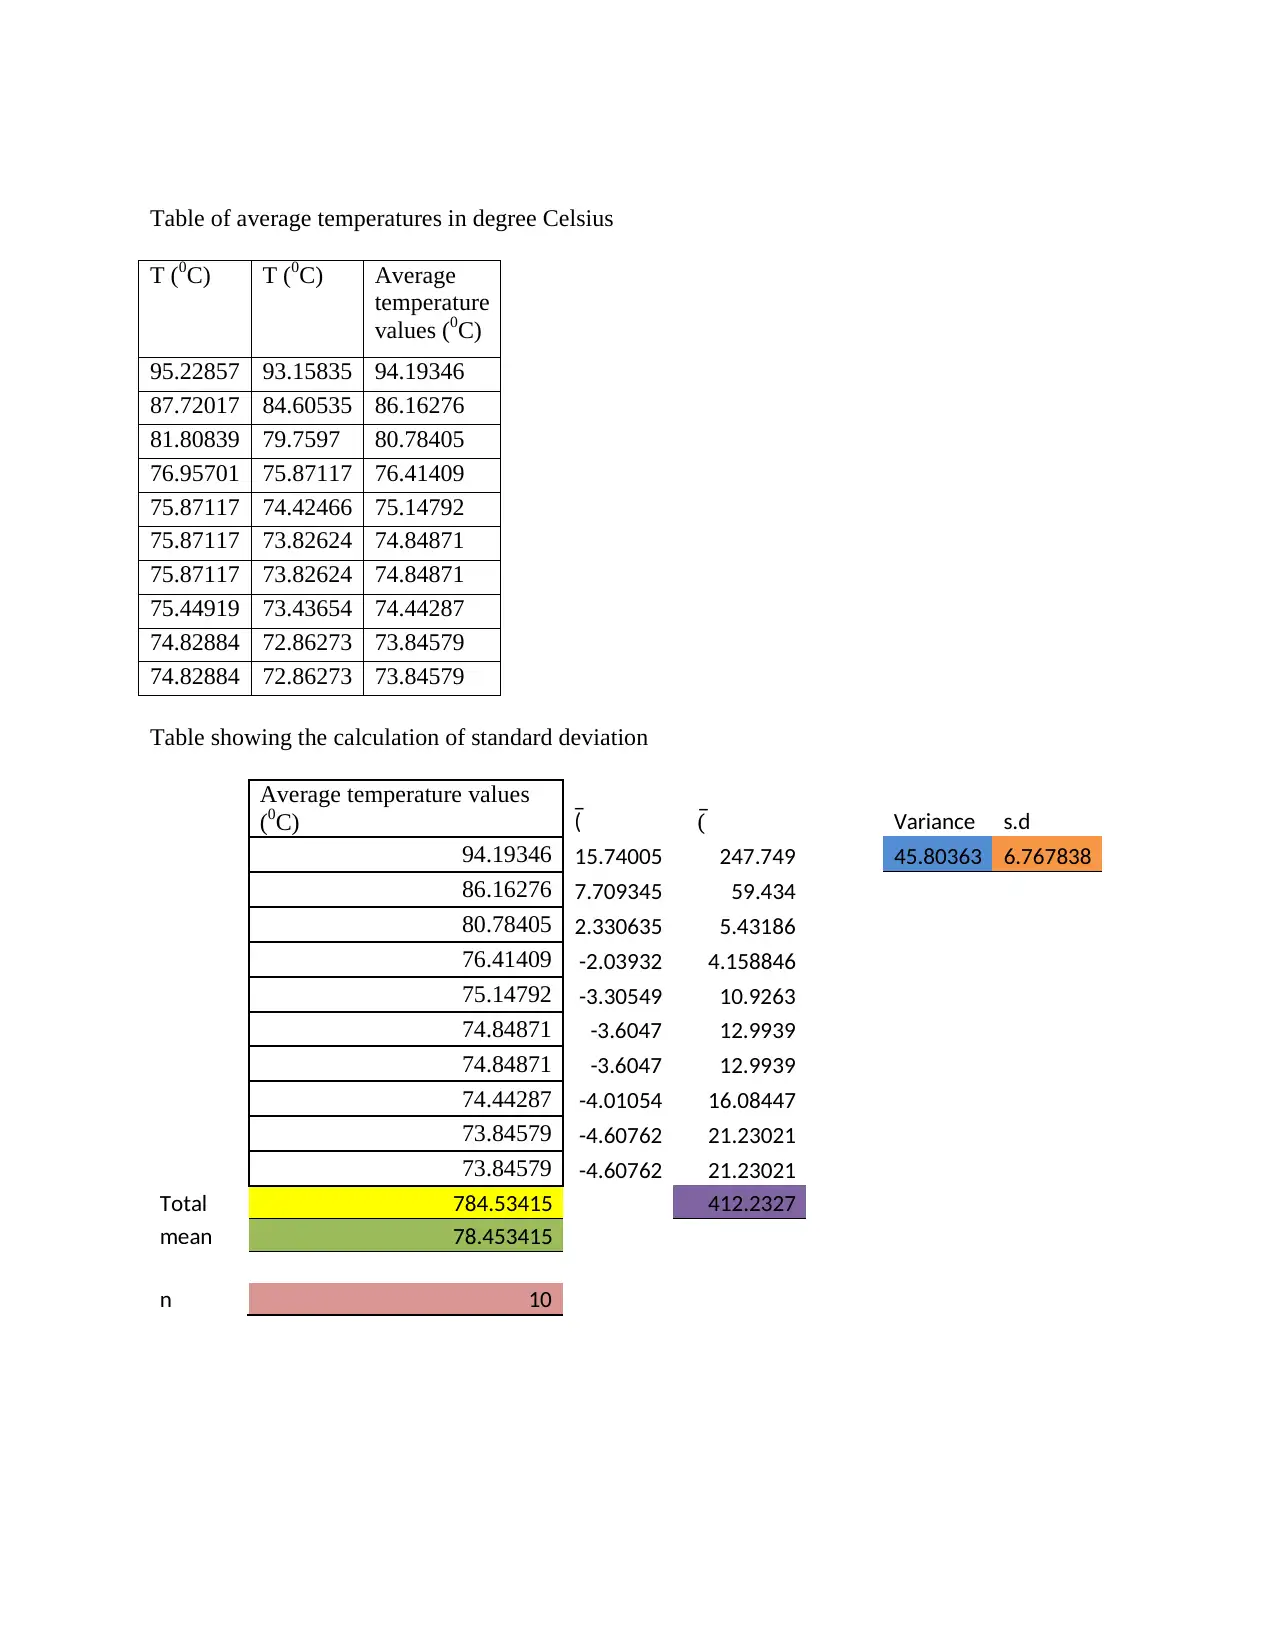
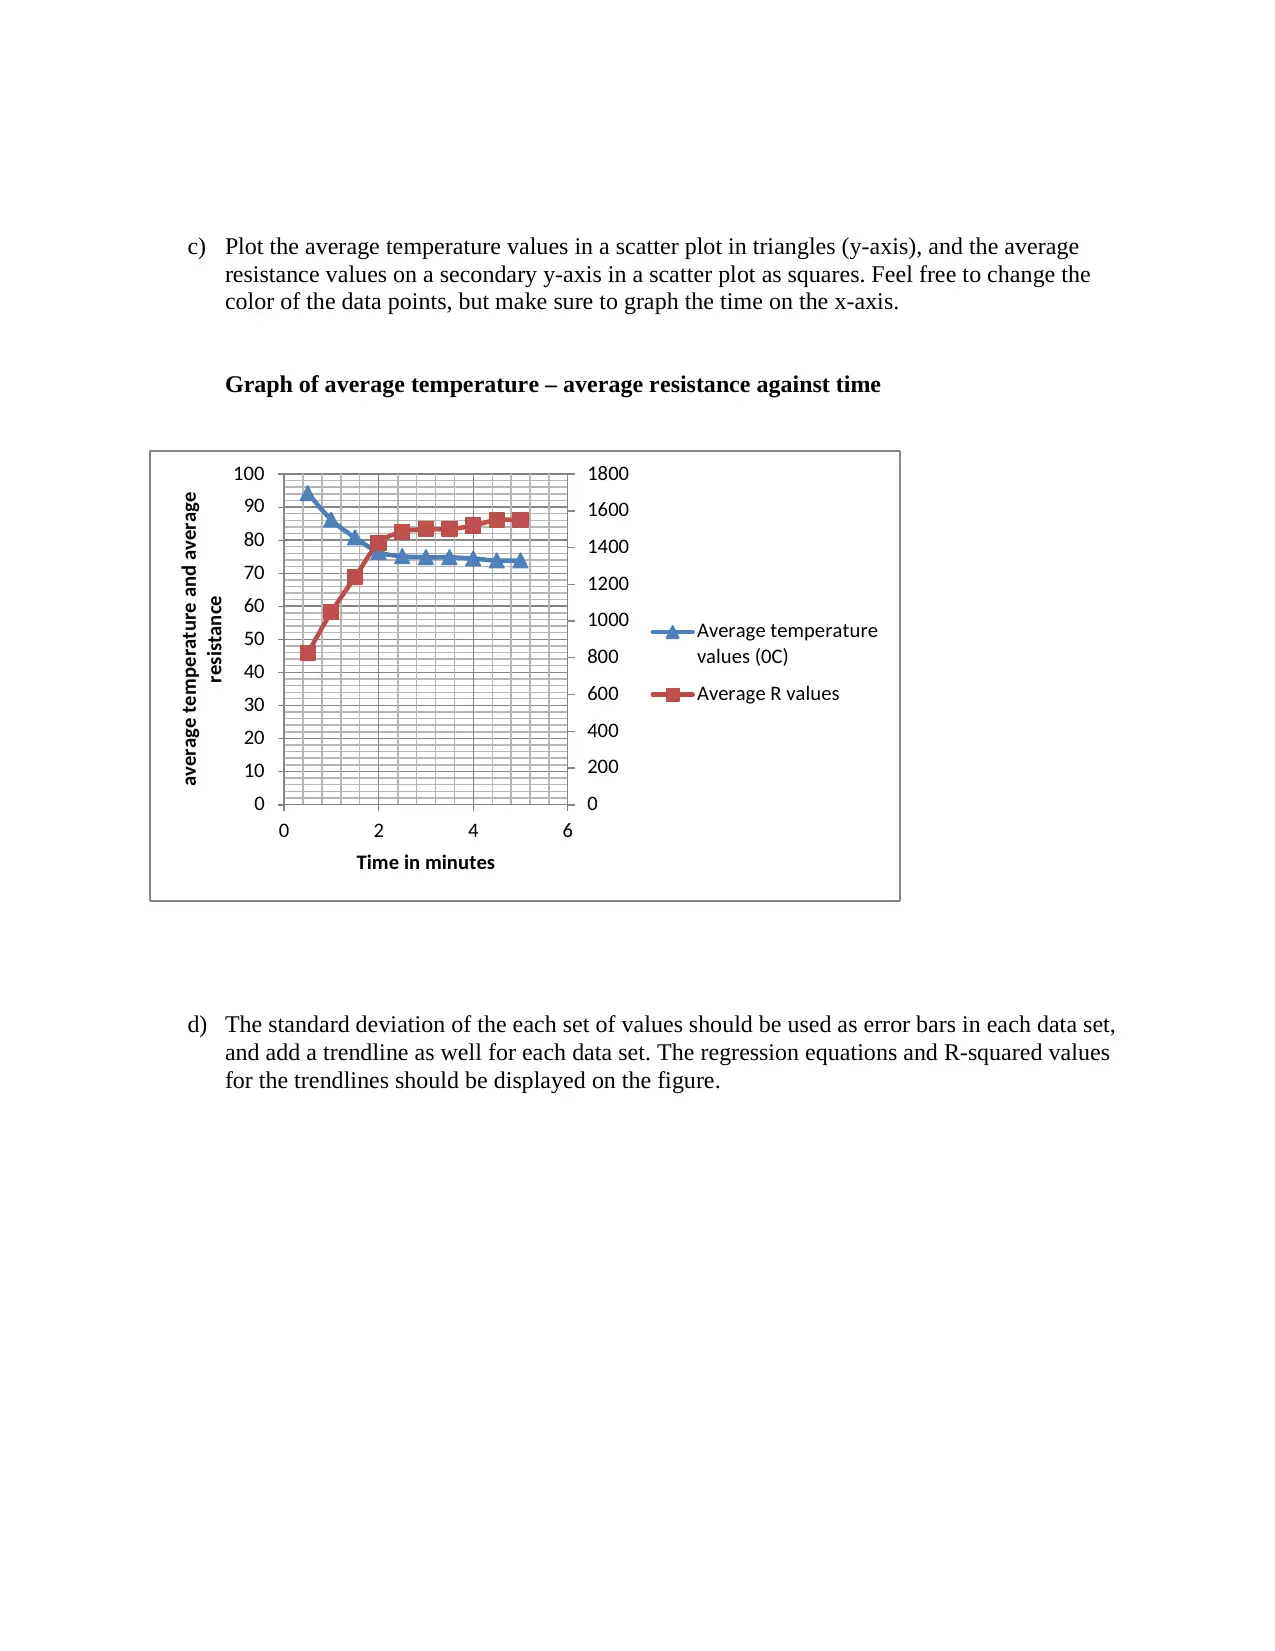
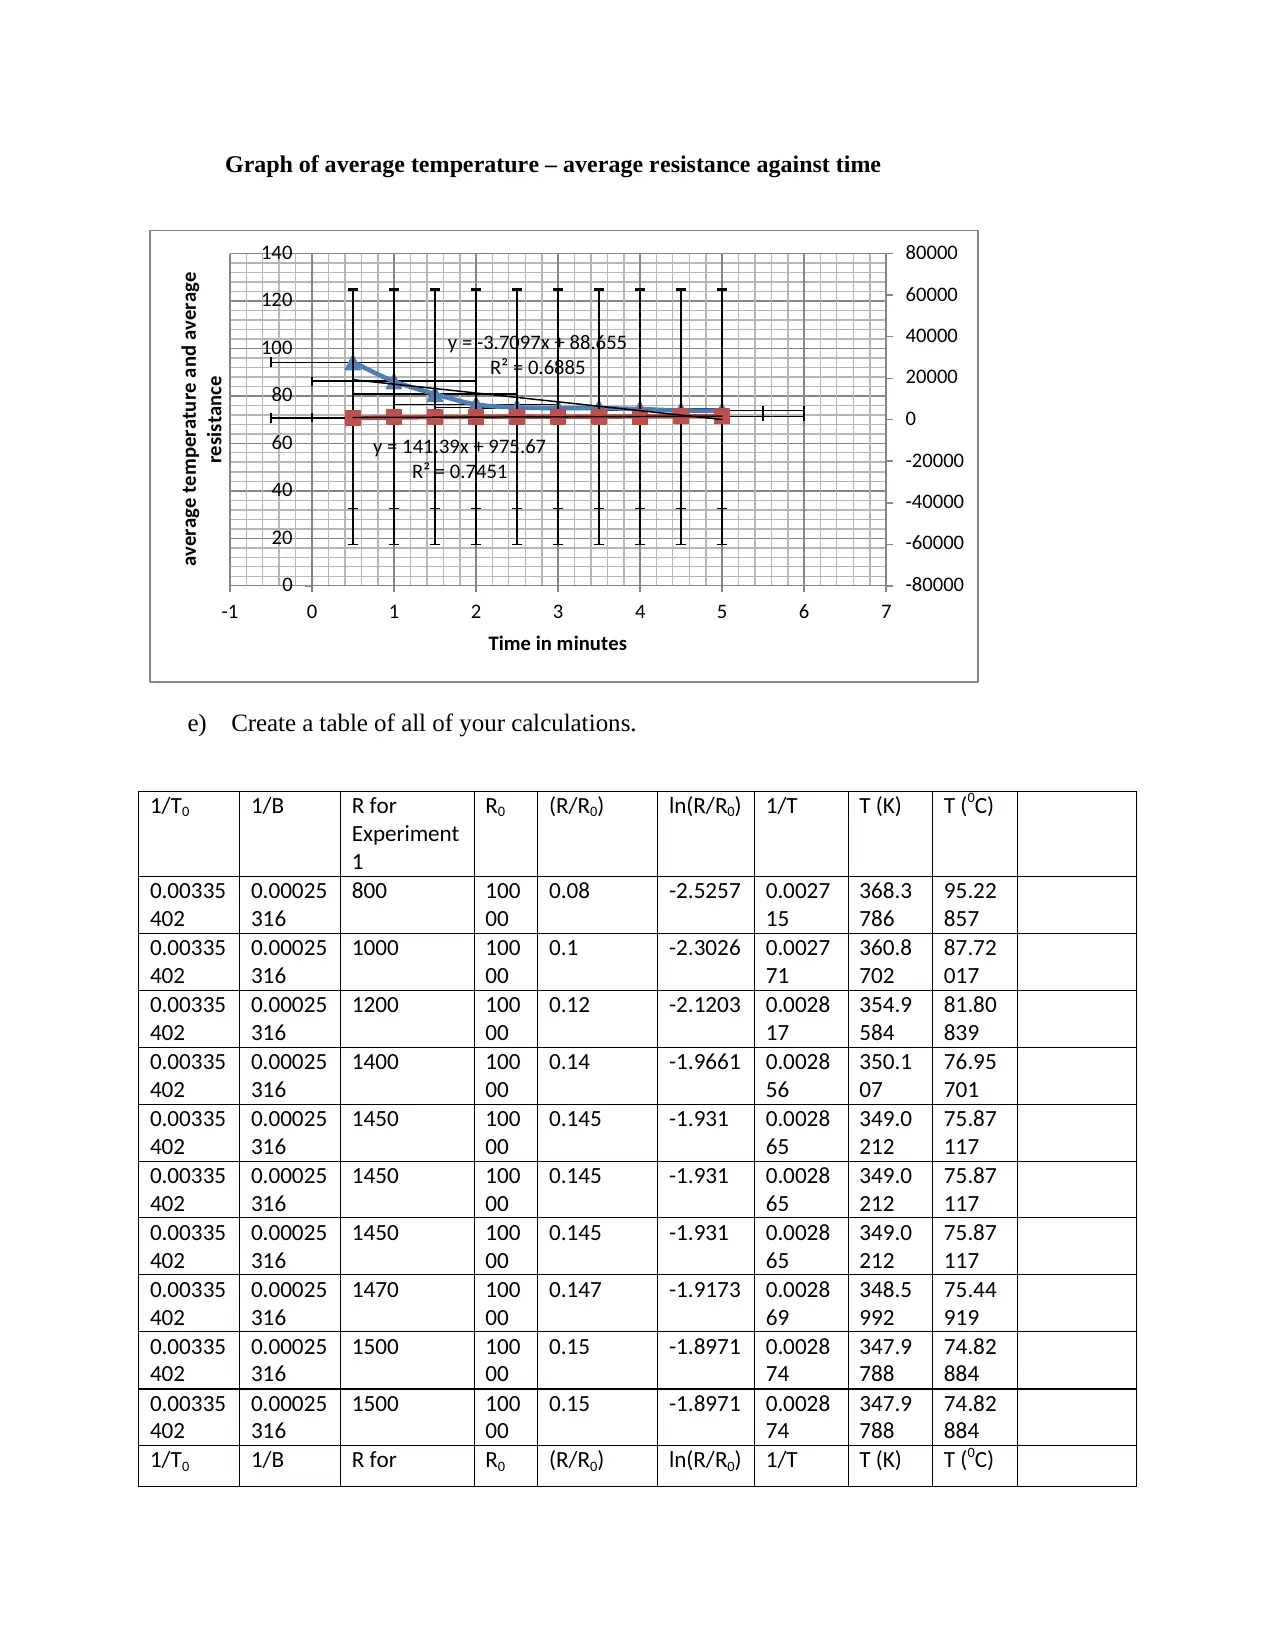
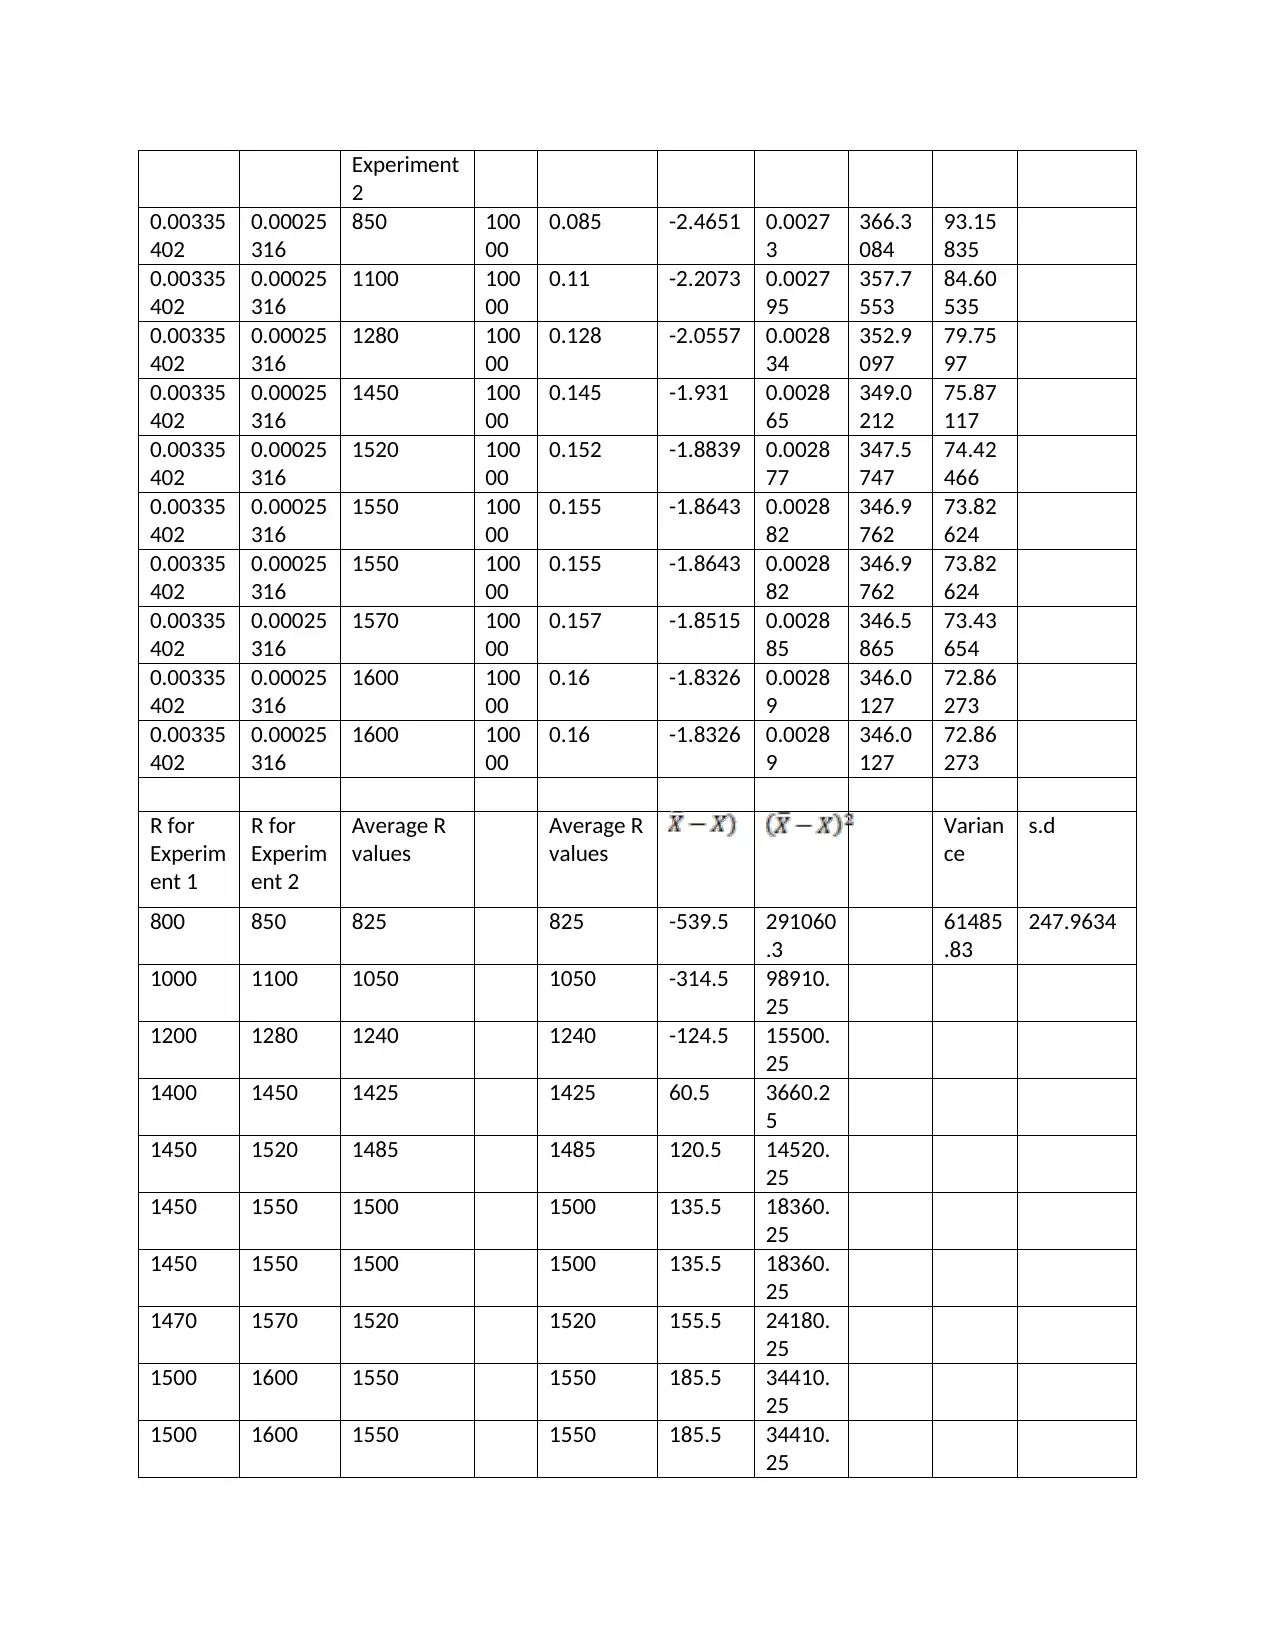
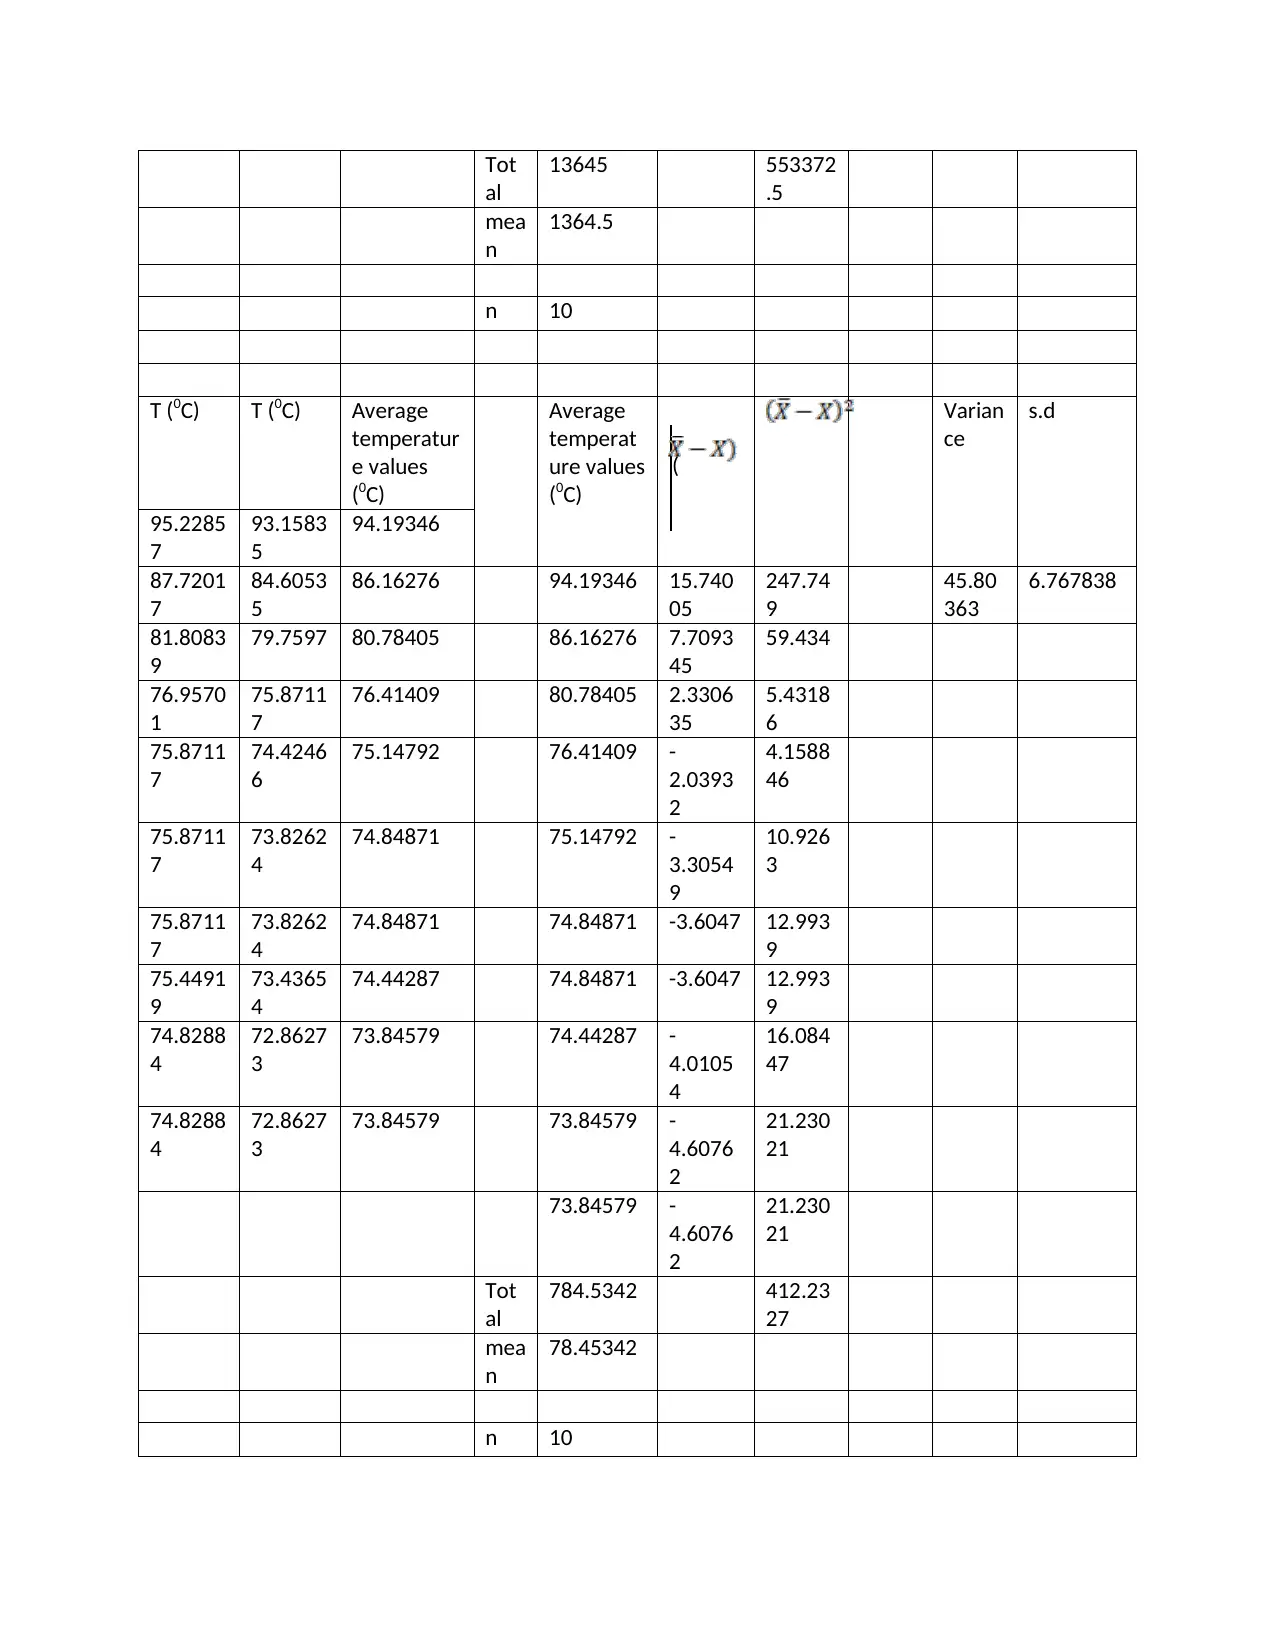
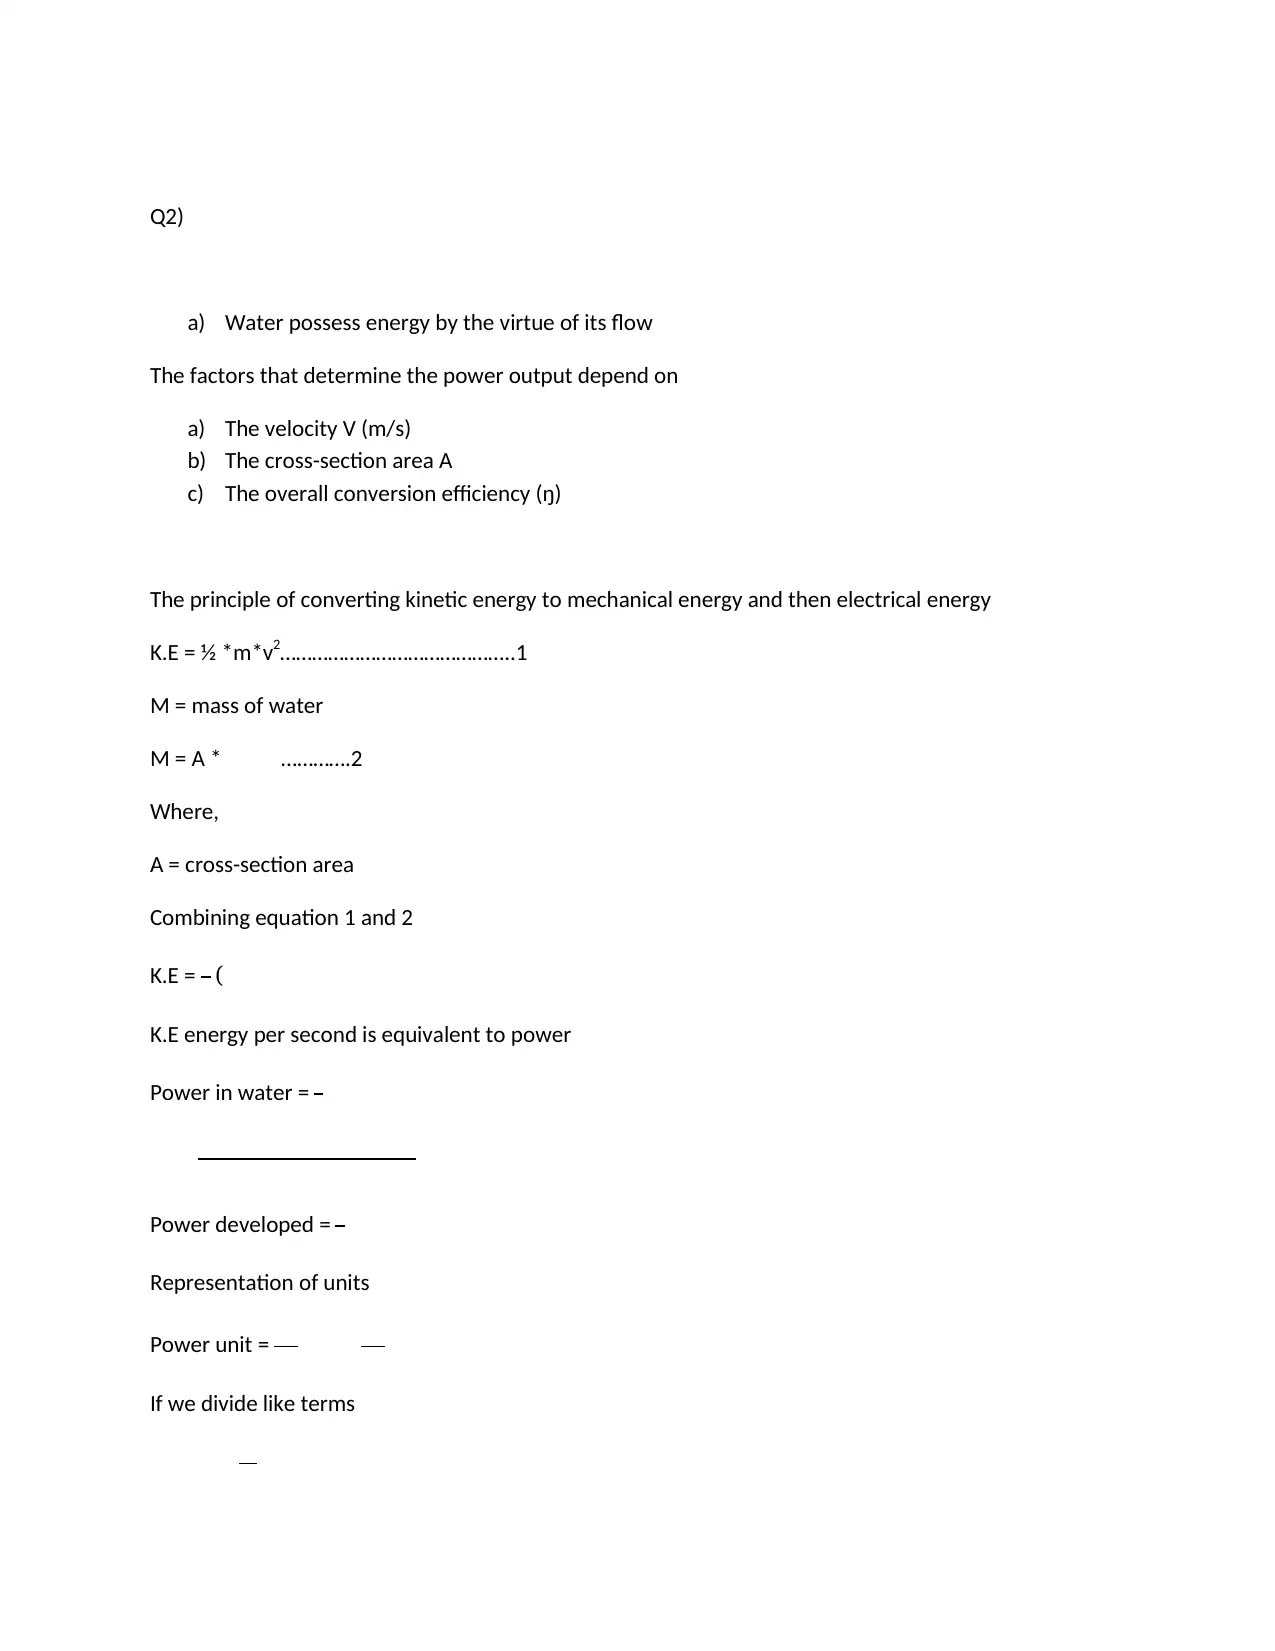
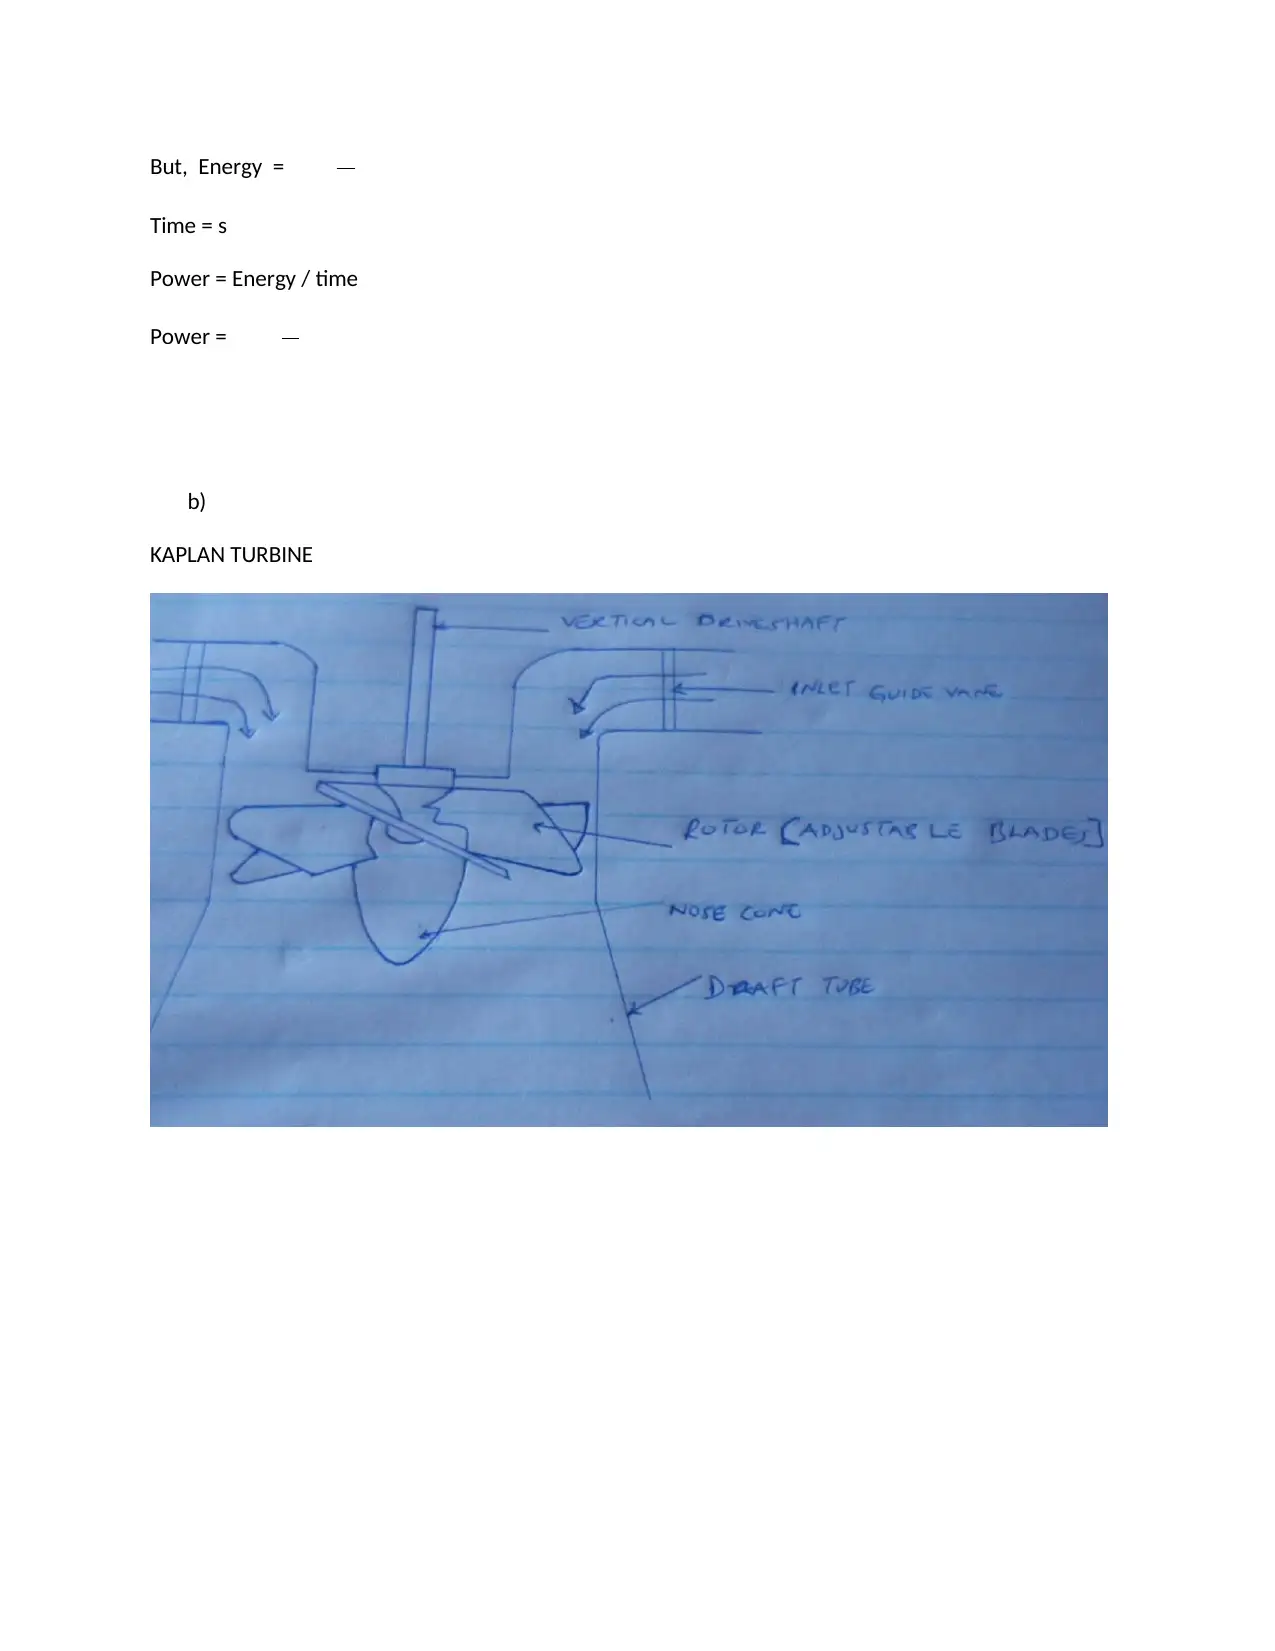
This assignment solution focuses on analyzing the relationship between resistance and temperature in a thermistor, as part of an EGR 100 Introduction to Engineering Design course. The solution includes calculating temperature values in Celsius for given resistance values using a specific equation, finding the average and standard deviation of experimental resistance and temperature values, and creating scatter plots to visualize the relationship between average temperature and resistance over time. Error bars representing standard deviation are added to the data sets, along with trendlines, regression equations, and R-squared values. The calculations are presented in tables, and the analysis extends to discussing the factors determining the power output of water flow, including velocity, cross-section area, and conversion efficiency, along with a brief overview of Kaplan turbines. This document is available on Desklib, a platform offering a wide range of study resources and solved assignments for students.
1 out of 9
Your All-in-One AI-Powered Toolkit for Academic Success.
+13062052269
info@desklib.com
Available 24*7 on WhatsApp / Email
![[object Object]](/_next/static/media/star-bottom.7253800d.svg)
Copyright © 2020–2025 A2Z Services. All Rights Reserved. Developed and managed by ZUCOL.