Implementation of an EIS for the CEO in Aklan: Project Report
VerifiedAdded on 2022/09/09
|11
|1580
|10
Project
AI Summary
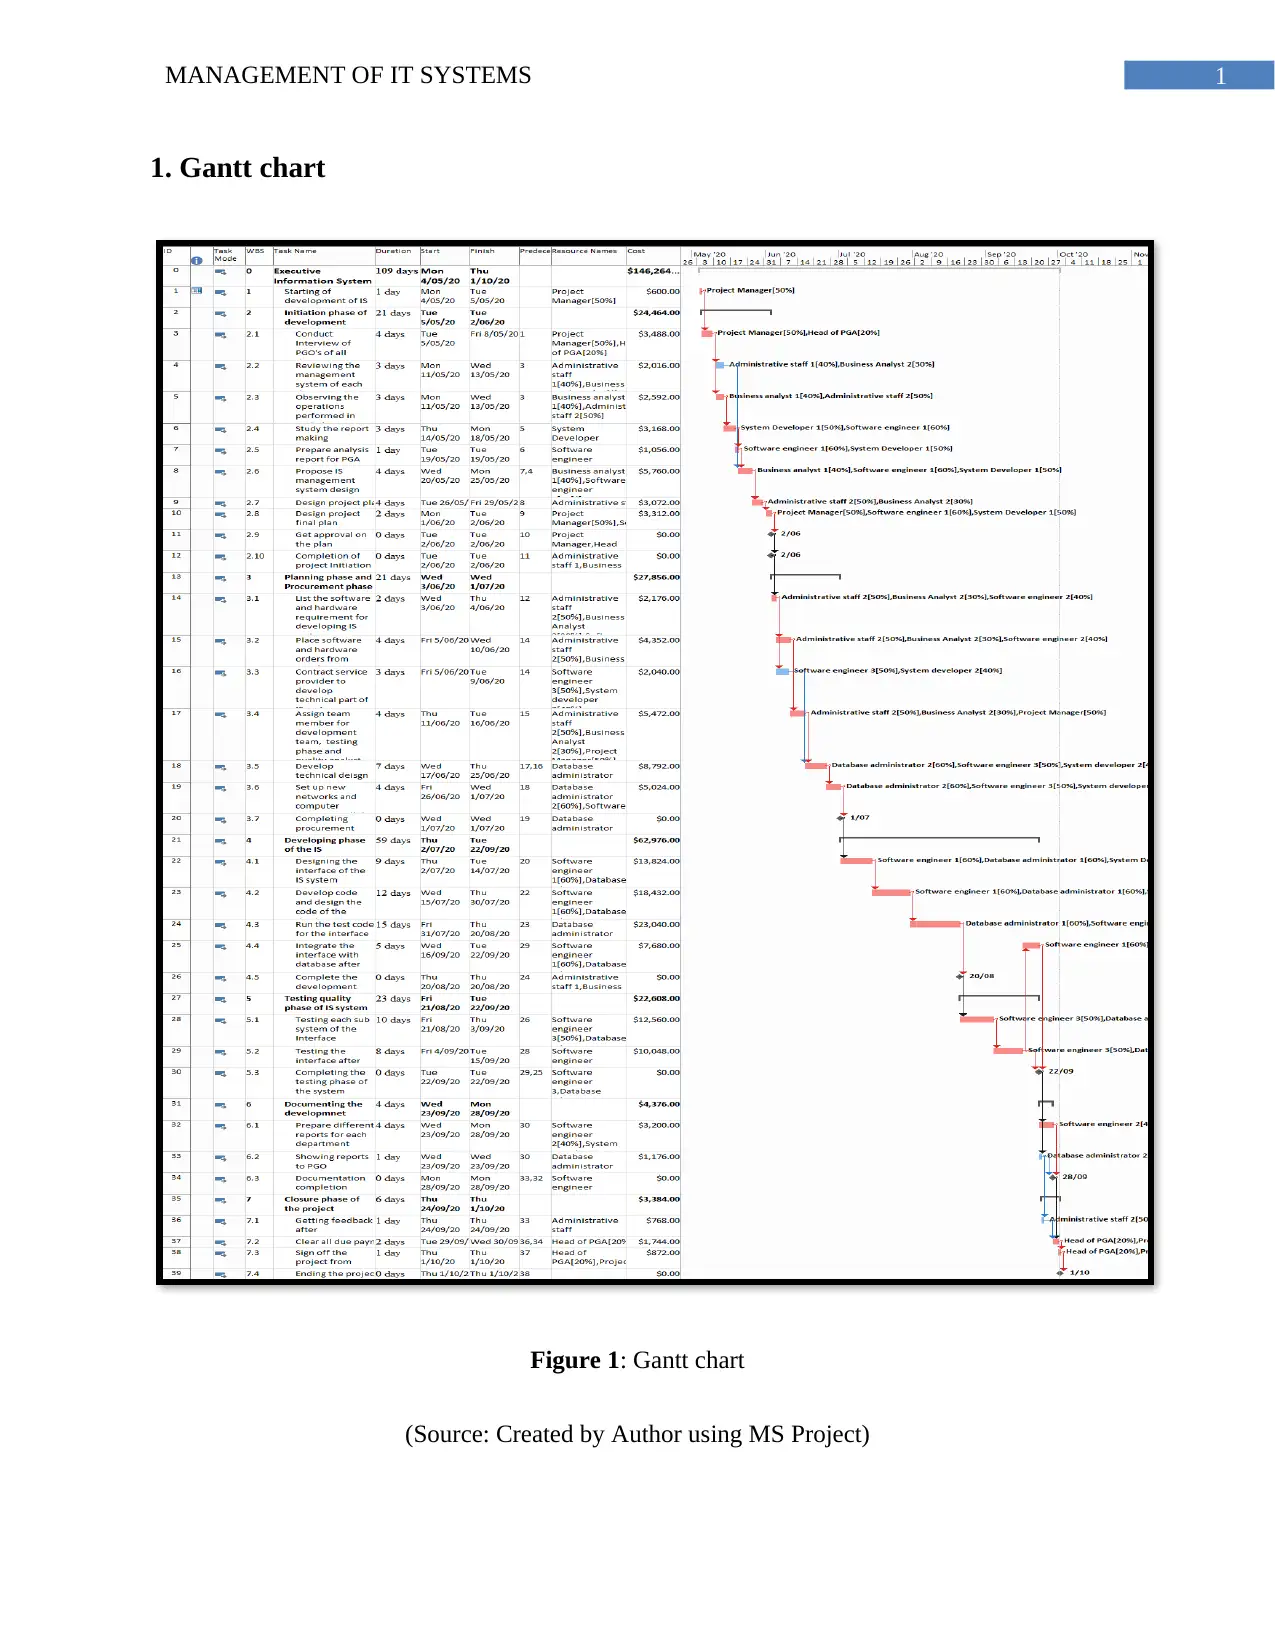
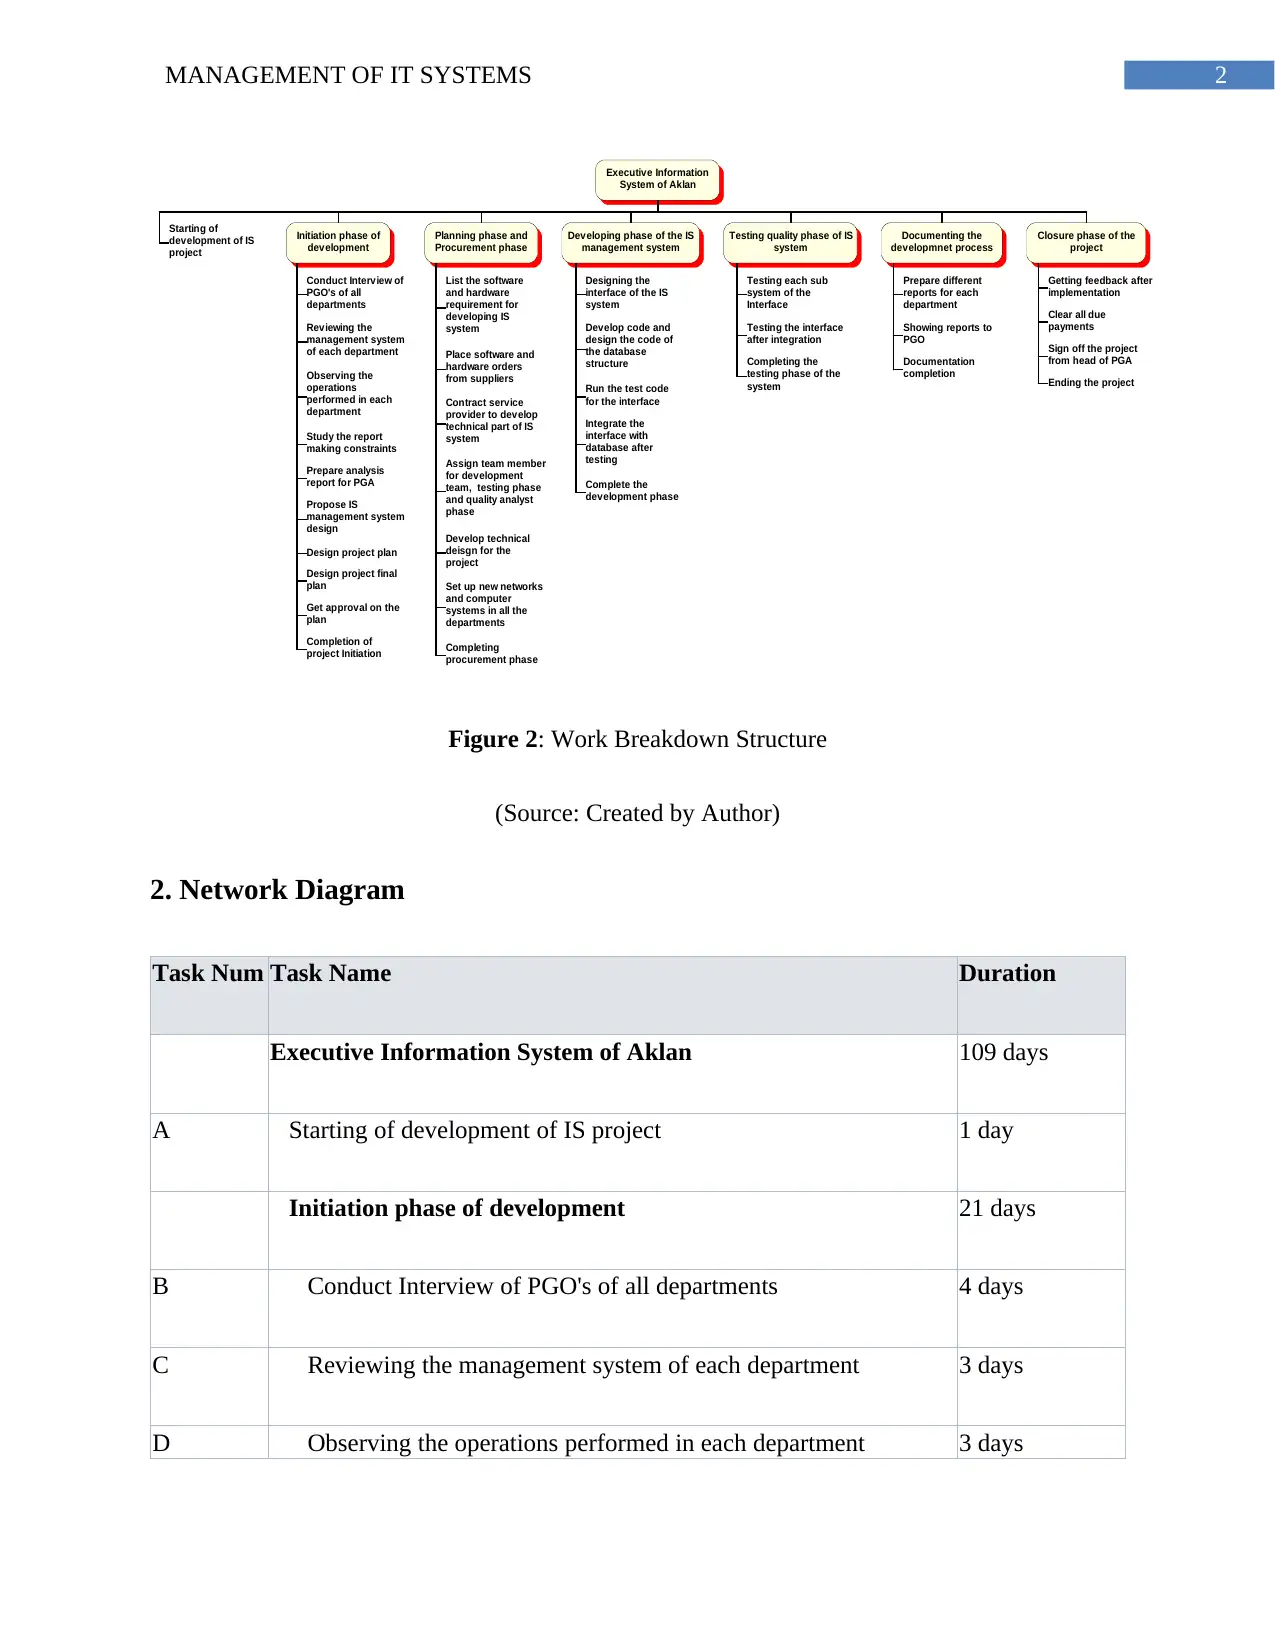
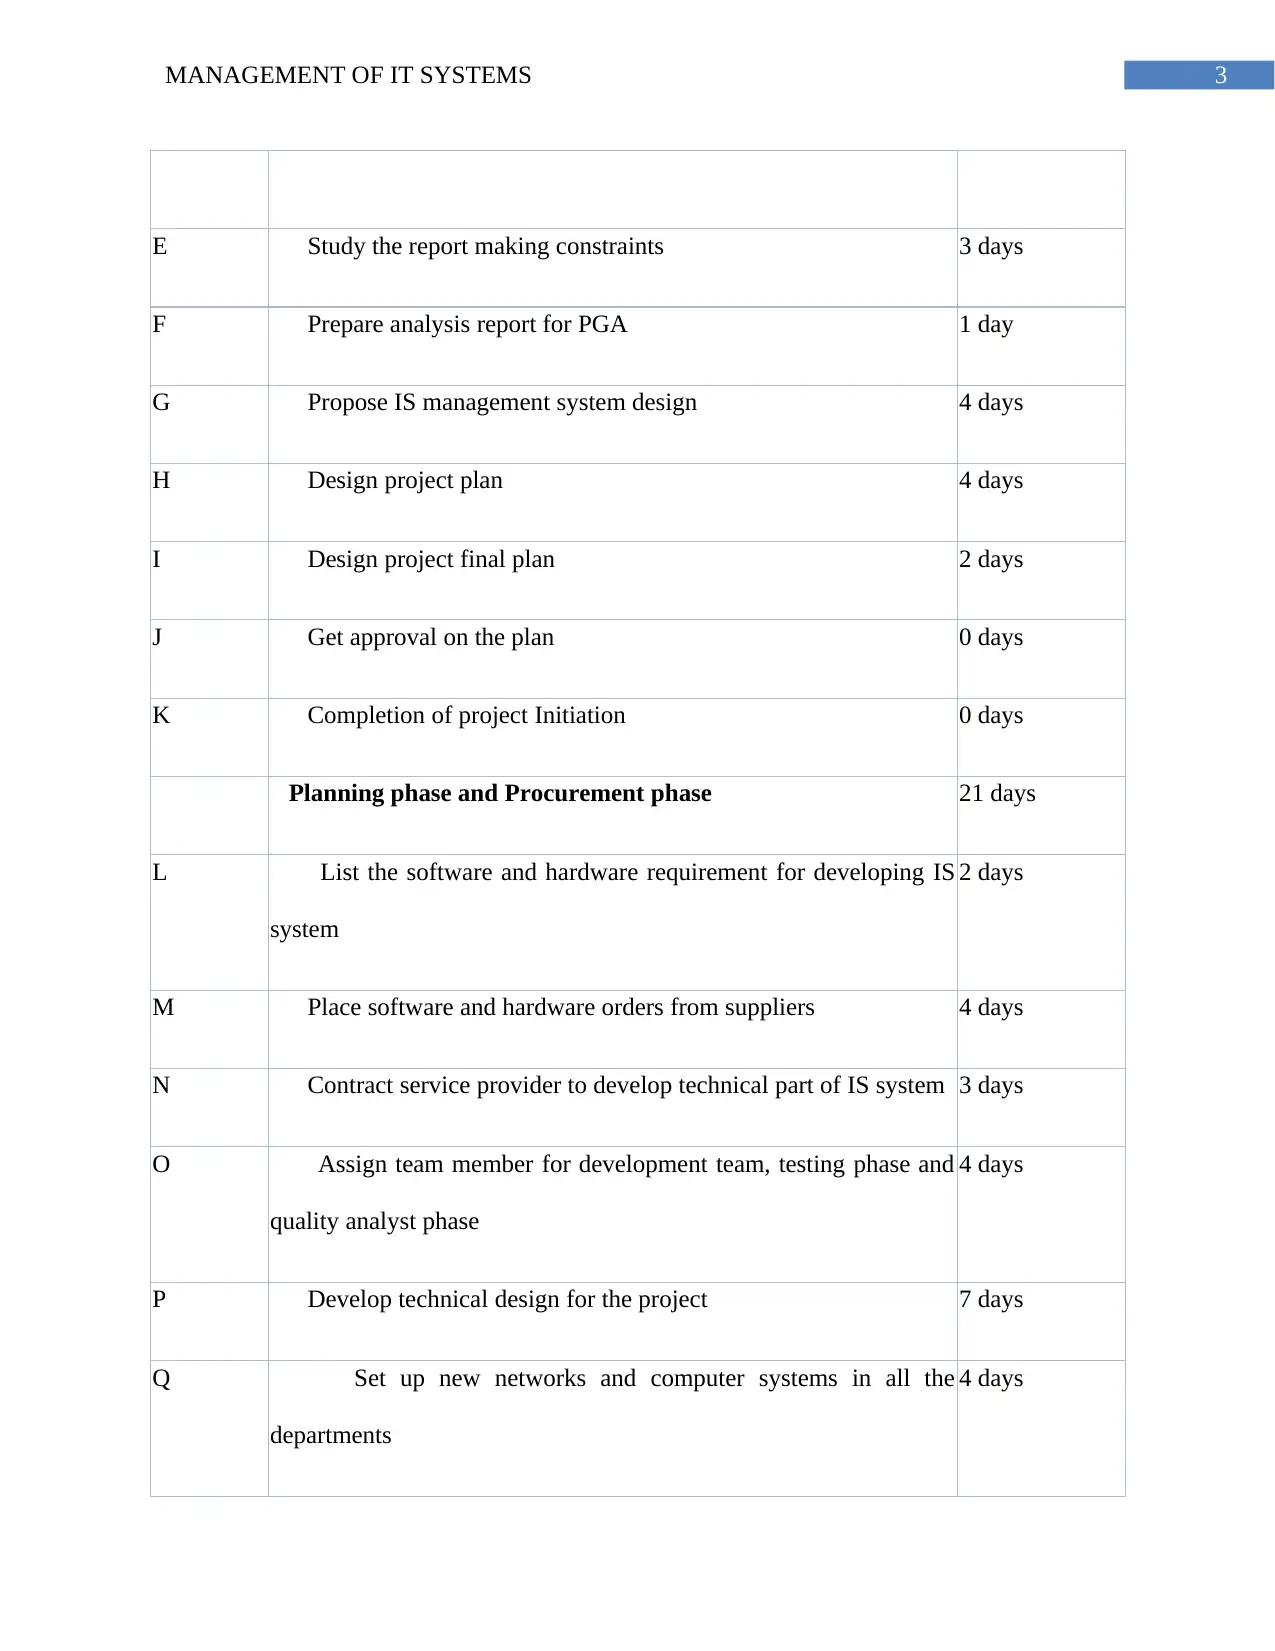
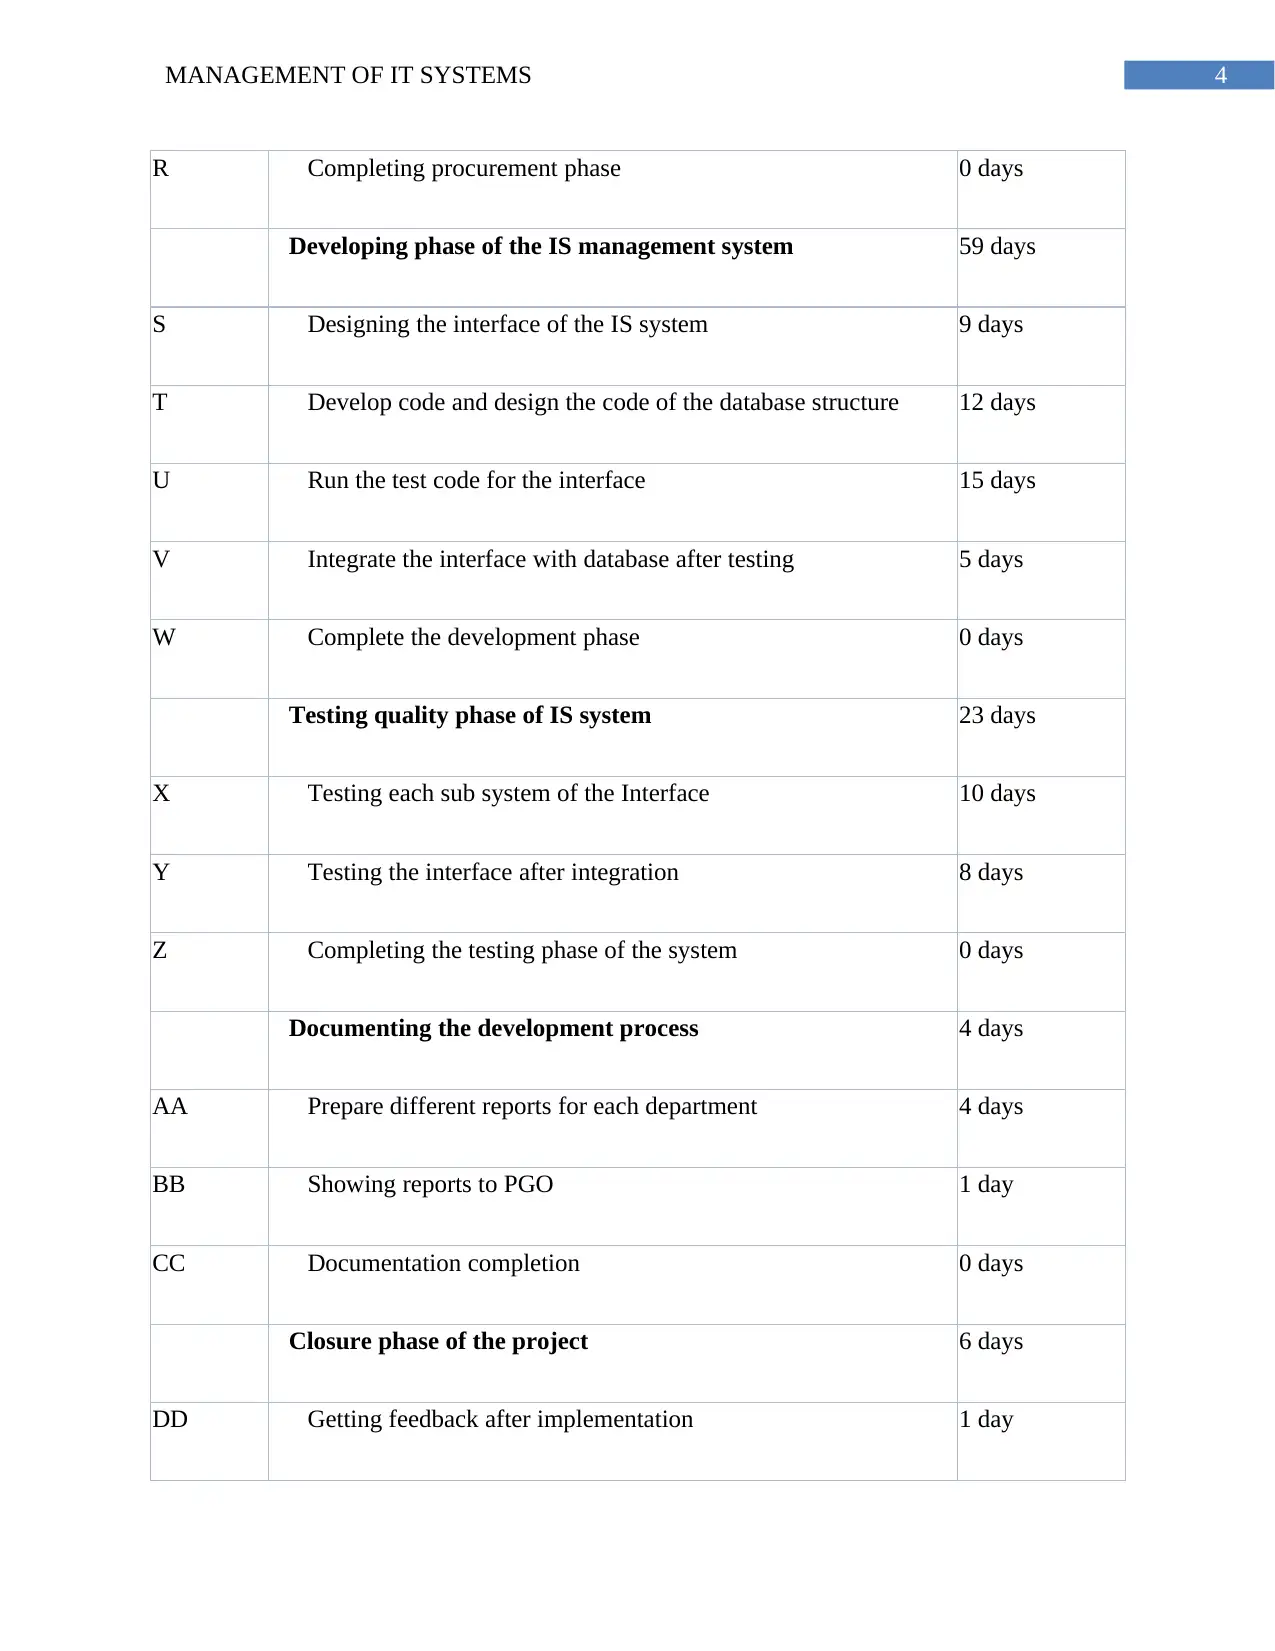
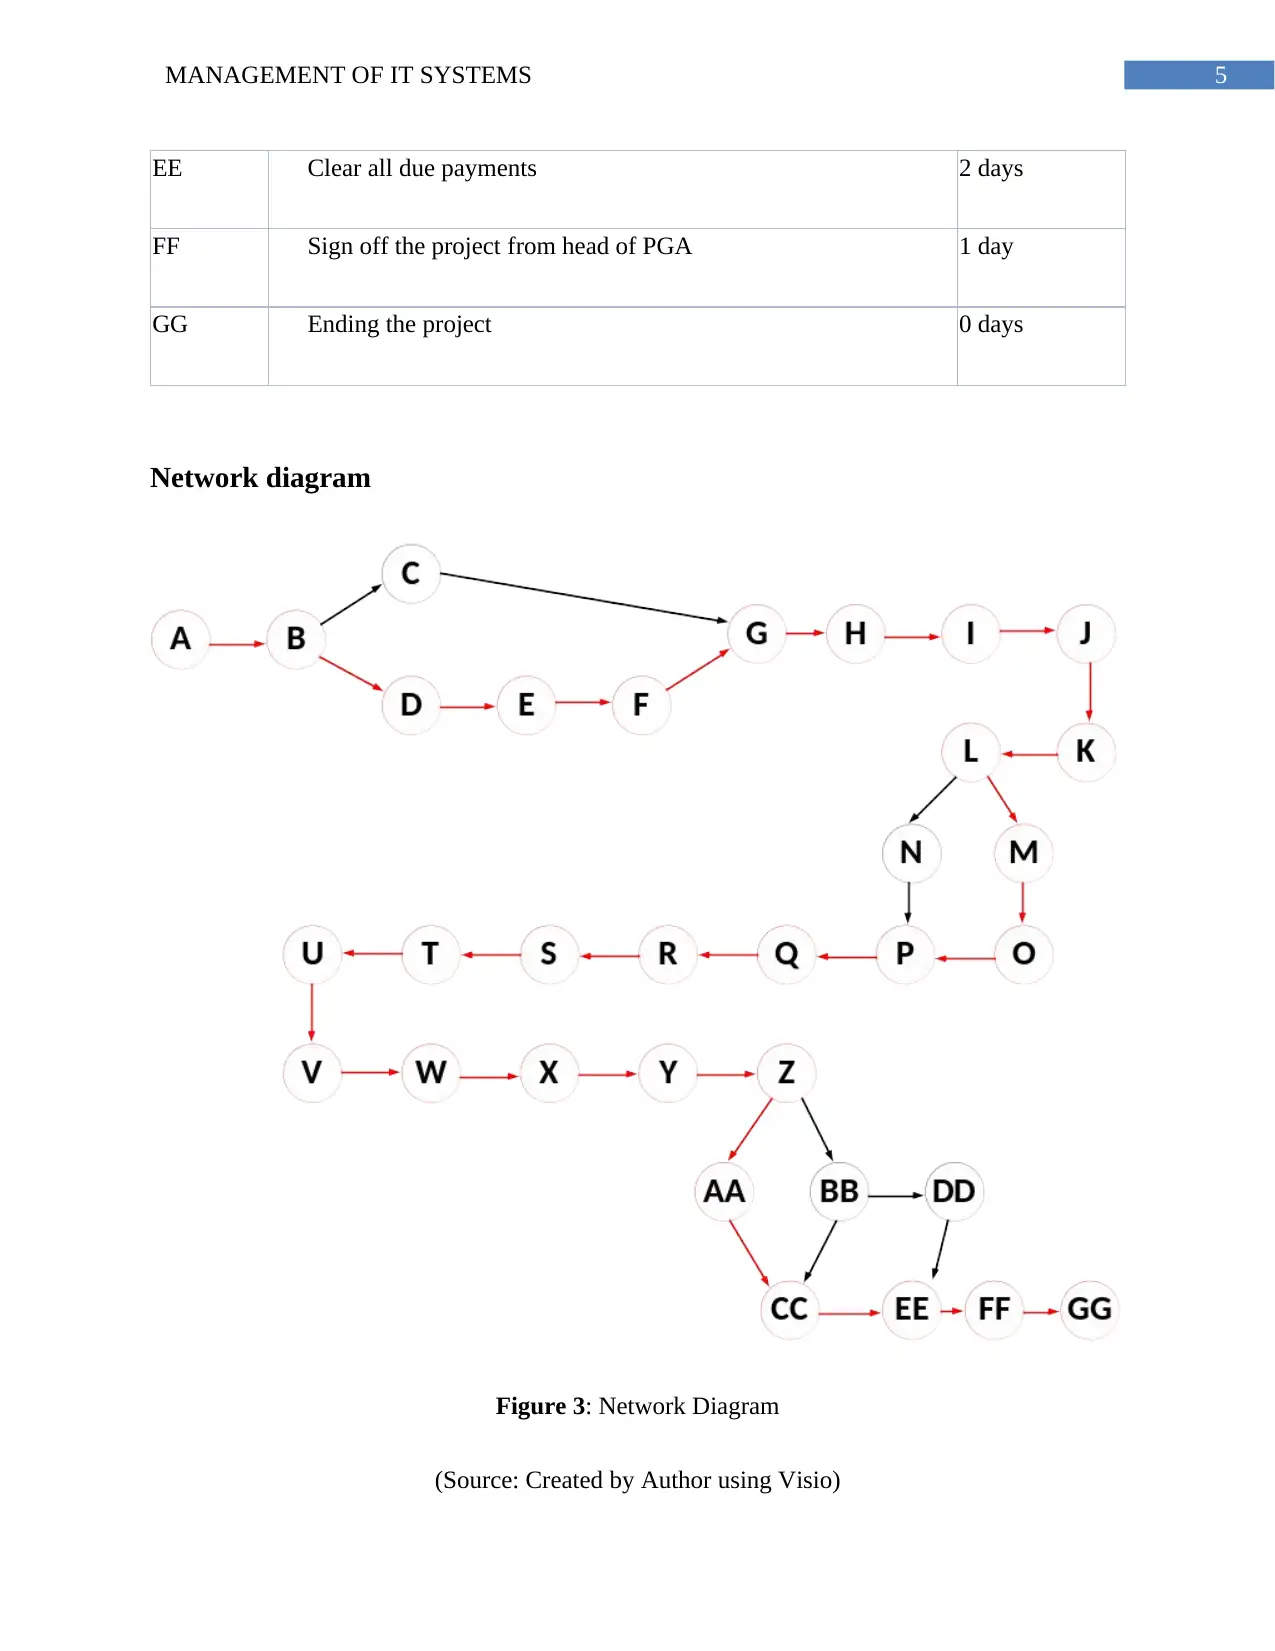
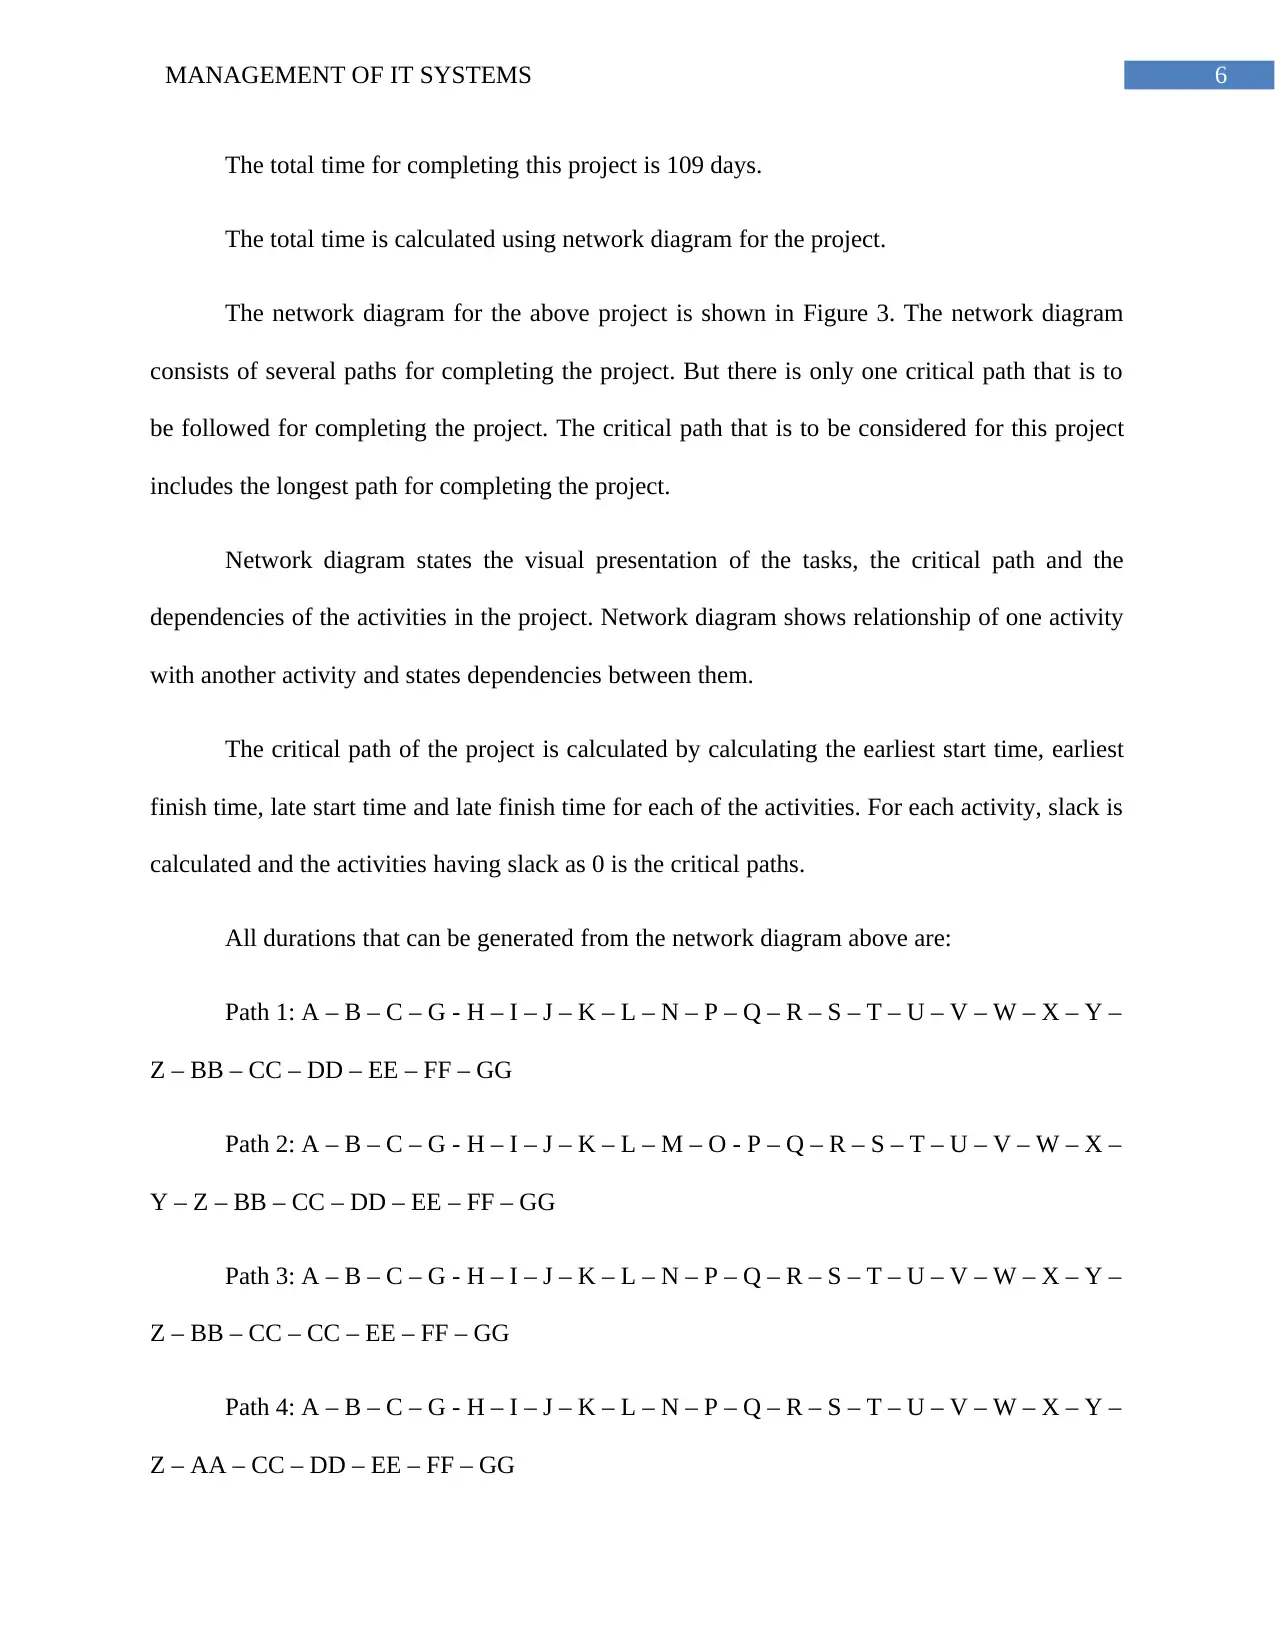
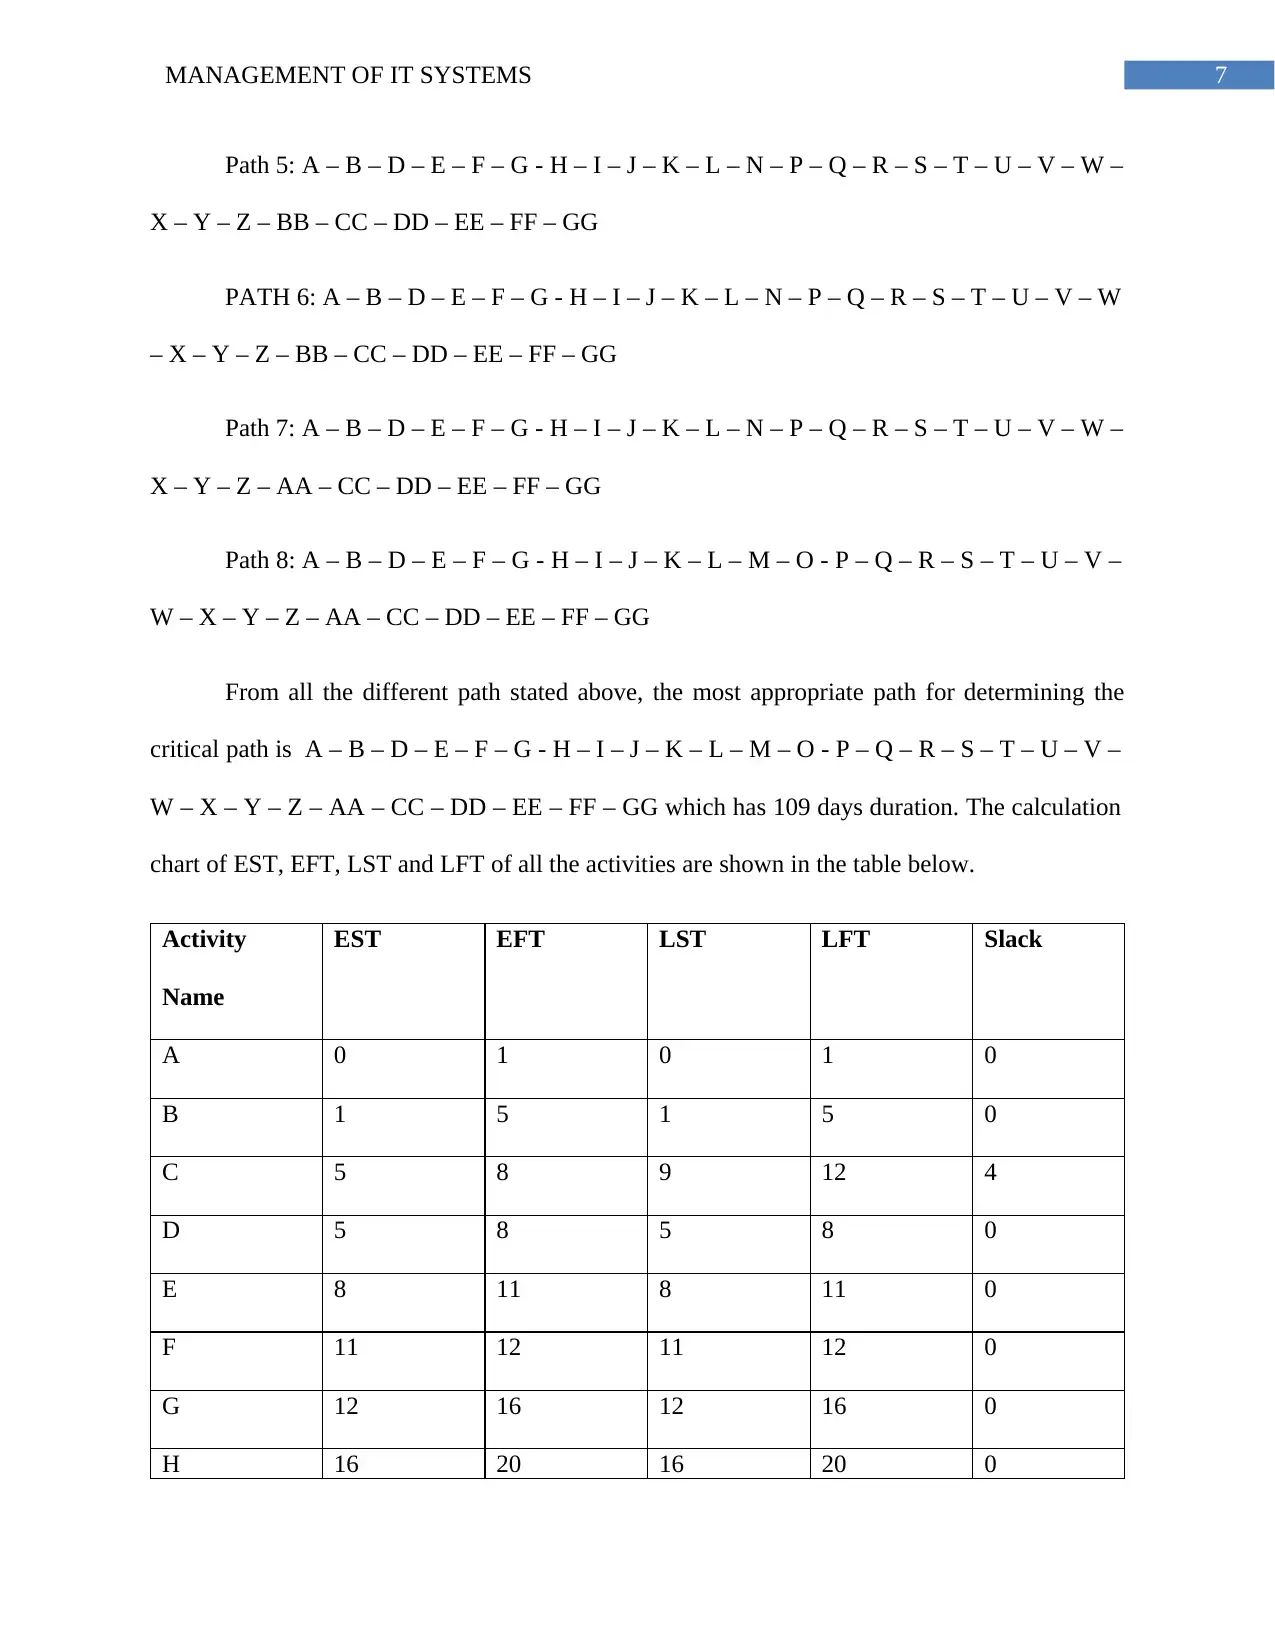
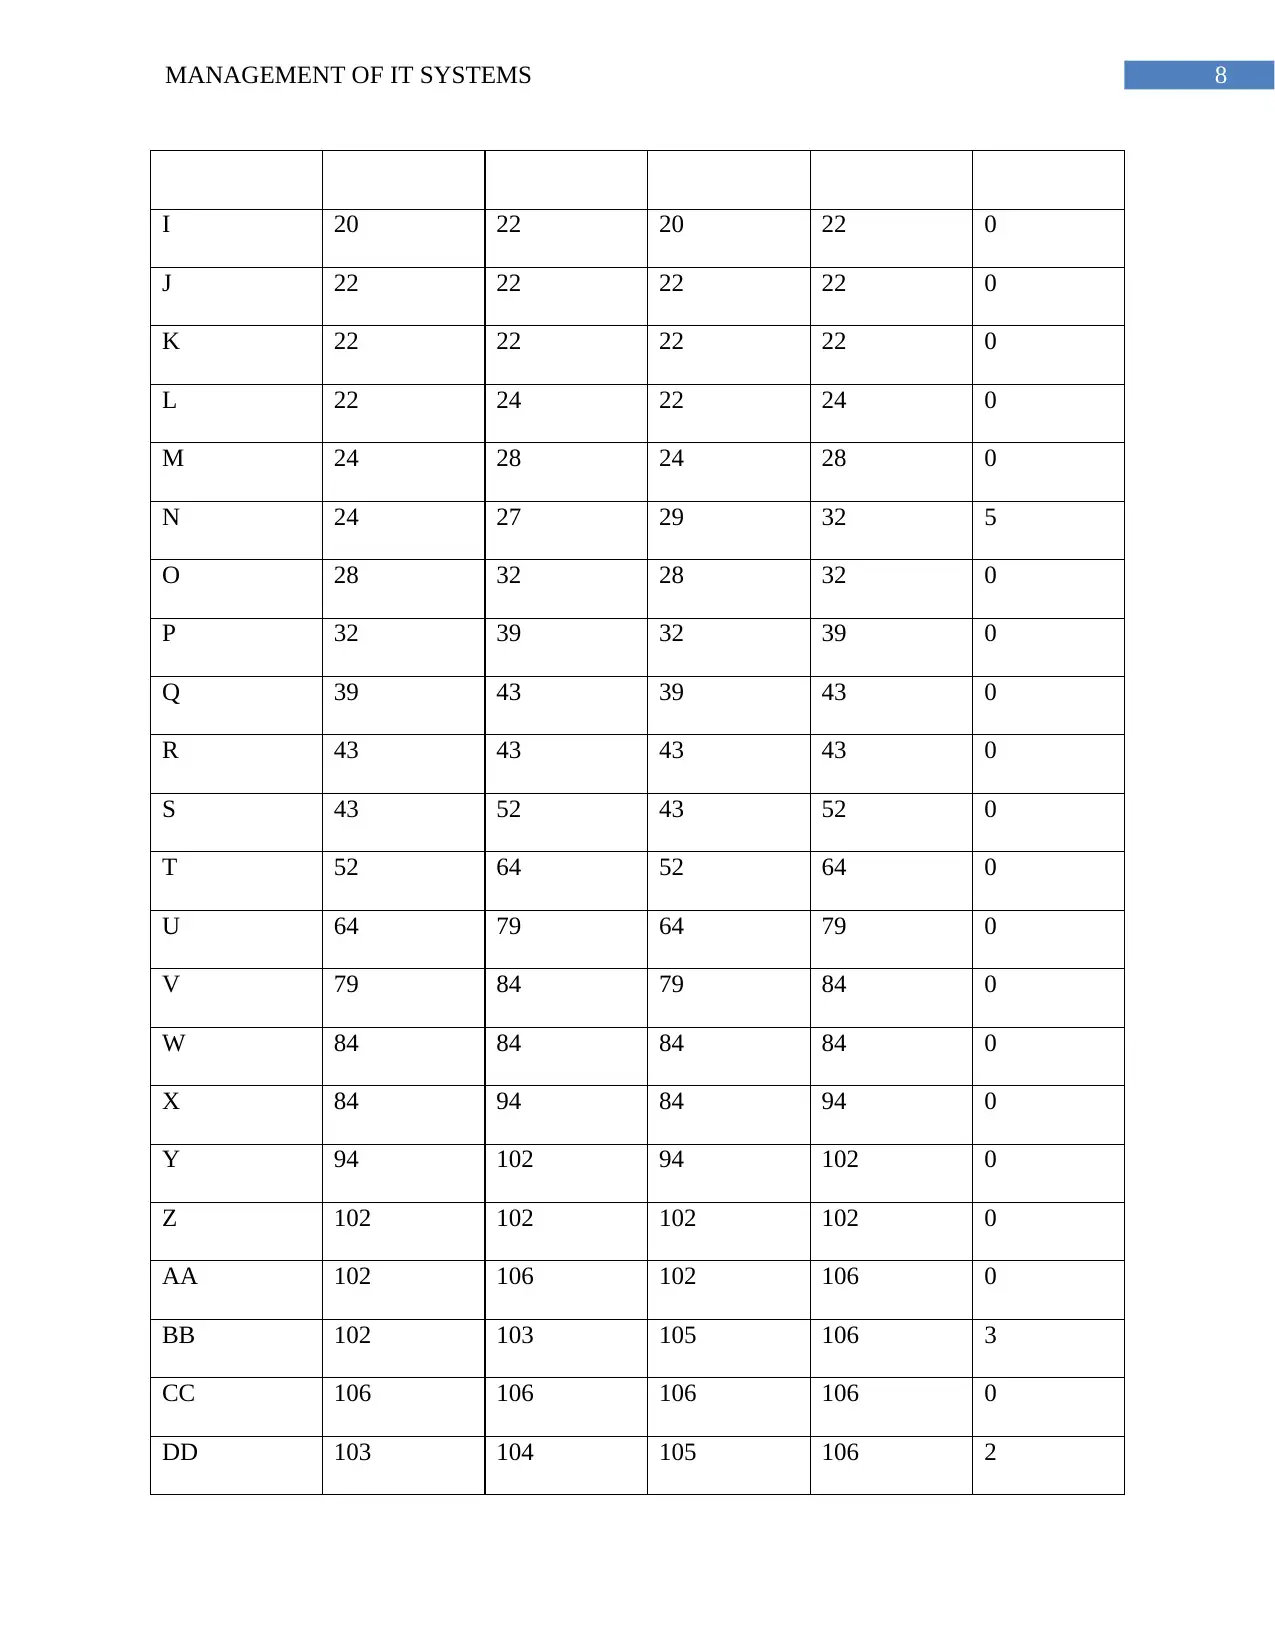
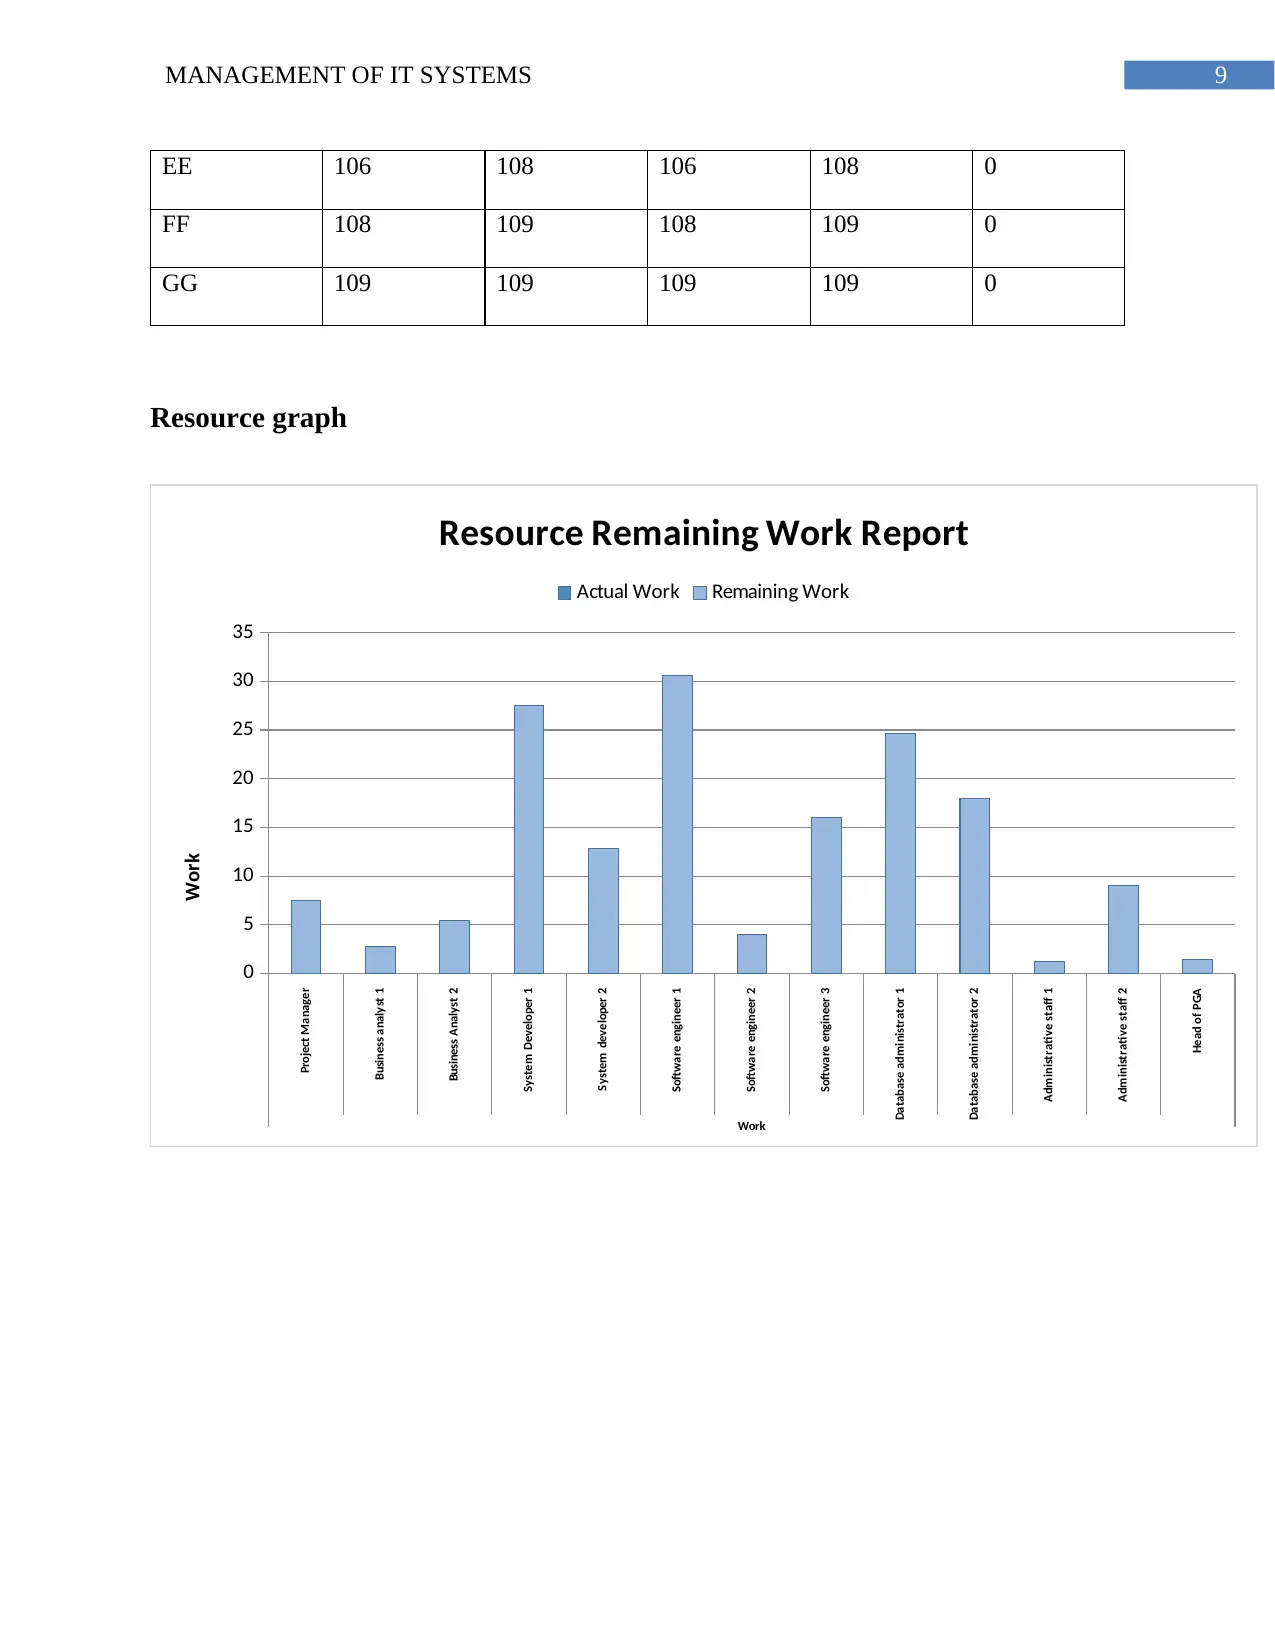
This project report details the implementation of an Executive Information System (EIS) for the CEO in Aklan, Philippines. The report includes a Gantt chart, a work breakdown structure, and a network diagram to illustrate the project's timeline and critical path. The project involves several phases, including initiation, planning and procurement, development, testing and quality assurance, documentation, and closure. The critical path analysis identifies the longest path for completing the project, with a total duration of 109 days. The report also includes the earliest start time, earliest finish time, late start time, late finish time, and slack for each activity. The resource graph and bibliography are also included. The project aims to aid the Provincial Governor in monitoring projects and tracking provincial income.

Running head: MANAGEMENT OF IT SYSTEMS
MANAGEMENT OF IT SYSTEMS
Name of Student-
Name of University-
Author’s note-
MANAGEMENT OF IT SYSTEMS
Name of Student-
Name of University-
Author’s note-
Paraphrase This Document
Need a fresh take? Get an instant paraphrase of this document with our AI Paraphraser

1MANAGEMENT OF IT SYSTEMS
1. Gantt chart
Figure 1: Gantt chart
(Source: Created by Author using MS Project)
1. Gantt chart
Figure 1: Gantt chart
(Source: Created by Author using MS Project)

2MANAGEMENT OF IT SYSTEMS
Executive Information
System of Aklan
Starting of
development of IS
project
Initiation phase of
development
Conduct Interview of
PGO's of all
departments
Reviewing the
management system
of each department
Observing the
operations
performed in each
department
Study the report
making constraints
Prepare analysis
report for PGA
Propose IS
management system
design
Design project plan
Design project final
plan
Get approval on the
plan
Completion of
project Initiation
Planning phase and
Procurement phase
List the software
and hardware
requirement for
developing IS
system
Place software and
hardware orders
from suppliers
Contract service
provider to develop
technical part of IS
system
Assign team member
for development
team, testing phase
and quality analyst
phase
Develop technical
deisgn for the
project
Set up new networks
and computer
systems in all the
departments
Completing
procurement phase
Developing phase of the IS
management system
Designing the
interface of the IS
system
Develop code and
design the code of
the database
structure
Run the test code
for the interface
Integrate the
interface with
database after
testing
Complete the
development phase
Testing quality phase of IS
system
Testing each sub
system of the
Interface
Testing the interface
after integration
Completing the
testing phase of the
system
Documenting the
developmnet process
Prepare different
reports for each
department
Showing reports to
PGO
Documentation
completion
Closure phase of the
project
Getting feedback after
implementation
Clear all due
payments
Sign off the project
from head of PGA
Ending the project
Figure 2: Work Breakdown Structure
(Source: Created by Author)
2. Network Diagram
Task Num Task Name Duration
Executive Information System of Aklan 109 days
A Starting of development of IS project 1 day
Initiation phase of development 21 days
B Conduct Interview of PGO's of all departments 4 days
C Reviewing the management system of each department 3 days
D Observing the operations performed in each department 3 days
⊘ This is a preview!⊘
Do you want full access?
Subscribe today to unlock all pages.

Trusted by 1+ million students worldwide

3MANAGEMENT OF IT SYSTEMS
E Study the report making constraints 3 days
F Prepare analysis report for PGA 1 day
G Propose IS management system design 4 days
H Design project plan 4 days
I Design project final plan 2 days
J Get approval on the plan 0 days
K Completion of project Initiation 0 days
Planning phase and Procurement phase 21 days
L List the software and hardware requirement for developing IS
system
2 days
M Place software and hardware orders from suppliers 4 days
N Contract service provider to develop technical part of IS system 3 days
O Assign team member for development team, testing phase and
quality analyst phase
4 days
P Develop technical design for the project 7 days
Q Set up new networks and computer systems in all the
departments
4 days
Paraphrase This Document
Need a fresh take? Get an instant paraphrase of this document with our AI Paraphraser

4MANAGEMENT OF IT SYSTEMS
R Completing procurement phase 0 days
Developing phase of the IS management system 59 days
S Designing the interface of the IS system 9 days
T Develop code and design the code of the database structure 12 days
U Run the test code for the interface 15 days
V Integrate the interface with database after testing 5 days
W Complete the development phase 0 days
Testing quality phase of IS system 23 days
X Testing each sub system of the Interface 10 days
Y Testing the interface after integration 8 days
Z Completing the testing phase of the system 0 days
Documenting the development process 4 days
AA Prepare different reports for each department 4 days
BB Showing reports to PGO 1 day
CC Documentation completion 0 days
Closure phase of the project 6 days
DD Getting feedback after implementation 1 day

5MANAGEMENT OF IT SYSTEMS
EE Clear all due payments 2 days
FF Sign off the project from head of PGA 1 day
GG Ending the project 0 days
Network diagram
Figure 3: Network Diagram
(Source: Created by Author using Visio)
EE Clear all due payments 2 days
FF Sign off the project from head of PGA 1 day
GG Ending the project 0 days
Network diagram
Figure 3: Network Diagram
(Source: Created by Author using Visio)
⊘ This is a preview!⊘
Do you want full access?
Subscribe today to unlock all pages.

Trusted by 1+ million students worldwide

6MANAGEMENT OF IT SYSTEMS
The total time for completing this project is 109 days.
The total time is calculated using network diagram for the project.
The network diagram for the above project is shown in Figure 3. The network diagram
consists of several paths for completing the project. But there is only one critical path that is to
be followed for completing the project. The critical path that is to be considered for this project
includes the longest path for completing the project.
Network diagram states the visual presentation of the tasks, the critical path and the
dependencies of the activities in the project. Network diagram shows relationship of one activity
with another activity and states dependencies between them.
The critical path of the project is calculated by calculating the earliest start time, earliest
finish time, late start time and late finish time for each of the activities. For each activity, slack is
calculated and the activities having slack as 0 is the critical paths.
All durations that can be generated from the network diagram above are:
Path 1: A – B – C – G - H – I – J – K – L – N – P – Q – R – S – T – U – V – W – X – Y –
Z – BB – CC – DD – EE – FF – GG
Path 2: A – B – C – G - H – I – J – K – L – M – O - P – Q – R – S – T – U – V – W – X –
Y – Z – BB – CC – DD – EE – FF – GG
Path 3: A – B – C – G - H – I – J – K – L – N – P – Q – R – S – T – U – V – W – X – Y –
Z – BB – CC – CC – EE – FF – GG
Path 4: A – B – C – G - H – I – J – K – L – N – P – Q – R – S – T – U – V – W – X – Y –
Z – AA – CC – DD – EE – FF – GG
Paraphrase This Document
Need a fresh take? Get an instant paraphrase of this document with our AI Paraphraser

7MANAGEMENT OF IT SYSTEMS
Path 5: A – B – D – E – F – G - H – I – J – K – L – N – P – Q – R – S – T – U – V – W –
X – Y – Z – BB – CC – DD – EE – FF – GG
PATH 6: A – B – D – E – F – G - H – I – J – K – L – N – P – Q – R – S – T – U – V – W
– X – Y – Z – BB – CC – DD – EE – FF – GG
Path 7: A – B – D – E – F – G - H – I – J – K – L – N – P – Q – R – S – T – U – V – W –
X – Y – Z – AA – CC – DD – EE – FF – GG
Path 8: A – B – D – E – F – G - H – I – J – K – L – M – O - P – Q – R – S – T – U – V –
W – X – Y – Z – AA – CC – DD – EE – FF – GG
From all the different path stated above, the most appropriate path for determining the
critical path is A – B – D – E – F – G - H – I – J – K – L – M – O - P – Q – R – S – T – U – V –
W – X – Y – Z – AA – CC – DD – EE – FF – GG which has 109 days duration. The calculation
chart of EST, EFT, LST and LFT of all the activities are shown in the table below.
Activity
Name
EST EFT LST LFT Slack
A 0 1 0 1 0
B 1 5 1 5 0
C 5 8 9 12 4
D 5 8 5 8 0
E 8 11 8 11 0
F 11 12 11 12 0
G 12 16 12 16 0
H 16 20 16 20 0

8MANAGEMENT OF IT SYSTEMS
I 20 22 20 22 0
J 22 22 22 22 0
K 22 22 22 22 0
L 22 24 22 24 0
M 24 28 24 28 0
N 24 27 29 32 5
O 28 32 28 32 0
P 32 39 32 39 0
Q 39 43 39 43 0
R 43 43 43 43 0
S 43 52 43 52 0
T 52 64 52 64 0
U 64 79 64 79 0
V 79 84 79 84 0
W 84 84 84 84 0
X 84 94 84 94 0
Y 94 102 94 102 0
Z 102 102 102 102 0
AA 102 106 102 106 0
BB 102 103 105 106 3
CC 106 106 106 106 0
DD 103 104 105 106 2
⊘ This is a preview!⊘
Do you want full access?
Subscribe today to unlock all pages.

Trusted by 1+ million students worldwide

9MANAGEMENT OF IT SYSTEMS
EE 106 108 106 108 0
FF 108 109 108 109 0
GG 109 109 109 109 0
Resource graph
Project Manager
Business analyst 1
Business Analyst 2
System Developer 1
System developer 2
Software engineer 1
Software engineer 2
Software engineer 3
Database administrator 1
Database administrator 2
Administrative staff 1
Administrative staff 2
Head of PGA
Work
0
5
10
15
20
25
30
35
Resource Remaining Work Report
Actual Work Remaining Work
Work
Paraphrase This Document
Need a fresh take? Get an instant paraphrase of this document with our AI Paraphraser

10MANAGEMENT OF IT SYSTEMS
Bibliography
Patron, A. and Cohen, R., 2018. Optimal resource allocation for network functionality. arXiv
preprint arXiv:1812.10089.
Robles, V.D., 2018. Visualizing Certainty: What the Cultural History of the Gantt Chart Teaches
Technical and Professional Communicators about Management. Technical Communication
Quarterly, 27(4), pp.300-321.
Susanto, A.D., Suparno, S., Suharyo, O.S. and Ahmadi, A., 2018. Time Scheduling And Cost Of
The Indonesian Navy Ship Development Project Using Network Diagram And Earned Value
Method (Evm) (Case Study Of Fast Missile Boat Development). INTERNATIONAL JOURNAL
OF ASRO-STTAL, 9(2), pp.87-106.
Zockaie, A., Saberi, M. and Saedi, R., 2018. A resource allocation problem to estimate network
fundamental diagram in heterogeneous networks: Optimal locating of fixed measurement points
and sampling of probe trajectories. Transportation Research Part C: Emerging Technologies, 86,
pp.245-262.
1 out of 11
Related Documents
Your All-in-One AI-Powered Toolkit for Academic Success.
+13062052269
info@desklib.com
Available 24*7 on WhatsApp / Email
Unlock your academic potential
Copyright © 2020–2025 A2Z Services. All Rights Reserved. Developed and managed by ZUCOL.


