Comprehensive EKG Interpretation: Cardiac Function and Analysis Report

Verified

Added on  2023/06/05

|4
|511
|413
Homework Assignment
AI Summary
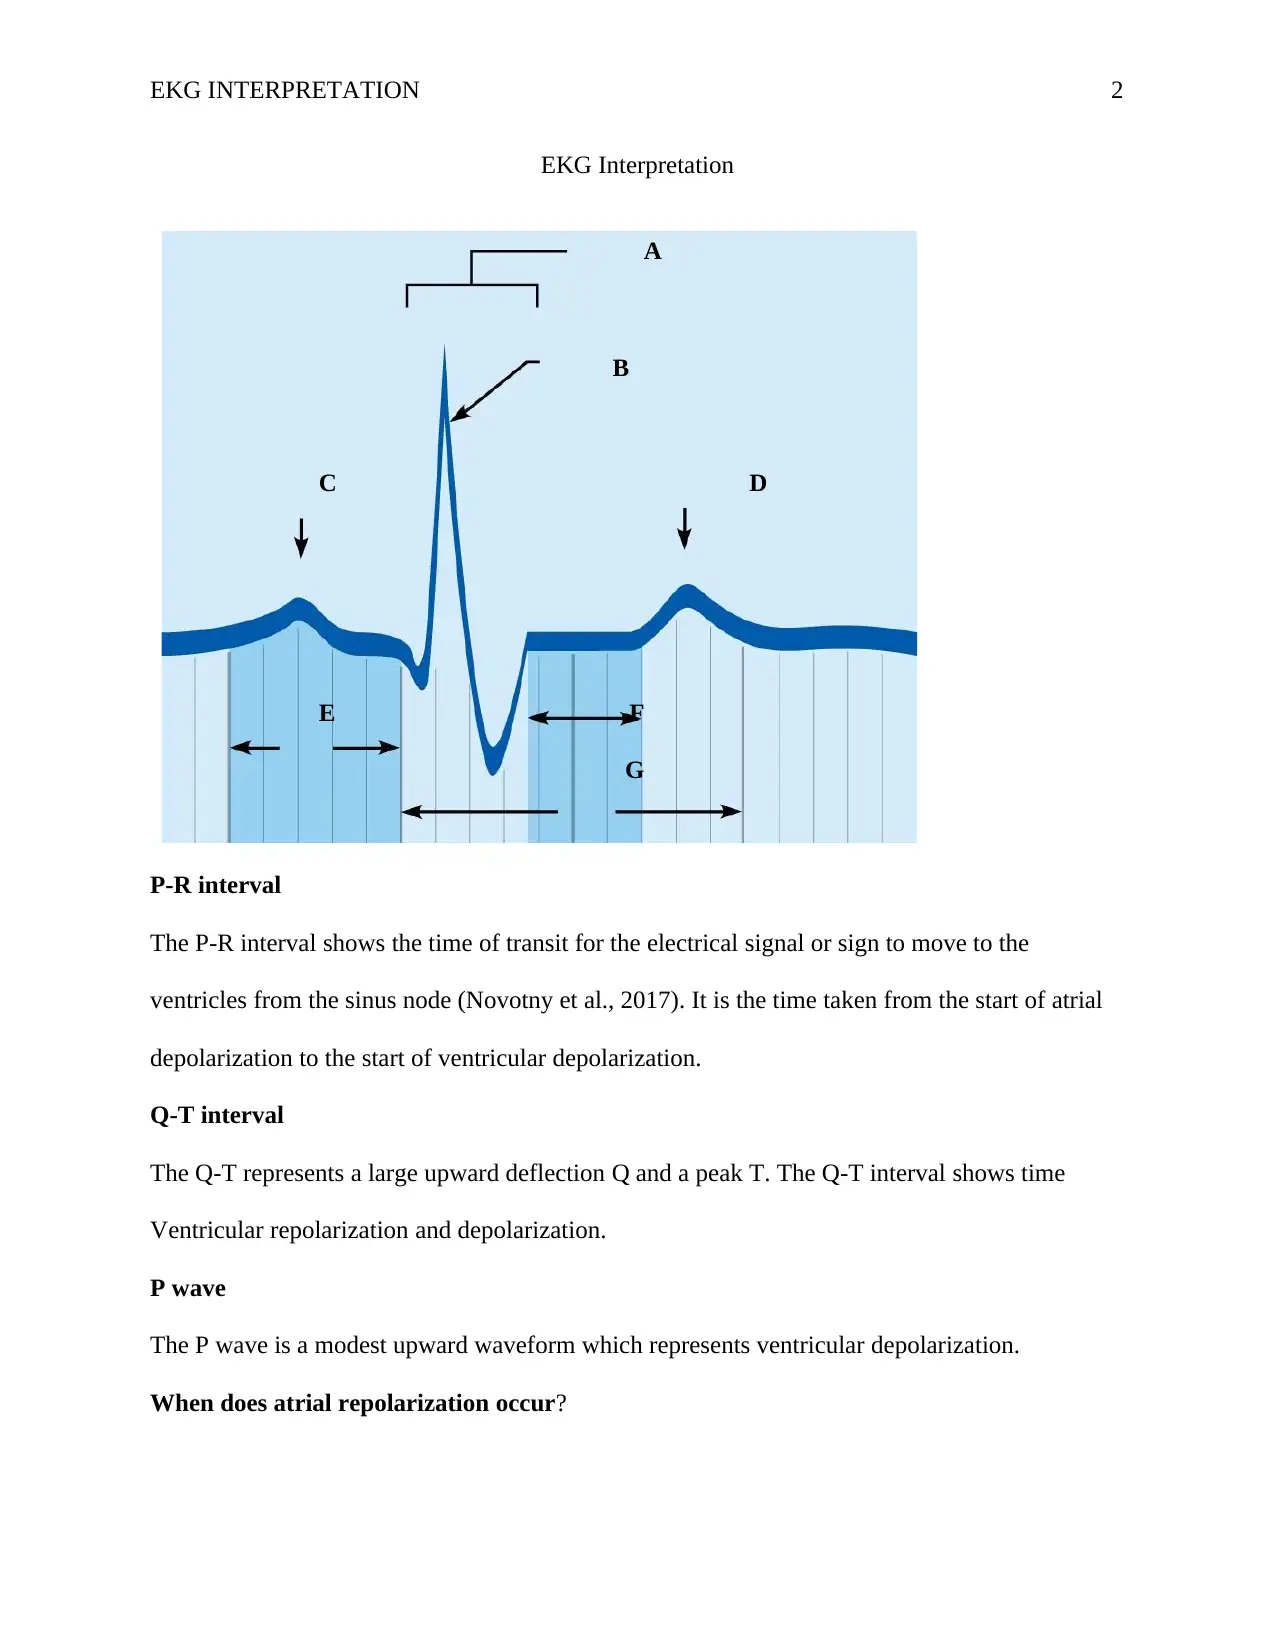
This assignment provides a comprehensive overview of EKG interpretation, focusing on understanding cardiac function through the analysis of EKG components such as P-R intervals, Q-T intervals, and P waves. It explains atrial and ventricular depolarization and repolarization, detailing when these events occur within the EKG waveform. Furthermore, the assignment defines cardiac output and stroke volume, providing the formulas for their calculation. It also discusses the Frank-Starling law and its effect on contractile force, emphasizing the importance of blood volume. References to relevant studies are included to support the analysis and provide further reading on the subject.
Document Page
Running head: EKG INTERPRETATION 1
EKG Interpretation
Student’s Name
Institutional Affiliation
tabler-icon-diamond-filled.svg

Paraphrase This Document

Need a fresh take? Get an instant paraphrase of this document with our AI Paraphraser
Document Page
EKG INTERPRETATION 2
EKG Interpretation
A
B
C D
E F
G
P-R interval
The P-R interval shows the time of transit for the electrical signal or sign to move to the
ventricles from the sinus node (Novotny et al., 2017). It is the time taken from the start of atrial
depolarization to the start of ventricular depolarization.
Q-T interval
The Q-T represents a large upward deflection Q and a peak T. The Q-T interval shows time
Ventricular repolarization and depolarization.
P wave
The P wave is a modest upward waveform which represents ventricular depolarization.
When does atrial repolarization occur?
Document Page
EKG INTERPRETATION 3
Atrial repolarization occurs when the T wave displays a positive deflection. This is because the
last cells which undergo depolarization in the ventricle are the first cells to undergo
repolarization (Novotny et al., 2017). Similarly, this happens because the last cells which
undergo depolarization are situated in the subepicardial area of the ventricle have shorter action
potential compared to those located in the subendocardial areas of the ventricular walls.
When does atrial depolarization occur?
Atrial depolarization occurs when the Ta wave of atrial repolarization happens during QSR
complex and PR segment. In other words, atrial depolarization occurs when the Ta wave
overlaps with QSR complex.
When does ventricular repolarization occur?
Ventricular repolarization occurs between the start beginning of QRS complex and at the close of
U wave or T wave.
2. What is the formula for the cardiac output? What is the definition of “cardiac output”?
Cardiac output refers to the quantity of blood which the pumps in a minute via the circulatory
system (Banet et al., 2018). The formula for cardiac output is (Cardiac Output = heart rate x
stroke volume)
3. What is the formula for stroke volume? What is the definition of “stroke volume”?
Stroke volume refers to the quantity of blood which the left ventricle pumps in a single
contraction. The formula of stroke volume is (stroke volume = cardiac output/heart rate).
4. According to Frank-Starling law, what is the most important factor effecting contractile
force?
According to the Frank-Starling law, the most vital factor which affects contractile force includes
the volume of the blood.
Document Page
EKG INTERPRETATION 4
References
Banet, M., HENRY, I., & Bernstein, D. (2018). U.S. Patent Application No. 10/052,041.
Novotny, T., Bond, R., Andrsova, I., Koc, L., Sisakova, M., Finlay, D., ... & Malik, M. (2017).
The role of computerized diagnostic proposals in the interpretation of the 12-lead
electrocardiogram by cardiology and non-cardiology fellows. International journal of
medical informatics, 101, 85-92.
chevron_up_icon
1 out of 4
circle_padding
hide_on_mobile
zoom_out_icon
[object Object]