Management Economics: Detailed Analysis of Elasticity, Revenue, Cost
VerifiedAdded on 2023/04/17
|21
|5246
|103
Report
AI Summary
This report provides a comprehensive analysis of key concepts in management economics, including elasticity of sales, price elasticity of demand, income elasticity, and their impact on revenue and cost. It features detailed calculations and interpretations of these elasticities, along with an analysis of profit maximization and cost minimization strategies. Furthermore, the report includes a case study of Microsoft, examining its market structure, historical evolution, and the role of government intervention. The analysis incorporates relevant economic theories and applies them to practical business scenarios, offering valuable insights for students and practitioners alike. Desklib provides a platform to access more such solved assignments and study resources.
STUDENTNAME: LABLU HUSSAIN
STUDENT ID: 1303804
MODULE TITLE: MANAGEMENT ECONOMICS
Module Lecturer’s Name; Ravshonbek Otojanov
1
STUDENT ID: 1303804
MODULE TITLE: MANAGEMENT ECONOMICS
Module Lecturer’s Name; Ravshonbek Otojanov
1
Paraphrase This Document
Need a fresh take? Get an instant paraphrase of this document with our AI Paraphraser
Table of Contents
Part A.........................................................................................................................................3
(a) Elasticity of Sales.................................................................................................................3
(b) Price elasticity of demand..................................................................................................4
(c) Income Elasticity..................................................................................................................5
(d) Revenue and Cost.................................................................................................................6
(e) Profit maximisation and Cost minimisation.........................................................................8
(F) Intuitive Analysis...............................................................................................................10
Part B........................................................................................................................................11
a. Brief history of the international company Microsoft..........................................................11
b. Discussion of the nature of the market structure of Microsoft.............................................12
c. Nature of the market to which Microsoft belongs in the history..........................................14
d. Discussion about the characteristic of the past market structure of Microsoft....................15
e. Degree of government intervention needed in present form of market of Microsoft..........17
Reference List..........................................................................................................................18
2
Part A
(a) Elasticity of Sales
Population Elasticity of sales can be defined as the responsiveness to sales due to change in
population. In other words it means that due to increase or decrease in population to what
extent and how sales is affected (Love,2013, p.125).
Here
ἐs= Elasticity of sales
S= Sales
P= Population
dS= change in sales
dP= change in population
ἐ s=dS /dP× P/S
As given:
ἐs= 0.8
Therefore
0.8= (dS/ (140000-130000))×(130000/S)
0.8= (dS/10000)×(130000/S)
0.8= (dS / 1) × (13/S)
0.8/13= (dS/S)
dS/S= 0.0615
Therefore estimated percentage change in sales would be,
⇒0.615×100=6.1538%.
Now if the population increases by 10000,
The sale is expected to rise by:
⇒(6.1538/100)10000
3
⊘ This is a preview!⊘
Do you want full access?
Subscribe today to unlock all pages.
Trusted by 1+ million students worldwide
⇒ 615.384 units.
(b) Price elasticity of demand
Price elasticity of demand is the responsiveness of price change on quantity or it can be
written as change in quantity demanded due to 1 unit change in price.
Here in this case
P0– Initial Price
Pf– Final Price
P0=7.50
Pf = 8.50
ἐp=0.85
ἐp = (dq/q)/(dp/p)
ἐp = dq/dp×p/q
⇒ ἐp = dq/(Pf –P0)×(7.50/q)
⇒ἐp = dq/(8.50 –7.50)×(7.50/q)
⇒ -0.85= dq/q×7.50
⇒ dq/q=-(0.85/7.50)
⇒ dq/q= -0.113
According to the problem it seems that with one unit increase in price the demand is expected
to fall by 0.113 units.
In terms of percentage, with a percentage change in price,
The demand is expected to fall by 0.113×100 = 11.3% of the initial demand
The rise or fall in revenue is dependent on the nature of the elasticity curve; if the curve is
elastic the revenue is expected to fall with an increase in price, and if the demand curve is in
elastic the total revenue is expected to increase with increase in price, because people have
little choice then to move over to other goods.
4
Paraphrase This Document
Need a fresh take? Get an instant paraphrase of this document with our AI Paraphraser
Here,
TR= Total Revenue
dTR= Change in Total revenue
The conditions are if ἐp>1,then dTR<0,which means with an increase in price total revenue
decreases.
ἐp=1then the demand is unit elastic, in this case dTR=0, that is no change in the revenue level
with change in price.
ἐp<1 Total revenue rises dTR>0 with an increase in price.
In the given problem the elasticity is less than 1, which means the demand for the product is
inelastic and the people have little scope to move over for other products and hence the
consumers will have to accept the price and this will result in additional revenue.
If the ἐp =1.1,
Then in this case the price elasticity of demand is more elastic than before hence any kind of
increase in price will lead to a greater fall in demandin comparison to the previous case
⇒ dq/q=-(1.1/7.50)
=-0.1467
Therefore an increase in price while the price elasticity ofdemand is -1.1 will lead to a fall in
demand of the commodity by 0.1467 units which is greater than 0.113 units as calculated
earlier. As the elasticity -1.1 is close to being unit elastic dTR will be close to zero which
means that any increase or decrease in price will not affect the total revenue of the firm in a
massive way.
(c) Income Elasticity
Income elasticity is the responsiveness in quantity demanded due to change in income. If
income elasticity of a good is estimated to be 0.75 which means 1 unit increase in will
increase the demand of the good by 0.75 units (Saada,2013, p.115).
The conditions for income elasticity are:
Where
5
ἐy- Elasticity of income
If ἐy>0, the good is normal good
If ἐylies between 0 and 1 i.e. (0≤ἐy≤1) then the good is considered as a necessary good.
Ifἐy >1then the good is considered to be luxury good
Ifἐy<0 the good is considered to be a inferior good.
From the above conditions it can be stated that the income elasticity of 0.75 means that the
good is a normal and necessary good, any kind of increase in price will lead to decrease in
demand and any income rise will lead to increase in demand for product either in absolute or
relative terms. As per the question the said firm depending on the income elasticity’s can
makes its pricing decision and classification of products on whether the good is a normal,
inferior, necessary or luxury good and take measures accordingly.
(d)Revenue and Cost
As per the given case scenario the following table consisting of Total Revenue, Marginal
Revenue, Total Cost, Marginal Cost, Average Cost, Total Profit, and Marginal profit has been
prepared.
Total Revenue: Total revenue in economics refers to the total sales of a firm based on a
given quantity of goods. It is the total income of a company (Shepherd, 2015, p.109). It is
derived by multiplying the price of the good and the quantity of goods sold. In this case the
given total revenue equation is
TR=$800Q - $0.2Q2
Basing on this equation and assuming quantities at an interval of 100 units the Total Revenue
column has been constructed.
Marginal Revenue:Marginal Revenue is the additional revenue that will be generated by
increasing product sales by one unit.
The Marginal Revenue equation for this firm stands to
MR=dTR/dQ =$800- 2(0.2) Q (2-1)
MR=$800-0.4Q
6
⊘ This is a preview!⊘
Do you want full access?
Subscribe today to unlock all pages.
Trusted by 1+ million students worldwide
(In order to derive the marginal revenue functiona first order differentiation of the Total
Revenue function of the firm has been performed)
Total Cost: Is the summation of the variable cost and fixed cost which refers to the total
expense incurred in reaching a particular level of output. The total cost of the given firm is
TC=$38,000 + $250Q + $0.2Q2, where $ 38,000is the fixed cost and $250Q+$0.2Q2is
the variable cost.
Marginal Cost: is the additional cost incurred while producing one additional unit of output.
The marginal cost equation is determined through a first order differentiation of the total cost
function. Here the marginal cost function of the firm is
MC=dTC/dQ= $250+0.4Q (2-1).
MC= $250+0.4Q, and basing on this the marginal cost column has been prepared,
considering different values of output.
Average Cost: Is theper unit cost of a product which is derived simply by dividing the Total
Cost function by the total number of goods produced.
Average cost function for this case is:
AC=TC/Q = ($38000+ $250Q+ $0.2Q2)/Q
Total Profit: Total profit is the difference between the total revenue of the firm and the total
cost incurred by the firm in doing this.
Therefore,
Π = TR-TC
Π = (800Q-0.2Q2) - (38000+250Q+0.2Q2)
Π= 550Q-0.4Q2-38000
Here the total profit column has been created by using this function and applying various of
quantity at the specified interval level starting from 100 till 1000.
Marginal Profit:Marginal profit is the difference between the marginal revenue and the
marginal cost. Under the profit maximization approach, to maximize profits, a firm should
continue to produce a good or service up to the point where marginal profit is zero. Here the
7
Paraphrase This Document
Need a fresh take? Get an instant paraphrase of this document with our AI Paraphraser
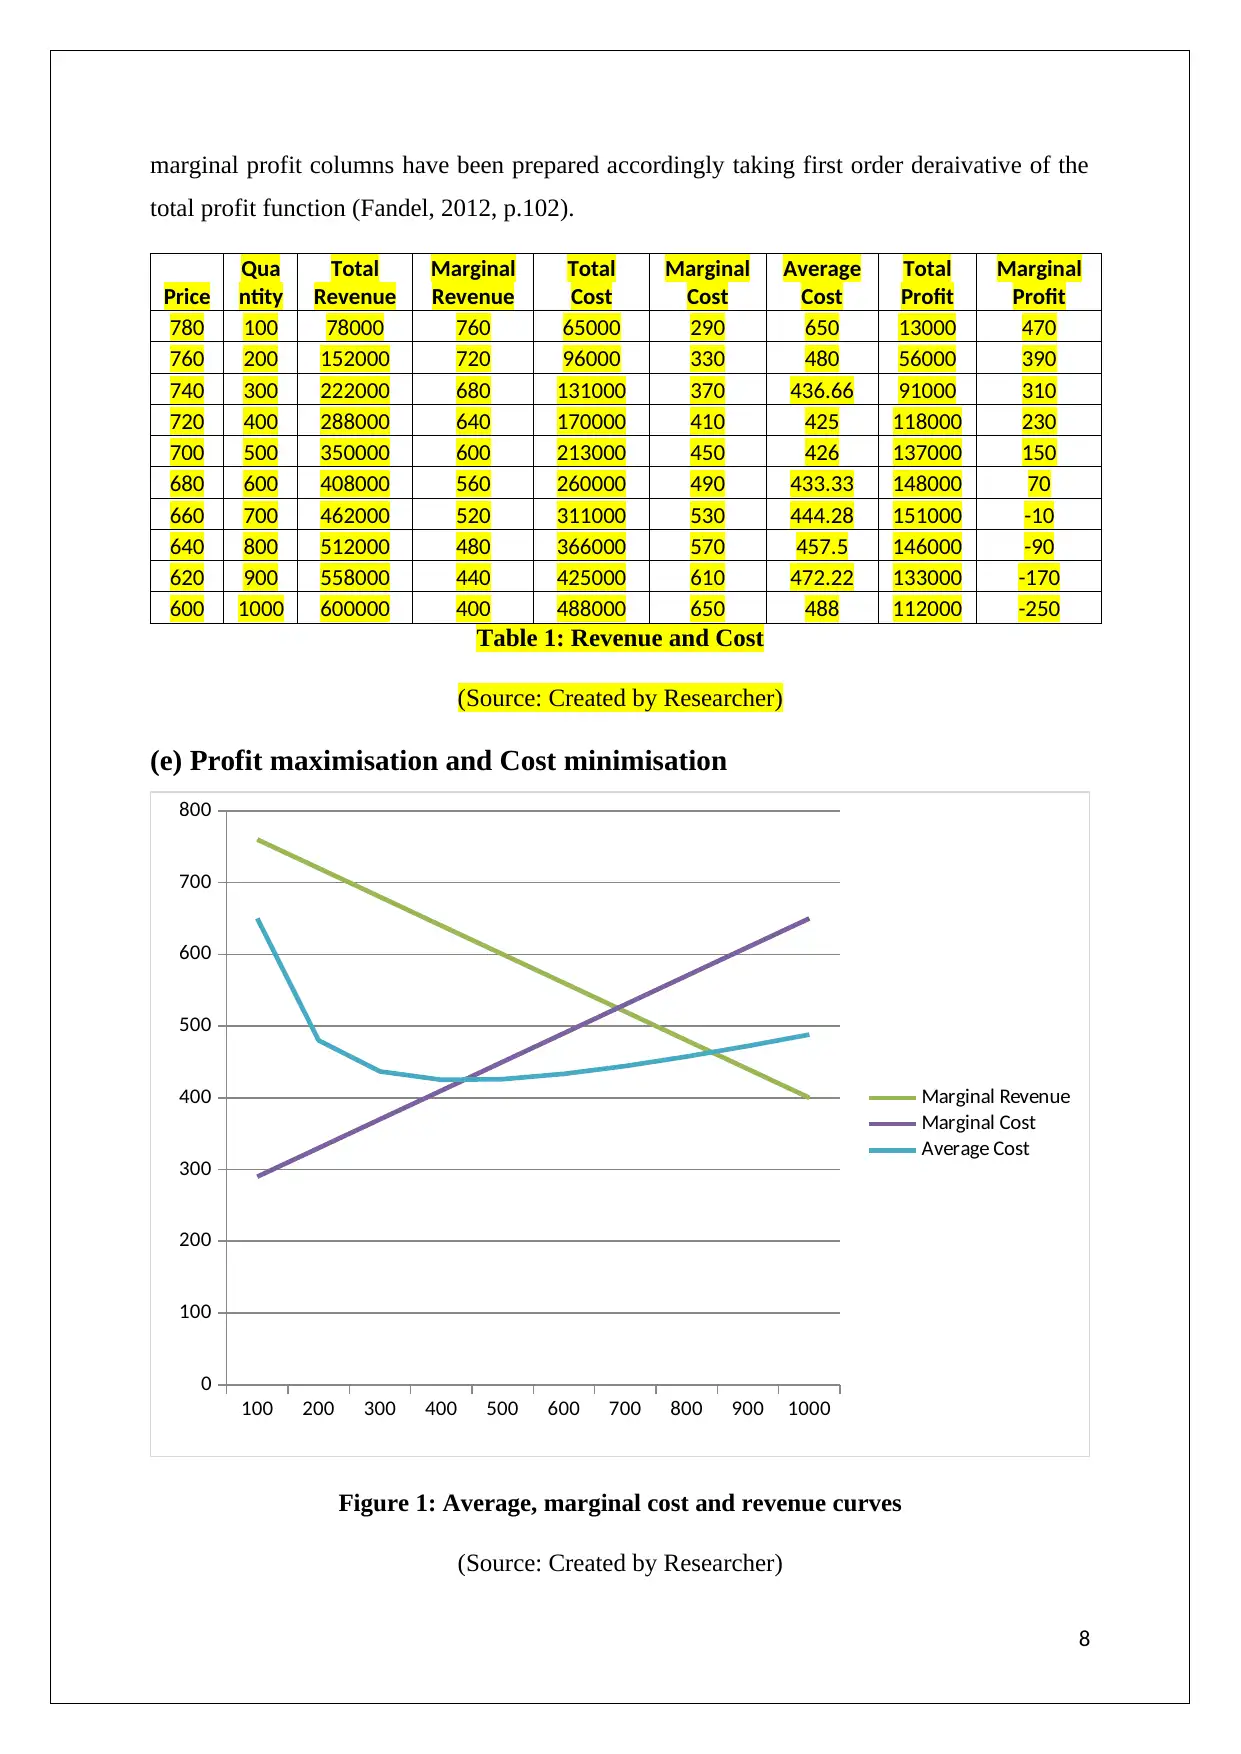
marginal profit columns have been prepared accordingly taking first order deraivative of the
total profit function (Fandel, 2012, p.102).
Price
Qua
ntity
Total
Revenue
Marginal
Revenue
Total
Cost
Marginal
Cost
Average
Cost
Total
Profit
Marginal
Profit
780 100 78000 760 65000 290 650 13000 470
760 200 152000 720 96000 330 480 56000 390
740 300 222000 680 131000 370 436.66 91000 310
720 400 288000 640 170000 410 425 118000 230
700 500 350000 600 213000 450 426 137000 150
680 600 408000 560 260000 490 433.33 148000 70
660 700 462000 520 311000 530 444.28 151000 -10
640 800 512000 480 366000 570 457.5 146000 -90
620 900 558000 440 425000 610 472.22 133000 -170
600 1000 600000 400 488000 650 488 112000 -250
Table 1: Revenue and Cost
(Source: Created by Researcher)
(e) Profit maximisation and Cost minimisation
100 200 300 400 500 600 700 800 900 1000
0
100
200
300
400
500
600
700
800
Marginal Revenue
Marginal Cost
Average Cost
Figure 1: Average, marginal cost and revenue curves
(Source: Created by Researcher)
8
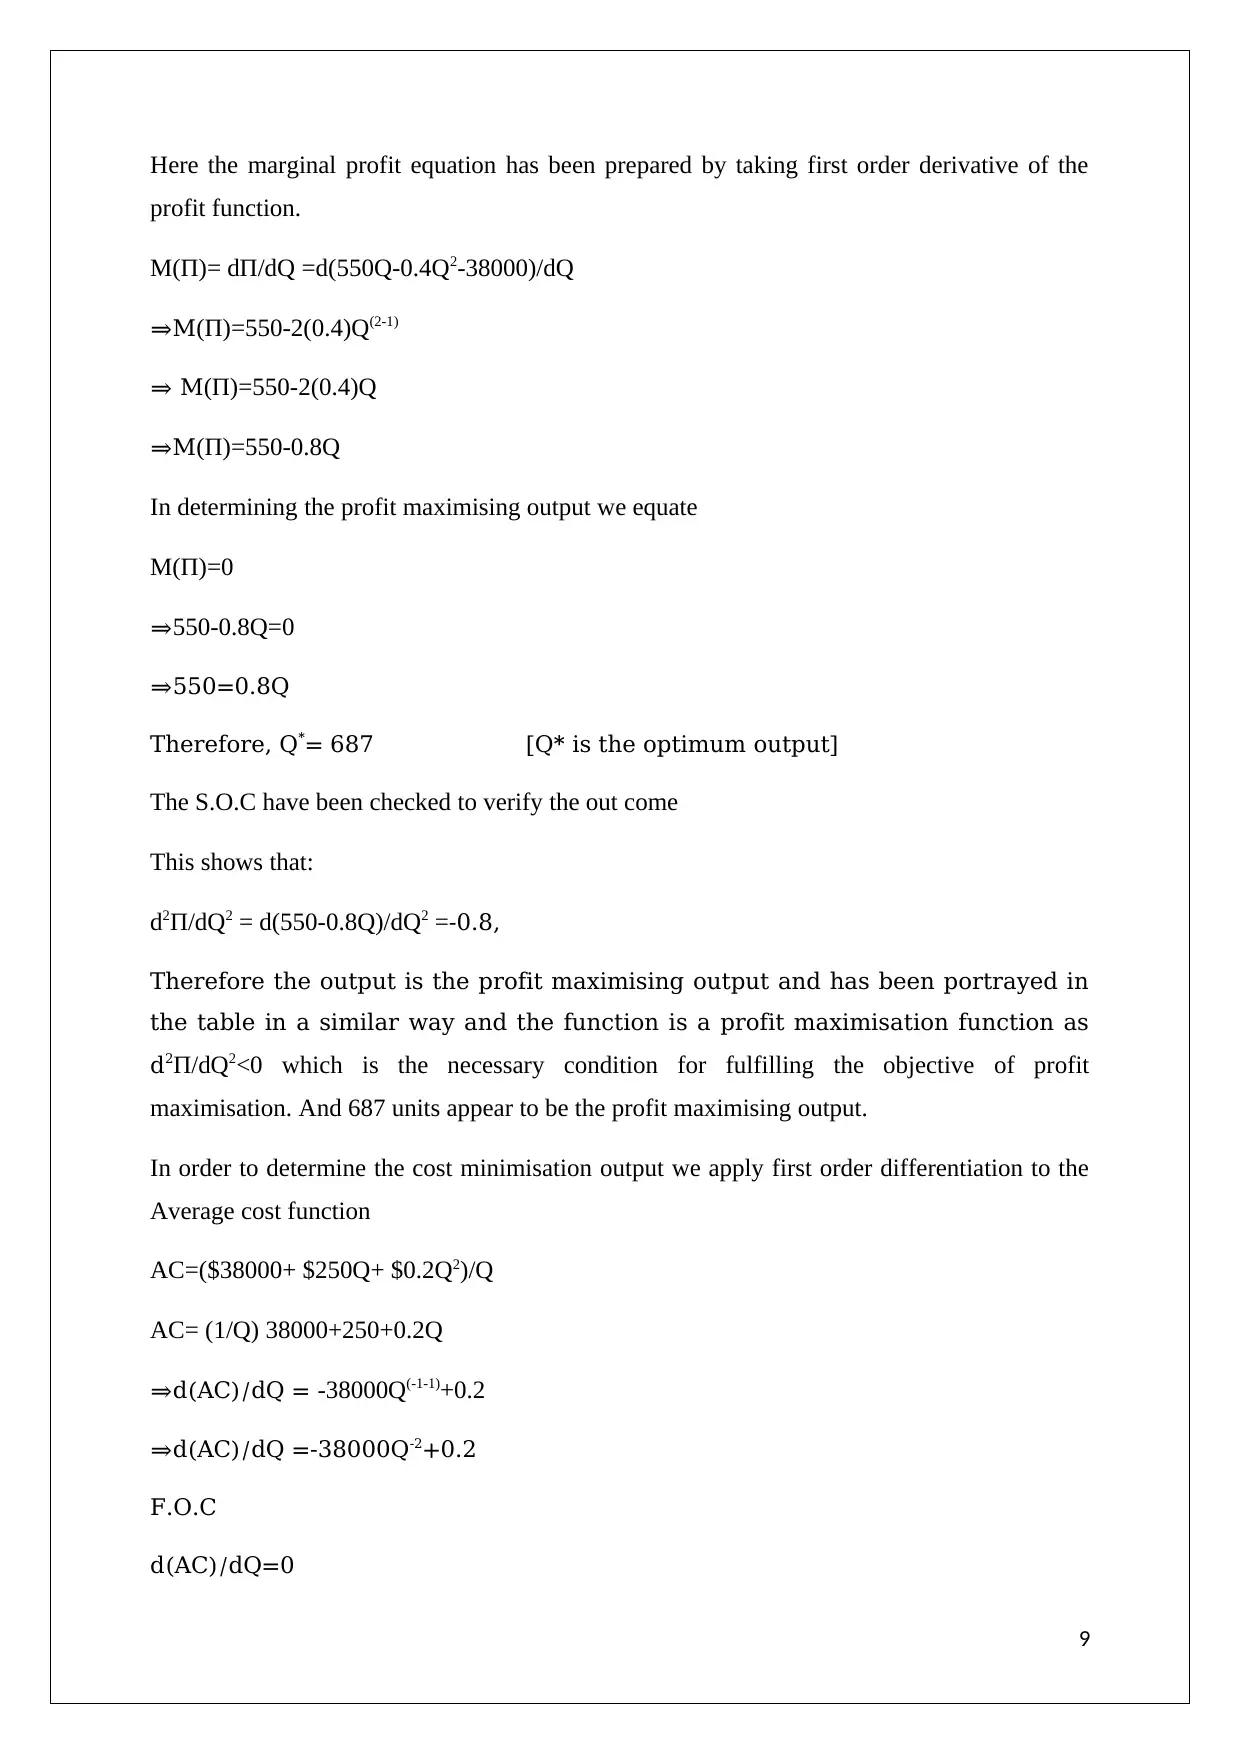
Here the marginal profit equation has been prepared by taking first order derivative of the
profit function.
M(Π)= dΠ/dQ =d(550Q-0.4Q2-38000)/dQ
⇒M(Π)=550-2(0.4)Q(2-1)
⇒ M(Π)=550-2(0.4)Q
⇒M(Π)=550-0.8Q
In determining the profit maximising output we equate
M(Π)=0
⇒550-0.8Q=0
⇒550=0.8Q
Therefore, Q*= 687 [Q* is the optimum output]
The S.O.C have been checked to verify the out come
This shows that:
d2Π/dQ2 = d(550-0.8Q)/dQ2 =-0.8,
Therefore the output is the profit maximising output and has been portrayed in
the table in a similar way and the function is a profit maximisation function as
d2Π/dQ2<0 which is the necessary condition for fulfilling the objective of profit
maximisation. And 687 units appear to be the profit maximising output.
In order to determine the cost minimisation output we apply first order differentiation to the
Average cost function
AC=($38000+ $250Q+ $0.2Q2)/Q
AC= (1/Q) 38000+250+0.2Q
⇒d(AC)/dQ = -38000Q(-1-1)+0.2
⇒d(AC)/dQ =-38000Q-2+0.2
F.O.C
d(AC)/dQ=0
9
⊘ This is a preview!⊘
Do you want full access?
Subscribe today to unlock all pages.
Trusted by 1+ million students worldwide
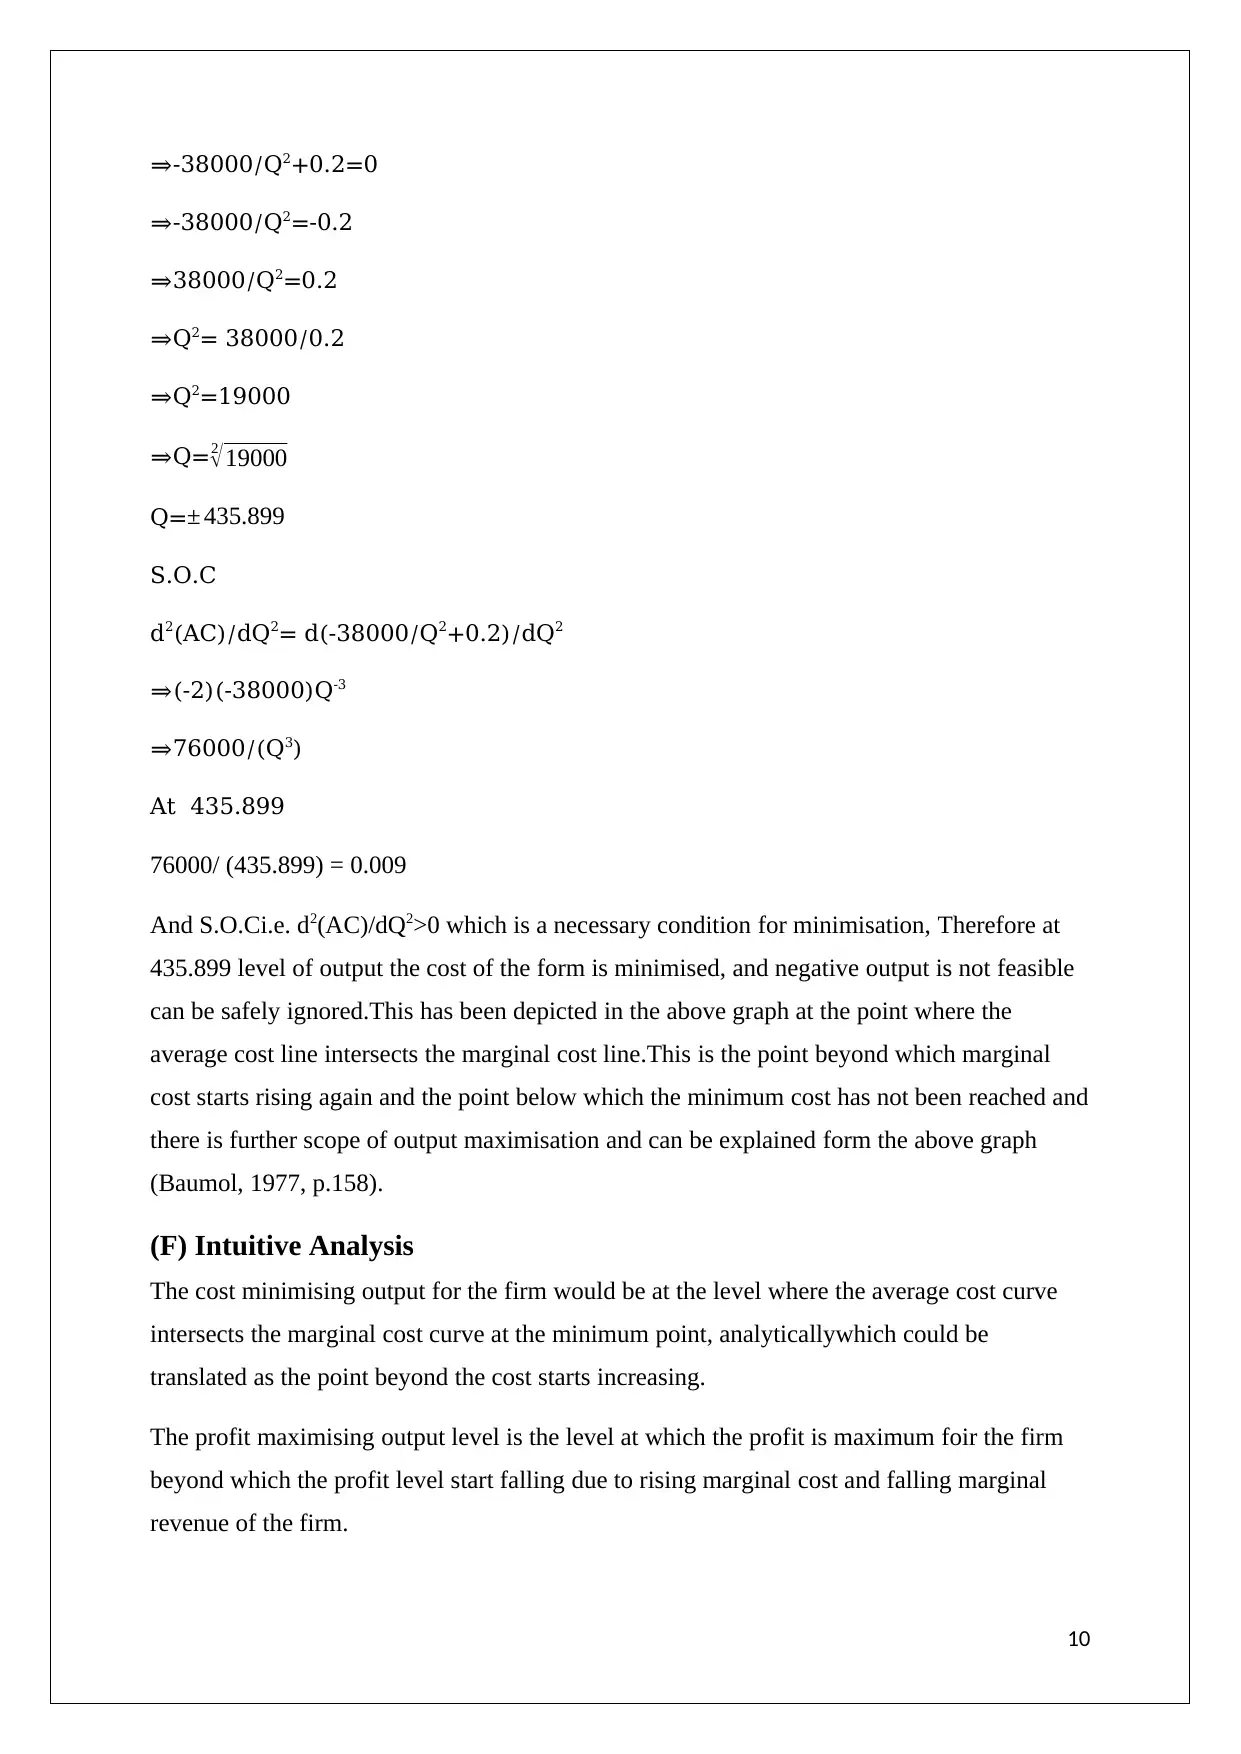
⇒-38000/Q2+0.2=0
⇒-38000/Q2=-0.2
⇒38000/Q2=0.2
⇒Q2= 38000/0.2
⇒Q2=19000
⇒Q=2
√19000
Q=± 435.899
S.O.C
d2(AC)/dQ2= d(-38000/Q2+0.2)/dQ2
⇒(-2)(-38000)Q-3
⇒76000/(Q3)
At 435.899
76000/ (435.899) = 0.009
And S.O.Ci.e. d2(AC)/dQ2>0 which is a necessary condition for minimisation, Therefore at
435.899 level of output the cost of the form is minimised, and negative output is not feasible
can be safely ignored.This has been depicted in the above graph at the point where the
average cost line intersects the marginal cost line.This is the point beyond which marginal
cost starts rising again and the point below which the minimum cost has not been reached and
there is further scope of output maximisation and can be explained form the above graph
(Baumol, 1977, p.158).
(F) Intuitive Analysis
The cost minimising output for the firm would be at the level where the average cost curve
intersects the marginal cost curve at the minimum point, analyticallywhich could be
translated as the point beyond the cost starts increasing.
The profit maximising output level is the level at which the profit is maximum foir the firm
beyond which the profit level start falling due to rising marginal cost and falling marginal
revenue of the firm.
10
Paraphrase This Document
Need a fresh take? Get an instant paraphrase of this document with our AI Paraphraser
Part B
a. Brief history of the international company Microsoft
Microsoft is a MNC (Multinational Company) based on computer technology (Şerban, 2014,
p.65). The history of establishment of Microsoft is related to the past when the bigwig
personalities Bill Gates and Paul Allen in Albuquerque founded the company in the 4th of
month of April in the year 1975.
Its founding members was responsible for the success of Microsoft in terms of the different
computer based products manufactured by it such as operating systems based software,
official documents based software like that of Microsoft Word and Microsoft Outlook and
different gaming and entertainment software like Xbox and popular search engines like Bing
(Norton & Baye, 2013, p.88).
In the year of 1980, Microsoft made a deal based on partnership based agreement with the
International computer manufacturing giant IBM(International Business Machines) in terms
of the condition that IBMwill get access to use of operating system produced by Microsoft
and other products in return of the favour that Microsoft will get the royalty for every
production related sales and marketing process of IBM. Microsoft Company was also
requested by IBMto write or create a new operating system for the variety of computers
based OS called OS/2 by IBMin terms of the deal (Sloman et al. 2013, p.33).
In this periodthe multinational company of Microsoft faced strict competition from the
substituteoperating systems of OS/2 operating in the market. The result of this competition
went in favour of Microsoft because of the personal operating system got the advantage of
the OS/2 based operating systems in terms technological advancement (Griffiths & Wall,
2011, p.55)
Microsoft flourished from the era when it started producing standardised quality of operating
systems such as that of Disk Operating System (DOS) whose manufacture brought the
company its real success. Till date, Microsoft is performing as the best leading company in
the business of computer operating systems and allied products though it faces a strict
competition from Google, a computer technology based contemporary company of similar
nature and potential as that of Microsoft.
11
b. Discussion of the nature of the market structure of Microsoft
Microsoft is a company which is based on monopoly based market structure in terms of its
nature and scope of business conduction and performance. Its monopoly based market
structure is the main reason for its success as a leader and pioneer manufacturing based
multinational company of international origin (Griffiths & Wall, 2011. p.23)
In order to discussin this regard we first need to understand the monopoly market structures
and the essentials of the frame work. Monopoly is a market structure where the businesses are
price setters and strategy based decisions of producing and selling products manufactured are
taken by the monopolist in the market. The monopoly market is based on the condition where
there is only one seller and many buyers in the market.As Monopolies are price-setters,
Monopolist sets its price above the market clearing price. This gives us an indication of a
very special feature of monopoly based market structure and it is that the goal or objective of
monopolist or monopoly firm is profit maximisation which it does by setting price above the
market clearing price or price where the price where marginal revenue is not necessarily
equivalent to the marginal cost which necessarily happens in the case of market clearing
equilibrium in perfectly competitive equilibrium condition (Mahoney and Qian, 2013,
p.1033). Thus the monopoly market has an imperfectly created market structure where price
set by the monopolist is equivalent to the marginal cost at the meeting point of marginal cost
and average revenue curve or demand curve. There is no supply curve in monopoly as a
single set of prices or price is charged for any varied quantity of goods manufactured in the
monopoly based market structure decided by the monopolist in terms of shift of average and
revenue curves rightwards when the quantity supplied is more at the similar price or when the
quantity supplied is less due to shift of the curves leftwards at the similar price. There is
hence no one to one correspondence or one to one relationship between prices sold and
quantity supplied in this variety of market framework. Monopoly market bas suggested in the
above mentioned illustrations belongs to market framework which is based on the aim of
maximisation of profits in terms of earning of supernormal profits that is profits earned in
excess of the normal or zero excess profits. The presence of excess capacities or non-ideal
capacities is the best outcome based on policy of profit maximisation strategy in monopoly
market. Process based on phenomenon of excess capacity in imperfect competition based
market structure of monopoly leads to improper allocation of total amount of industrial
resources and resource based capabilities allocated to the firm or industry beforehand. Further
there is no presence of freedom based on entry and exit of firms to and fro from the industry
12
⊘ This is a preview!⊘
Do you want full access?
Subscribe today to unlock all pages.
Trusted by 1+ million students worldwide
1 out of 21

Your All-in-One AI-Powered Toolkit for Academic Success.
+13062052269
info@desklib.com
Available 24*7 on WhatsApp / Email
![[object Object]](/_next/static/media/star-bottom.7253800d.svg)
Unlock your academic potential
Copyright © 2020–2026 A2Z Services. All Rights Reserved. Developed and managed by ZUCOL.