Competency Demonstration Report (CE 3): Distributed Generation Project

Verified

Added on  2020/05/16

|13
|1809
|194
Report
AI Summary
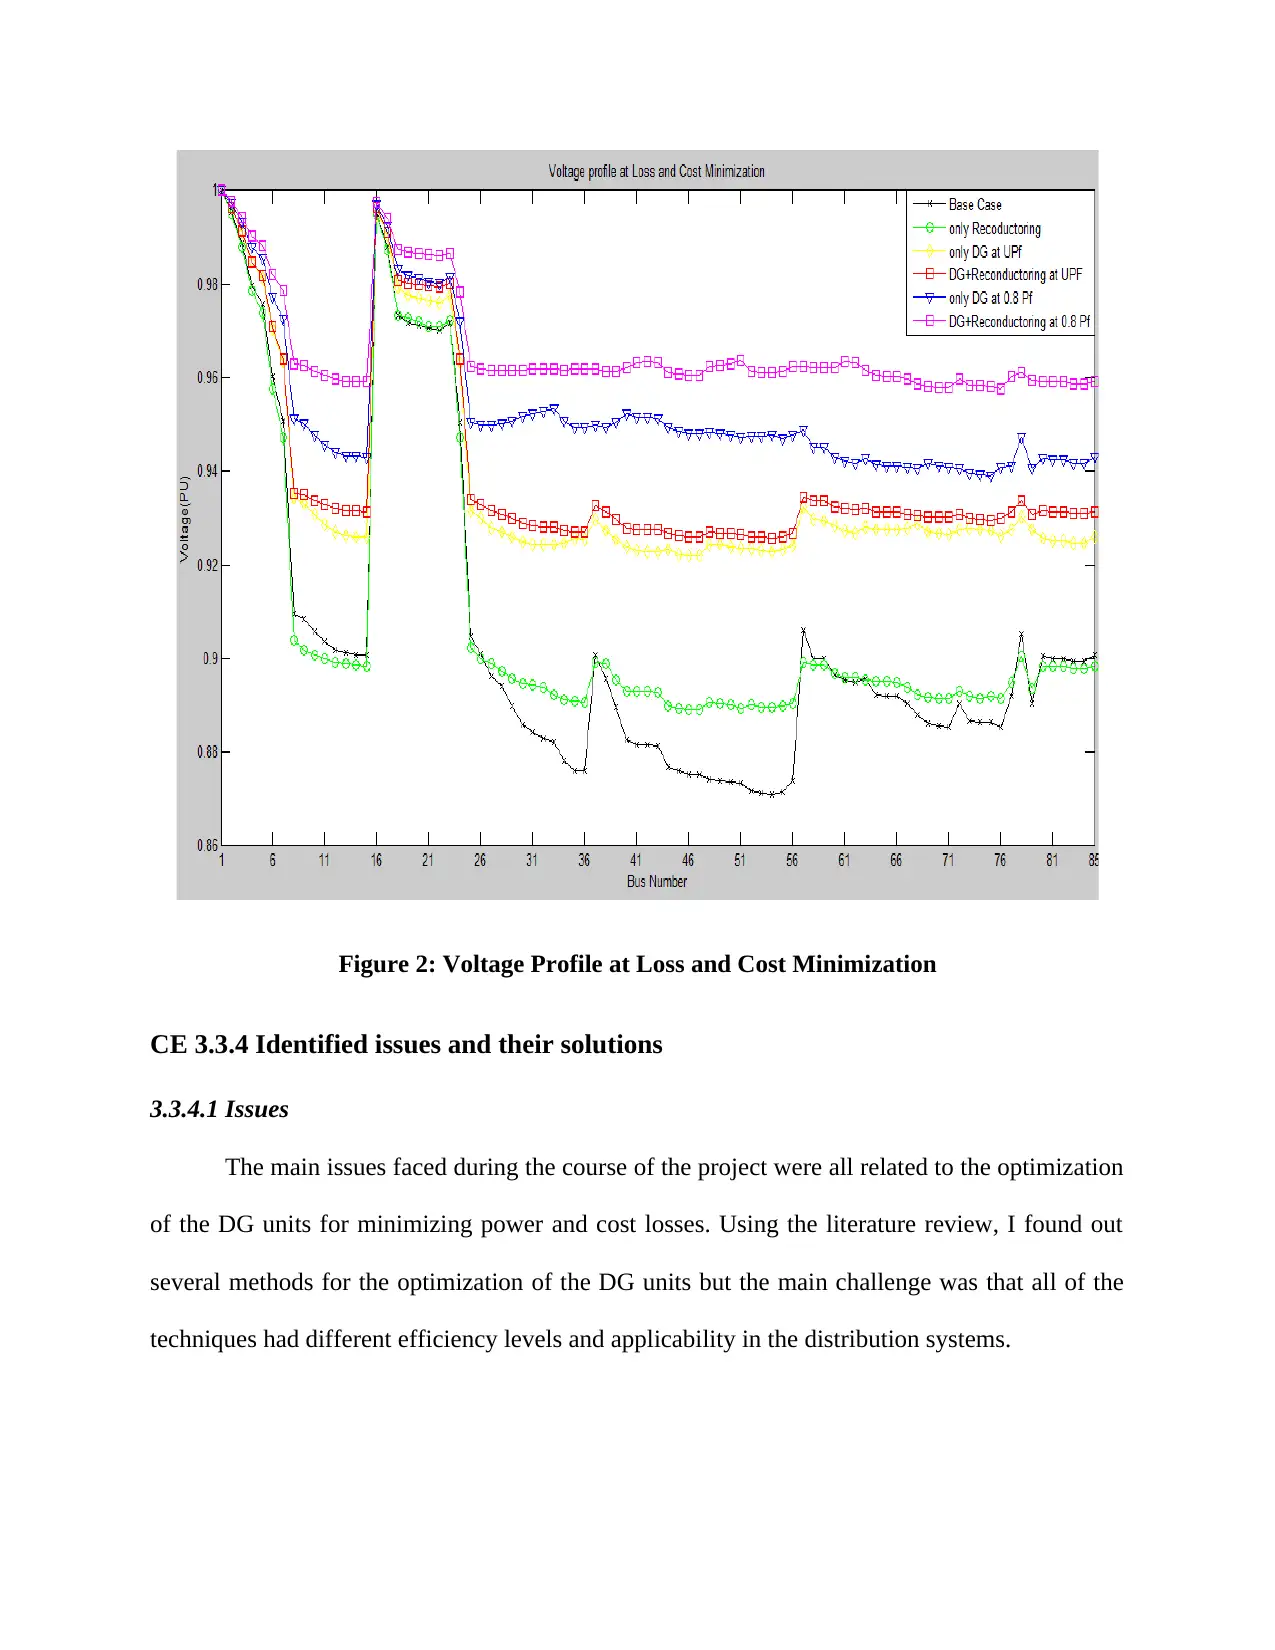
This report presents a competency demonstration (CE 3) detailing a student's project on distributed generation (DG) with reconductoring for loss and cost minimization. The project, conducted at the University College of Engineering Kakinada, India, involved developing a backtracking search algorithm (BSA) to optimize DG unit performance in a radial distribution system. The student, acting as an electrical engineer, applied MATLAB simulations on an 85-bus system to evaluate the algorithm's effectiveness. The project's objectives included conducting a literature review, determining optimal DG unit sizes, selecting appropriate conductors, and configuring the system to minimize power losses and costs. The student's responsibilities encompassed algorithm design, testing, and documentation, leading to the determination of voltage profiles and the development of cost and loss minimization equations. The project achieved significant results, including 96% loss reduction and 50% cost reduction, demonstrating the potential of the BSA approach. The report also discusses collaborative efforts and the student's contributions to the project's success, emphasizing the innovative application of the BSA to solve optimization problems in DG systems.
Document Page
COMPETENCY
DEMONSTRATION REPORT
Career Episode 3
SRI CHANDANA MUTHARAJU
tabler-icon-diamond-filled.svg

Secure Best Marks with AI Grader

Need help grading? Try our AI Grader for instant feedback on your assignments.
Document Page
CE 3.1 Project Information
Name of the project: Distributed Generation with Reconductoring for Loss and Cost
Minimization Using Back Track Search Algorithm
Location of the project: Kakinada, Andhra Pradesh, India
Project Duration: [PLEASE FILL]
Organization: University College of Engineering Kakinada (Autonomous)
Role and Designation during the time: Electrical and Electronics Engineer
CE 3.2 Project Background
CE 3.2.1 Characteristics of the project
The background of the project is based on the usage of electricity and its production,
especially specific to countries like India where the demand is currently greater than the actual
production. This issue is further aggravated by the fact that the production cannot be increased
significantly as the resources for the generation of electricity are limited. Hence, we figured that
the only way to deliver as much electricity as possible to the users if the electricity that is
generated is conserved by preventing significant losses encountered during distribution.
Our work in this project was mainly based on the installation and calibration of DG
(distributed generation) units for optimized performance. Furthermore, I tried to find a
revolutionary algorithm that will be able to backtrack search optimization especially in the radial
Document Page
distribution lines. We made some simulations on 85-bus systems in order to research and
evaluate the effectiveness of the new backtracking algorithm.
CE 3.2.2 Objectives developed for the project
The objectives that were developed for the project were as follows.
To conduct a literature review on the overall topic of the project
To find optimum size of the DG units in the radial distribution system
To make suitable selections of conductors to be used in the distribution system
To make suitable configurations for minimizing the power loss
To make suitable configurations for minimizing cost burden during the
distribution process
CE 3.2.3 My area of work
I was involved in the project as an electrical engineer and hence, I needed to express my
technical skills and knowledge for fulfilling the duties allocated to me. During my coursework in
college, I studied about the theories related to the topic and hence, in this project, I needed to
apply the knowledge gathered in practical work. I also applied creative design work related to
electrical engineering that helped me to complete all duties with success and gain positive
reviews from my supervisors.
Document Page
CE 3.2.4 Project Group
CE 3.2.5 My responsibilities throughout the project
In this project, we were a group of four and each one of the members had their own
duties and responsibilities. In addition, we needed to coordinate and help each other in order to
complete all the duties in time and with success.
In this project, my responsibilities included taking part in the literature review process,
designing the algorithm and testing the algorithm with the DG unit. I also needed to document
my works in the project report and submit it to the supervisor for review and appraisal.
tabler-icon-diamond-filled.svg

Secure Best Marks with AI Grader

Need help grading? Try our AI Grader for instant feedback on your assignments.
Document Page
CE 3.3 Distinctive Activity
CE 3.3.1 Comprehending the theory of the project
As a part of duties in the project, I developed the backtracking search optimization
algorithm (BSA) for solving the numerical optimization problems for the DG units. The structure
of the BSA that I developed was as follows.
I initialized the BSA with the following equation.
for i = 1,2,3,. . .,N and j = 1,2,3,. . .,D, where N and D are the population
size and the problem dimension, respectively, U is the uniform distribution and
Initialization
Repeat
2. Selection-1
Generation of Trial-Population
3. Mutation
4. Crossover
End
5. Selection-2
Until stopping conditions are met
5
Document Page
each Pi is a target individual in the population P. and are the lower and
upper limits of optimization problem.
CE 3.3.2 Engineering knowledge and skills applied in the project
For the development of the backtracking algorithm, I used MATLAB and I tested the
same on 85-bus radial distribution system. The parameters that I used for the design of the
algorithm were as follows.
BSA Parameters:
Population Size = 20
Dimension =
Maximum Iteration up to = 1000
Mix rate = 1
Network Data:
Base Voltage = 11kV
Base VA = 100MVA
Total Power Loss = 315.73kW
Total Reactive Power Loss =215.33kVAr
Minimum Voltage = 0.8710 PU
Line data and load data for 85-bus are presented in Appendix-A.
Cost Function Data:
Capital cost = 30e6 Rs./MW
Document Page
Plant load factor=0.8
Life time of the Plant = 20 Years
DG operation Cost per Unit (1st Year) = 2.923 Rs. /kWh
DG Cost per Unit (1st Year) = 3.686 Rs. /kWh
Discount Rate = 10%
Furthermore, I applied BSA in order to achieve optimal DG allocation with the process of
reconductoring. From the given parameters, I determined the following two equations for the
fitness functions of loss minimization and cost minimization respectively.
P =
OldP =
CE 3.3.3 Accomplishment and task performed
One of the main accomplishments of mine in this project was the determination of the
voltage profile that I established by using graphical plots using bus number and the voltage per
tabler-icon-diamond-filled.svg

Paraphrase This Document

Need a fresh take? Get an instant paraphrase of this document with our AI Paraphraser
Document Page
unit as the two axes of the graph. Using these, I generated the following graphs for loss and cost
minimization.
Figure 1: Voltage Profile at Loss Minimization
Document Page
Figure 2: Voltage Profile at Loss and Cost Minimization
CE 3.3.4 Identified issues and their solutions
3.3.4.1 Issues
The main issues faced during the course of the project were all related to the optimization
of the DG units for minimizing power and cost losses. Using the literature review, I found out
several methods for the optimization of the DG units but the main challenge was that all of the
techniques had different efficiency levels and applicability in the distribution systems.
Document Page
3.3.4.2 Solutions
Analyzing various optimization problems and the requirements for this project, I
determined that the best possible solution will be to apply the backtracking search optimization
algorithm due to a number of reasons. Firstly, it did not require additional costs or physical space
as the optimization was done using simulation algorithm only. Secondly, no manual monitoring
would be required as the optimization would be controlled by the algorithms. Finally, the
efficiency of optimization was very high; we were able to achieve 96% efficiency in loss
reduction and 50% in cost reduction.
CE 3.3.5 Plan to produce creative and innovative work
I exhibited significant creative and innovative work during determination of various
equations for loss and cost minimization during distribution of power. I developed several
equations for the same that were as follows.
Objective Function for Loss and Cost Minimization
Where,
n = Expected life time of the plant.
=Benefit at the year.
tabler-icon-diamond-filled.svg

Secure Best Marks with AI Grader

Need help grading? Try our AI Grader for instant feedback on your assignments.
Document Page
=Cost at the year.
=Capital cost.
d=Discount Rate,
S=Salvage cost.
Cost Function for DGs
Sig_DG = Sum of DG units
(Rs. /kWh)
Wh = Plant Load Factor × 8760.
= + Capital Cost
= +S+ +
Where
= (Power loss without DG – Power loss with DG)
= Cost per unit (Rs. /kWh)
Document Page
=
S = Salvage Cost = 10 % of Capital Cost.
= = (Capital Cost)
= Fuel Savings = ( – Capital Cost)
Cost Function for Reconductoring
= (4.12)
Where m = Number of Branches.
= (Power loss without Reconductoring – Power loss with Reconductoring)
= Cost per unit (Rs. /kWh)
Wh = 8760 × Load Factor.
=
Document Page
(4.13)
where S = Salvage Cost = 10 % of
CE 3.3.6 Collaborative work
Collaboration was an important requirement for performing duties in the project as all
four of our team members needed to help each in order to address issues and problems faced in
the project. The duties allocated to us were sufficiently tough and we could never have
completed them alone unless there was team coordination. Throughout the project, we worked as
one unit and we were able fulfil our duties in time and with success.
CE 3.4 Project Review
CE 3.4.1 Project Overview
The overall project was based on the optimization of DG units for conservation of
electricity during distribution. Our main target was to reduce the power losses as well as the
overall costs of transmission and distribution for more even supply of electricity. During the
testing phase of the project, I found out that we were able to achieve 96% loss reduction and
around 50% cost reduction with the help of the trackback algorithm that we designed. However,
this was only on a small scale and further research is required to apply the same algorithm
efficiently in a commercial scale but our project will definitely act as the starting point for further
research regarding minimization of losses and cost of power.
chevron_up_icon
1 out of 13
circle_padding
hide_on_mobile
zoom_out_icon
[object Object]