UTRP: Safety, Health, and Environment Research Report Analysis
VerifiedAdded on 2023/06/10
|15
|11820
|83
Report
AI Summary
This report, prepared for the Understanding the Research Process (UTRP) module, focuses on safety, health, and environment (SHE) issues, specifically electrical injuries in construction workers. It begins with a review of a published journal paper on injuries in the electric power industry, critically analyzing its methodology and findings. The report then delves into a literature review, discussing its importance in research and providing an overview of relevant research in the field. It differentiates between qualitative and quantitative data, providing examples and explaining their analysis. Various alternative research strategies, such as descriptive, applied, predictive, and exploratory approaches, are discussed. Finally, the report presents initial research ideas for improving SHE in construction, drawing upon the reviewed literature and data analysis to suggest potential areas for further investigation and targeted safety measures. The report underscores the significance of proactive safety measures based on data analysis to prevent fatalities and injuries, particularly in the electrical industry.
Safety, health and environment 1
Safety health and environment
Electrical injury in construction workers: a
special focus on injury with electrical power
Safety health and environment
Electrical injury in construction workers: a
special focus on injury with electrical power
Paraphrase This Document
Need a fresh take? Get an instant paraphrase of this document with our AI Paraphraser
Safety, health and environment 2
Contents
Review of published paper....................................................................................................................3
Literature Review..................................................................................................................................3
Analysis of Qualitative and Quantitative data.......................................................................................3
Alternative research strategies..............................................................................................................4
Descriptive research strategy:...........................................................................................................4
Applied research strategy:.................................................................................................................4
Predictive research strategy:.............................................................................................................4
Exploratory research strategy:...........................................................................................................4
Initial research ideas..............................................................................................................................4
References.............................................................................................................................................5
Safety, health and environment 3
Review of published paper
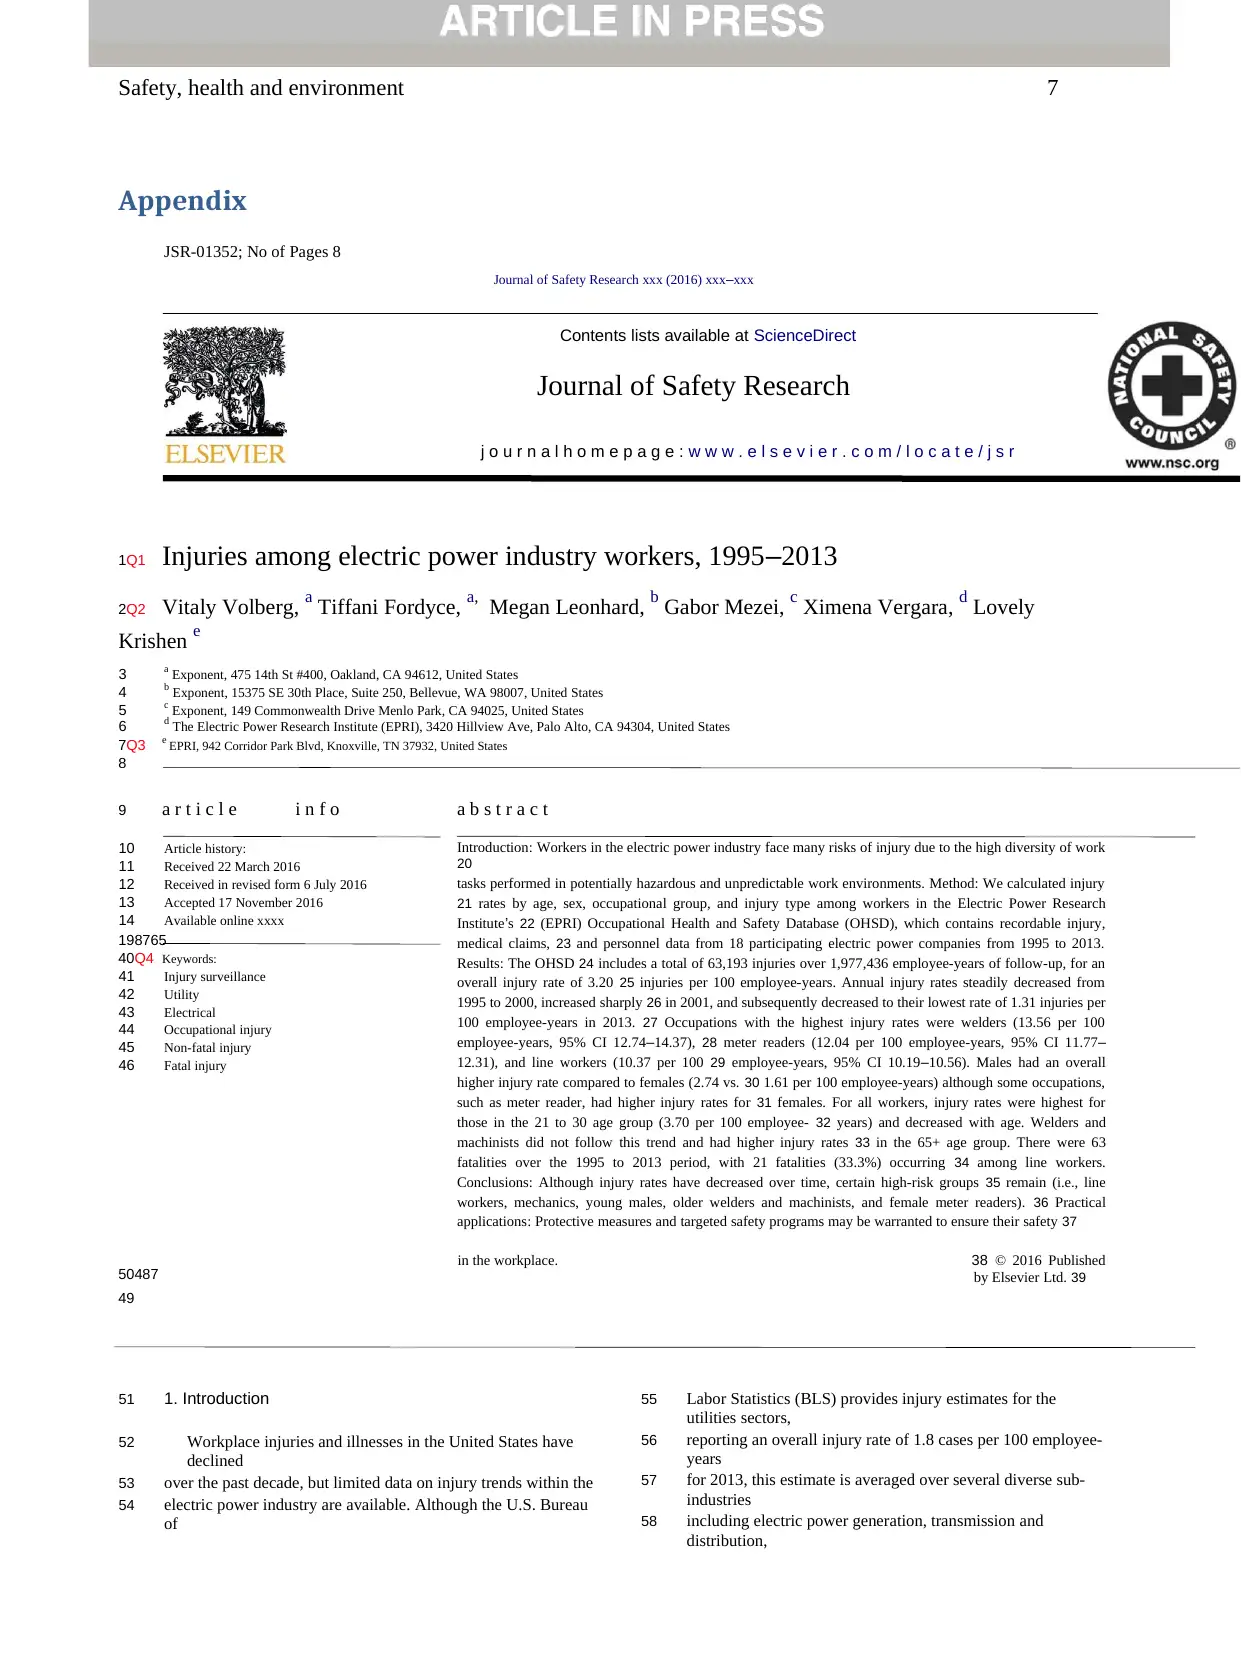
A journal paper with title name “Injuries among electric power industry workers, 1995-2013” was chosen.
This paper was published in “Journal of Safety Research”, volume 60 in 2016. This is the peer reviewed
journal which comes under Elsevier. The paper was written by Vitaly Volberga, Tiffani Fordycec, Megan
Leonhardb, Gabor Mezeic, Ximena Vergarad and Lovely Krishene. All of them are academic researcher
from United States. The paper is attached in the appendix.
According to the paper electric power industry has very unpredictable work environment. The workers
which are working there are in great danger. The work they do there is very risky and demanding. In this
paper analysis of the risks and safety measures were done on the basis of various surveys. The authors
divided the injuries caused in the past on the basis of age, sex, occupational group and injury type. For this
they chose the Electric Power Research Institute’s (EPRI) Occupational Health and Safety Database
(OHSD). In these database injuries, medical claims and personnel data was recorded from 18 different
countries. This data was from 1995 to 2013. In the result it was found that the injury rate was 3.20 injuries
per 100 employees in a year and it was decreasing by the year. It was 1.31 injuries per 100 employees in
the year 2013. It was found that according to the occupation, welders, meter readers and line workers
were most prone to injuries. Male workers were recorded with more injuries but in case of meter readers
women were more injured. Injury rate was higher among the workers of age group between 21 to 30
years. In case of welders and machinist workers who were older (65+), were more with injuries. In the end
it was suggested that targeted safety measures need to be taken based on the study. This can prevent
many fatalities and injuries for electric industry workers.
Literature Review
It is the research, observation and analysis of the work done in the area which we have chosen. It analyse
the literature available in the given topic. The main purpose of writing a literature review is to present the
literature in an organised way. It does not contain any new idea or original work. It tells us about the
previous and present research of our topic and what were their limitations.
It is very important to write literature review in the research because it tells us that about the research
that has already been done in the area which we have chosen for research. It also let the reader know
that the author has read the previous and present topics related to his research. A literature review saves
time by letting the author not to research on the same topic again.
There are many risks and injuries while working in an electrical company. They can produce serious
problems like cardiac arrhythmia, hypoxia, cardiopulmonary arrest and renal failure (Cooper and Price,
2002). If a person had an accident with electricity it can cause both psychological and neurological effects
which in turn can affect their life in a serious manner (Noble et al., 2006). The exposure to alternating
current is more dangerous as compared to direct current (Cooper, 1995). The exit wounds which are
caused by the current when it leaves the body are small of direct current as compared to alternating
current (Salehi et al.,2013). Young workers are more prone to injuries specially workers between the age
of 16 to 19 years (Janicak, 2008). In a research survey done by Lombardi and co-authors in 2009, it was
claimed that non-fatal injuries were 98.8% of the total cases of injuries. Another factor is that once the
Review of published paper
A journal paper with title name “Injuries among electric power industry workers, 1995-2013” was chosen.
This paper was published in “Journal of Safety Research”, volume 60 in 2016. This is the peer reviewed
journal which comes under Elsevier. The paper was written by Vitaly Volberga, Tiffani Fordycec, Megan
Leonhardb, Gabor Mezeic, Ximena Vergarad and Lovely Krishene. All of them are academic researcher
from United States. The paper is attached in the appendix.
According to the paper electric power industry has very unpredictable work environment. The workers
which are working there are in great danger. The work they do there is very risky and demanding. In this
paper analysis of the risks and safety measures were done on the basis of various surveys. The authors
divided the injuries caused in the past on the basis of age, sex, occupational group and injury type. For this
they chose the Electric Power Research Institute’s (EPRI) Occupational Health and Safety Database
(OHSD). In these database injuries, medical claims and personnel data was recorded from 18 different
countries. This data was from 1995 to 2013. In the result it was found that the injury rate was 3.20 injuries
per 100 employees in a year and it was decreasing by the year. It was 1.31 injuries per 100 employees in
the year 2013. It was found that according to the occupation, welders, meter readers and line workers
were most prone to injuries. Male workers were recorded with more injuries but in case of meter readers
women were more injured. Injury rate was higher among the workers of age group between 21 to 30
years. In case of welders and machinist workers who were older (65+), were more with injuries. In the end
it was suggested that targeted safety measures need to be taken based on the study. This can prevent
many fatalities and injuries for electric industry workers.
Literature Review
It is the research, observation and analysis of the work done in the area which we have chosen. It analyse
the literature available in the given topic. The main purpose of writing a literature review is to present the
literature in an organised way. It does not contain any new idea or original work. It tells us about the
previous and present research of our topic and what were their limitations.
It is very important to write literature review in the research because it tells us that about the research
that has already been done in the area which we have chosen for research. It also let the reader know
that the author has read the previous and present topics related to his research. A literature review saves
time by letting the author not to research on the same topic again.
There are many risks and injuries while working in an electrical company. They can produce serious
problems like cardiac arrhythmia, hypoxia, cardiopulmonary arrest and renal failure (Cooper and Price,
2002). If a person had an accident with electricity it can cause both psychological and neurological effects
which in turn can affect their life in a serious manner (Noble et al., 2006). The exposure to alternating
current is more dangerous as compared to direct current (Cooper, 1995). The exit wounds which are
caused by the current when it leaves the body are small of direct current as compared to alternating
current (Salehi et al.,2013). Young workers are more prone to injuries specially workers between the age
of 16 to 19 years (Janicak, 2008). In a research survey done by Lombardi and co-authors in 2009, it was
claimed that non-fatal injuries were 98.8% of the total cases of injuries. Another factor is that once the
⊘ This is a preview!⊘
Do you want full access?
Subscribe today to unlock all pages.
Trusted by 1+ million students worldwide
Safety, health and environment 4
worker is injured there are very less chances for them to return back to work (Wesner and Hickie, 2013;
Theman et al., 2008; Stergiou-Kita et al., 2014).
Analysis of Qualitative and Quantitative data
As the name itself suggest, the data which gives information about the quantity is called quantitative data
and the data which gives information about the quality of the data is called qualitative data. The
information that can be measured in the form of numbers falls into the category of quantitative data, for
example, number of electric companies, injuries caused to the workers in present year, etc. It deals with
the data which is generally in the form of how much and how many.
Qualitative data covers the quality of the information. In simpler terms, the data which cannot be
measured is called qualitative data. Examples of qualitative data are what type of injuries happens to
electric workers, what kind of workers are more prone to the injuries, etc. As it is seen from the examples
the data which is generally in the form of type of or kind of comes in the category of qualitative data.
According to the journal paper used in this report analysis were done for both qualitative and quantitative
data. Injuries calculated per year are the quantitative analysis of the data. They were analysed using
Poisson distribution, where upper and lower limits were analysed using Fleiss method. Analysis of injuries
based up on the occupational group was done qualitatively. For this, mechanism of injury and which body
part was affected with injury were analysed. Generally, qualitative analysis is non-statistical process and it
is required when in-depth knowledge of topic is provided, whereas, in case of quantitative analysis
statistical methods and tabulation method are used (Bryman, 2006).
Alternative research strategies
Apart from qualitative and quantitative research strategies can be of different types (Openlearn, 2018).
Some of them are discussed here:
Descriptive research strategy:
This strategy is used when giving the description of a situation. While describing the relation between the
growth of a plant with the amount of sunlight and water this strategy can be used.
Applied research strategy:
It is used by a company or government to find a solution of a problem, for example a research to find out
that what is the best scheme to motivate physically handicapped children.
Predictive research strategy:
It is used to predict that what will happen in the future. This is generally used by the companies to predict
the sale of their new product at special time and at the end of year.
Exploratory research strategy:
If a company is launching a new product into the market, they will need an idea, finance and a team to
learn about the market. In this case this type of research will be best suited.
Paraphrase This Document
Need a fresh take? Get an instant paraphrase of this document with our AI Paraphraser
Safety, health and environment 5
Initial research ideas
Environment, health and safety are very important aspects of any organization. They must be given equal
importance as compared to any other criterion. In case of construction workers it becomes very
important. Research ideas for their safety health and environment are given in various researches. As
discussed according to the journal paper that an analysis was done on the database of injuries of the
workers. This database was studied in detail and conclusions were drawn from it. For example according
to the research it was found that in case of meter readers, there were more injuries in women as
compared to men. Hence, special scheme or targeted policies can be formed to remove such injuries.
Similarly, it was found that in case of welders older workers were more prone to risks. Therefore, they can
be shifted to another division according to their age group.
Conclusion
A research process is used to propose a research idea, literature review, implement that idea, applying
any research methodology and finding the results. In this assignment, a research paper related to electric
injuries was selected which was critically analysed. After that a literature review was presented to find out
the work done in that area. It was found that most of the workplaces lack safety measures. Previous years
data was collected and then both qualitative and quantitative analysis was done. Other research
strategies were explained with example. The importance of targeted safety measures at electric industries
was explained in the initial research idea.
Safety, health and environment 6
References
Bryman, A. (2006) Integrating quantitative and qualitative research: how is it done? Sage journals, 6(1),
pp. 97-113
Cooper, M.A. (1995) Emergent Care in Lightning and Electrical Injuries. Seminars in Neurology, 15, pp.
268-278.
Cooper, M.A. and Price, T.G. (2002) Electrical and Lightning Injuries. 5th ed. St.Louis, MO.
Janicak ,C.A. (2008) Occupational Fatalities Due to Electrocution in the Construction Industry. Journal of
Safety Research, 39, pp. 617-621.
Noble, J., Gomez, M., and Fish, J.S. (2006) Quality of Life and Return to Work Following Electrical Burns.
Burns, 32, pp. 159-164.
Openlearn, (2018) Understanding different research perspectives [online] Available from:
http://www.open.edu/openlearn/money-management/understanding-different-research-perspectives/
content-section-6 [Accessed 15/06/2018].
Salehi, S.F., Fatemi, M.J., Asadi, K., Shoar, S., Ghazarian, A.D. and Samimi, R. (2014) Electrical Injury in
Construction Workers: A Special Focus on Injury with Electrical Power. Burns, 40, pp. 300-304.
Stergiou-Kita, M., Mansfield, E., Bayley, M., Cassidy, J.D., Colantonio, A., Gomez, M., Jeschke, M., Kirsh, B.,
Kristman, V., Moody, J. and Vartanian, O. (2014) Return to Work After Electrical Injuries: Workers’
Perspectives and Advice to Others. Journal of Burn Care Research, 35, pp. 498-507.
Theman, K., Singerman, J., Gomez, M., and Fish, J.S. (2008) Return to Work After Low-Voltage Electrical
Injury. Journal of Burn Care Research, 6, pp. 959-964.
Wesner, M.L. and Hickie, J. (2013) Long-Term Sequelae of Electrical Injury. Canadian Family Physician, 59,
pp. 935-939.
⊘ This is a preview!⊘
Do you want full access?
Subscribe today to unlock all pages.
Trusted by 1+ million students worldwide
Safety, health and environment 7
Appendix
JSR-01352; No of Pages 8
Journal of Safety Research xxx (2016) xxx–xxx
Contents lists available at ScienceDirect
Journal of Safety Research
j o u r n a l h o m e p a g e : w w w . e l s e v i e r . c o m / l o c a t e / j s r
1Q1 Injuries among electric power industry workers, 1995–2013
2Q2 Vitaly Volberg, a Tiffani Fordyce, a, Megan Leonhard, b Gabor Mezei, c Ximena Vergara, d Lovely
Krishen e
3 a Exponent, 475 14th St #400, Oakland, CA 94612, United States
4 b Exponent, 15375 SE 30th Place, Suite 250, Bellevue, WA 98007, United States
5 c Exponent, 149 Commonwealth Drive Menlo Park, CA 94025, United States
6 d The Electric Power Research Institute (EPRI), 3420 Hillview Ave, Palo Alto, CA 94304, United States
7Q3 e EPRI, 942 Corridor Park Blvd, Knoxville, TN 37932, United States
8
9 a r t i c l e i n f o
10 Article history:
11 Received 22 March 2016
12 Received in revised form 6 July 2016
13 Accepted 17 November 2016
14 Available online xxxx
198765
40Q4 Keywords:
41 Injury surveillance
42 Utility
43 Electrical
44 Occupational injury
45 Non-fatal injury
46 Fatal injury
50487
49
a b s t r a c t
Introduction: Workers in the electric power industry face many risks of injury due to the high diversity of work
20
tasks performed in potentially hazardous and unpredictable work environments. Method: We calculated injury
21 rates by age, sex, occupational group, and injury type among workers in the Electric Power Research
Institute’s 22 (EPRI) Occupational Health and Safety Database (OHSD), which contains recordable injury,
medical claims, 23 and personnel data from 18 participating electric power companies from 1995 to 2013.
Results: The OHSD 24 includes a total of 63,193 injuries over 1,977,436 employee-years of follow-up, for an
overall injury rate of 3.20 25 injuries per 100 employee-years. Annual injury rates steadily decreased from
1995 to 2000, increased sharply 26 in 2001, and subsequently decreased to their lowest rate of 1.31 injuries per
100 employee-years in 2013. 27 Occupations with the highest injury rates were welders (13.56 per 100
employee-years, 95% CI 12.74–14.37), 28 meter readers (12.04 per 100 employee-years, 95% CI 11.77–
12.31), and line workers (10.37 per 100 29 employee-years, 95% CI 10.19–10.56). Males had an overall
higher injury rate compared to females (2.74 vs. 30 1.61 per 100 employee-years) although some occupations,
such as meter reader, had higher injury rates for 31 females. For all workers, injury rates were highest for
those in the 21 to 30 age group (3.70 per 100 employee- 32 years) and decreased with age. Welders and
machinists did not follow this trend and had higher injury rates 33 in the 65+ age group. There were 63
fatalities over the 1995 to 2013 period, with 21 fatalities (33.3%) occurring 34 among line workers.
Conclusions: Although injury rates have decreased over time, certain high-risk groups 35 remain (i.e., line
workers, mechanics, young males, older welders and machinists, and female meter readers). 36 Practical
applications: Protective measures and targeted safety programs may be warranted to ensure their safety 37
in the workplace. 38 © 2016 Published
by Elsevier Ltd. 39
51 1. Introduction
52 Workplace injuries and illnesses in the United States have
declined
53 over the past decade, but limited data on injury trends within the
54 electric power industry are available. Although the U.S. Bureau
of
55 Labor Statistics (BLS) provides injury estimates for the
utilities sectors,
56 reporting an overall injury rate of 1.8 cases per 100 employee-
years
57 for 2013, this estimate is averaged over several diverse sub-
industries
58 including electric power generation, transmission and
distribution,
Paraphrase This Document
Need a fresh take? Get an instant paraphrase of this document with our AI Paraphraser
Safety, health and environment 8
59 natural gas distribution, and water sewage systems, which are
likely
60 to have differing occupational hazards and associated risks (U.S.
61 Bureau of Labor Statistics, 2013). Further, little is known about
specific
62 risk factors and vulnerable sub-populations that may have
particularly
63 high injury rates within the electric power industry.
Corresponding author.
E-mail address: tfordyce@exponent.com (T. Fordyce).
http://dx.doi.org/10.1016/j.jsr.2016.11.001
0022-4375/© 2016 Published by Elsevier Ltd.
The current analysis uses data gathered by the Electric Power 64
Research Institute (EPRI) Occupational Health and Safety Database
65 (OHSD) and is intended to update and expand upon an earlier
publica- 66 tion characterizing injuries in the electric power industry
(Kelsh et al., 67 2004). The OHSD program has been described
previously (EPRI, 2012, 68 2015; Kelsh et al., 2004; Yager, Kelsh,
Zhao, & Mrad, 2001). Briefly, the 69 OHSD was created in 1999 to
provide more detailed information 70 about the occurrence of
workplace injury among workers in the electric 71 power industry
(EPRI, 2001, 2004; Kelsh et al., 2004; Yager et al., 2001). 72 Its main
objectives are to: (a) monitor trends of injury and illness over 73 time,
across job characteristics, and worker demographics; (b) identify 74
high-risk occupations and work environments; (c) quantify costs and
75 lost time caused by work-related injuries and illnesses; (d) identify
76 and prioritize injury/illness issues that merit focused research
efforts; 77
and (e) evaluate the effectiveness of prevention programs. 78
Workers in the electric power industry face many potential risks of 79
injury, including injuries from hazardous and unpredictable work
envi- 80 ronments, physically demanding maintenance and repair
activities, 81
Please cite this article as: Volberg, V., et al., Injuries among electric power industry workers, 1995–2013, Journal of Safety Research
(2016), http:// dx.doi.org/10.1016/j.jsr.2016.11.001
Safety, health and environment 9
2 V. Volberg et al. / Journal of Safety Research xxx (2016) xxx–xxx
82 working long shifts, working in emergency situations, and driving. The
83 initial report using EPRI OHSD data was based on 528,133 employee-
84 years and 11,166 injuries over the 1995 to 2002 period and identified
85 welders, meter readers, and line workers at highest risk of injury
86 (Kelsh et al., 2004). Subsequent publications using OHSD data charac-
87 terized risks, risk factors, and costs associated with thermal burns and
88 neck injuries and factors distinguishing severity of sprain and strain
89 injuries among electric utility workers (Fordyce, Kelsh, Lu, Sahl, &
90 Yager, 2007; Fordyce, Morimoto, Coalson, Kelsh, & Mezei, 2010; Kelsh
91 et al., 2009).
92 The goals of the current analyses were to characterize injury and
93 illness rates using the current OHSD data, which includes a total of
94 1,977,436 employee-years and 63,193 recordable injuries over the
95 1995 to 2013 time-period. We examined injury rates over time and by
96 age, sex, and occupation, to determine risk factors for injury and identify
97 vulnerable sub-populations with high injury rates.
98 2. Methods
99 Definitions, classification methodology, and data standardization
100 methodology used in the OHSD have been previously described in detail
101 (EPRI, 2012, 2015; Kelsh et al., 2004; Yager et al., 2001). In brief, the
102 OHSD currently includes data from 18 companies, comprising a total
103 of 1,977,436 employee-years of follow up and 63,193 reportable indi-
104 vidual injuries. Participation in the EPRI OHSD program is voluntary.
105 Both small and large companies are present in the database with
106 the five largest companies comprising over 60% of all workers. Three
107 categories of data, including personnel files, reportable injury files, and
108 medical claim files were requested from each participating electric
109 power company and compiled to generate the EPRI OHSD data set.
110 Employee date of birth, sex, hire date, job code, job title, and work loca-
111 tion or business unit were abstracted from company personnel files for
112 each of the study years 1995 to 2013 and each employee was assigned a
113 unique identifier. Occupation and work location were defined by the
114 employee’s record status on January 1 of any particular year and entered
115 into the database.
116 Basic work history and demographic data for all company em-
117 ployees and not just injured employees were used to calculate injury
118 rates. In addition to personnel data, injury event information (location,
119 accident description, injury mechanism), data about the injury itself
120 (body region, nature of injury), and claims information (work days
121 lost, medical costs) were requested and incorporated into the database.
122 Location refers to a worker’s primarily work location and may or may
123 not represent where an injury took place. A standardized coding system
124 for injury mechanism was developed using a combination of injury
125 source codes (e.g., vehicle collision, fall, “struck by”) and data contained
126 in accident descriptions. The mechanism of injury classification charac-
127 terizes the event leading to the worker’s injury and usually represents
128 the immediate or preceding cause based on temporality; however, the
129 mechanism of injury may or may not represent the underlying or
130 preventable cause. Data for nature of injury and body region injured
131 were coded and classified into a standard common format based pri-
132 marily on Bureau of Labor Statistics guidelines (EPRI, 2001). The OHSD
133 contains 26 categories for nature of injury (e.g., sprains and strains, frac-
134 tures and dislocations, heat and thermal burns) and 15 categories for
135 body region injured (e.g., back and trunk, hand and finger). From over
136 35,000 unique reported job titles, we created 22 specific job categories
137 using an occupational classification system previously developed for
138 electric power industry workers (Kelsh, Kheifets, & Smith, 2000).
139 Unclassifiable primary work location codes and missing nature of injury
140 and injured body region information were updated based on a thorough
141 review of the narrative accident description when the relevant informa-
142 tion was provided.
143 All reported lost time and “recordable” injury/illness claims have
144 been included in the injury analyses. The Occupational Safety and
145 Health Administration (OSHA) definition of a “lost time injury or illness”
requires that a worker miss one full day of work (or shift) after the 146 injury date.
An OSHA recordable injury involves medical attention 147 “beyond first aid” or
loss of consciousness or results in days away 148 from work, restricted work
activity, or job transfer. Because some 149
utilities could not provide reports on less severe, first-aid-only, or 150
non-injury events, the EPRI OHSD database excludes such data. 151
To ensure data confidentiality, the OHSD program policy restricts 152 use of
the data to peer-reviewed health and safety research proposals 153 only and does
not distribute personnel and individual records. In 154 addition, all personal
identifiers were removed from data records and 155 the name of each participating
company was replaced with generic 156
identifiers. 157
3. Statistical analyses 158
Injury rates are expressed as the number of injuries and illnesses per 159
100 employees during a year of follow-up. The rate per 100 employee- 160 years
is equivalent to that used for OSHA reporting purposes, which 161 estimates rates
per 200,000 work hours (OSHA 300 rate). Although 162 injury rates estimate the
relative occurrence and risk of injury, they do 163 not directly reflect the severity
of an injury. Time lost from work, mea- 164 sured by full time equivalents (FTEs),
can be used as a proxy to examine 165 injury severity. FTEs lost was defined as
the total number of days lost 166 divided by 240 workdays which assumes an
average of four weeks off 167 per year for workers (Kelsh et al., 2004). For
recordable injuries where 168 no lost time was reported, 0.002 FTEs lost, which is
equivalent to one 169 half day lost, was assigned to represent an approximate
midpoint of 170 the potential time away from work. Fatality rates are expressed
per 171
100,000 employee-years. 172
To date, six companies have provided data for the entire 19-year 173 period.
Six additional companies have provided data for the majority 174 of the past 10
years. One company (Company N) provided only total 175 employee data for the
1995 to 1999 period and did not report demo- 176 graphic or job description data.
Thus, data for company N for this period 177 are excluded from rate calculations,
with the exception of overall OHSD 178
injury rates. 179
Given the deviance criteria (degrees of freedom ratio close to one) 180
and the dispersion estimate criteria (over-dispersion parameter equal 181
to zero), the calculation of confidence intervals assumes an underlying 182
Poisson distribution. Upper and lower 95% confidence limits were esti- 183
mated using the methods described by Fleiss (Fleiss, 1981). To investi- 184
gate injury trends over time, a Poisson regression model was fit to the 185 data,
adjusting for the observation time per year. For trends in FTE loss 186 rates over
time, a negative binomial regression model fit the data best 187 based on deviance
and dispersion estimate criteria. To address the 188 sex-specific differences in
injury rates between occupations, we per- 189 formed an age-adjusted Mantel–
Haenszel analysis to estimate injury- 190 rate ratios by occupation (Fleiss, 1981).
For the three occupations with 191 the highest injury rates, mechanisms of injury
and body regions of 192 injury were analyzed. Additionally, an analysis of injury
by seasons 193 was performed. We defined winter as December through February,
194 spring as March through May, summer as June through August, and 195
fall as September through November. 196
4. Results 197
The majority of electric power industry workers were male (73.4%), 198
providing a total of 1,451,143 employee-years of observation (Table 1). 199
Female workers accounted for 22.9% of the workforce and 452,260 200
employee-years. Sex was not reported for 3.7% of the study population. 201 The
majority of workers were between 41 and 60 years of age (58.9%), 202 with
31.1% of the workforce 40 years or younger and only 5.4% 203
61 years or older. 204
The most common injury type was sprains and strains, accounting 205 for
40.9% of all injuries (Table 2). Sprains and strains were the primary 206
contributor to reported medical costs at 43.7%. Although representing 207
Please cite this article as: Volberg, V., et al., Injuries among electric power industry workers, 1995–2013, Journal of Safety Research (2016), http://
dx.doi.org/10.1016/j.jsr.2016.11.001
⊘ This is a preview!⊘
Do you want full access?
Subscribe today to unlock all pages.
Trusted by 1+ million students worldwide
Safety, health and environment 10
V. Volberg et al. / Journal of Safety Research xxx (2016) xxx–xxx 3
t1:1 Table 1
t1:2 Distribution of sex and age, EPRI OHSD 1995–2013.
t1:3 Employee-years Percentage of OHSD
t1:4 Sex
t1:5 Female 425,260 22.9
t1:6 Male 1,451,143 73.4
t1:7 Unknown 74,033 3.7
t1:8 Age group (years)t1:9
t1:10 b20 14,944 0.8
t1:11 21–30 202,767 10.3
t1:12 31–40 396,159 20.0
t1:13 41–50 621,654 31.4
t1:14 51–60 544,667 27.5
t1:15 61–65 75, 898 3.8
t1:16 65+ 31,571 1.6
t1:17 Unknown 89,776 4.5
t2:1 Table 2
t2:2 Distribution of injuries and medical costs, EPRI OHSD 1995–2013.
t2:3 Injury type Percentage of Injuries Percent of Medical Costs
t2:4 Sprains, strains 40.9% 43.7%
t2:5 Cut, laceration, puncture 16.0% 4.2%
t2:6 Contusion, bruise 9.0% 4.2%
t2:7 Scratches, abrasions 5.7% 0.7%
t2:8 Fracture/dislocation 5.5% 12.3%
t2:9 CTD/RSI 4.7% 10.9%
t2:10 Hearing loss or impairment 3.0% 0.9%
t2:11 Bite 3.0% 0.2%
t2:12 Respiratory 2.2% 0.4%
t2:13 Dermatitis/skin 1.4% 0.2%
t2:14 Burn heat/thermal 1.3% 2.9%
t2:15 Burn, flashburn 0.7% 8.4%
t2:16 Electric shock, electrocution 0.6% 2.4%
t2:17 CTD/RSI Carpal Tunnel Disorder/Repetitive Stress Injury.
208 only 2.0% of injuries, burns had the highest cost per incident, accounting
209 for 11.3% of total medical costs.
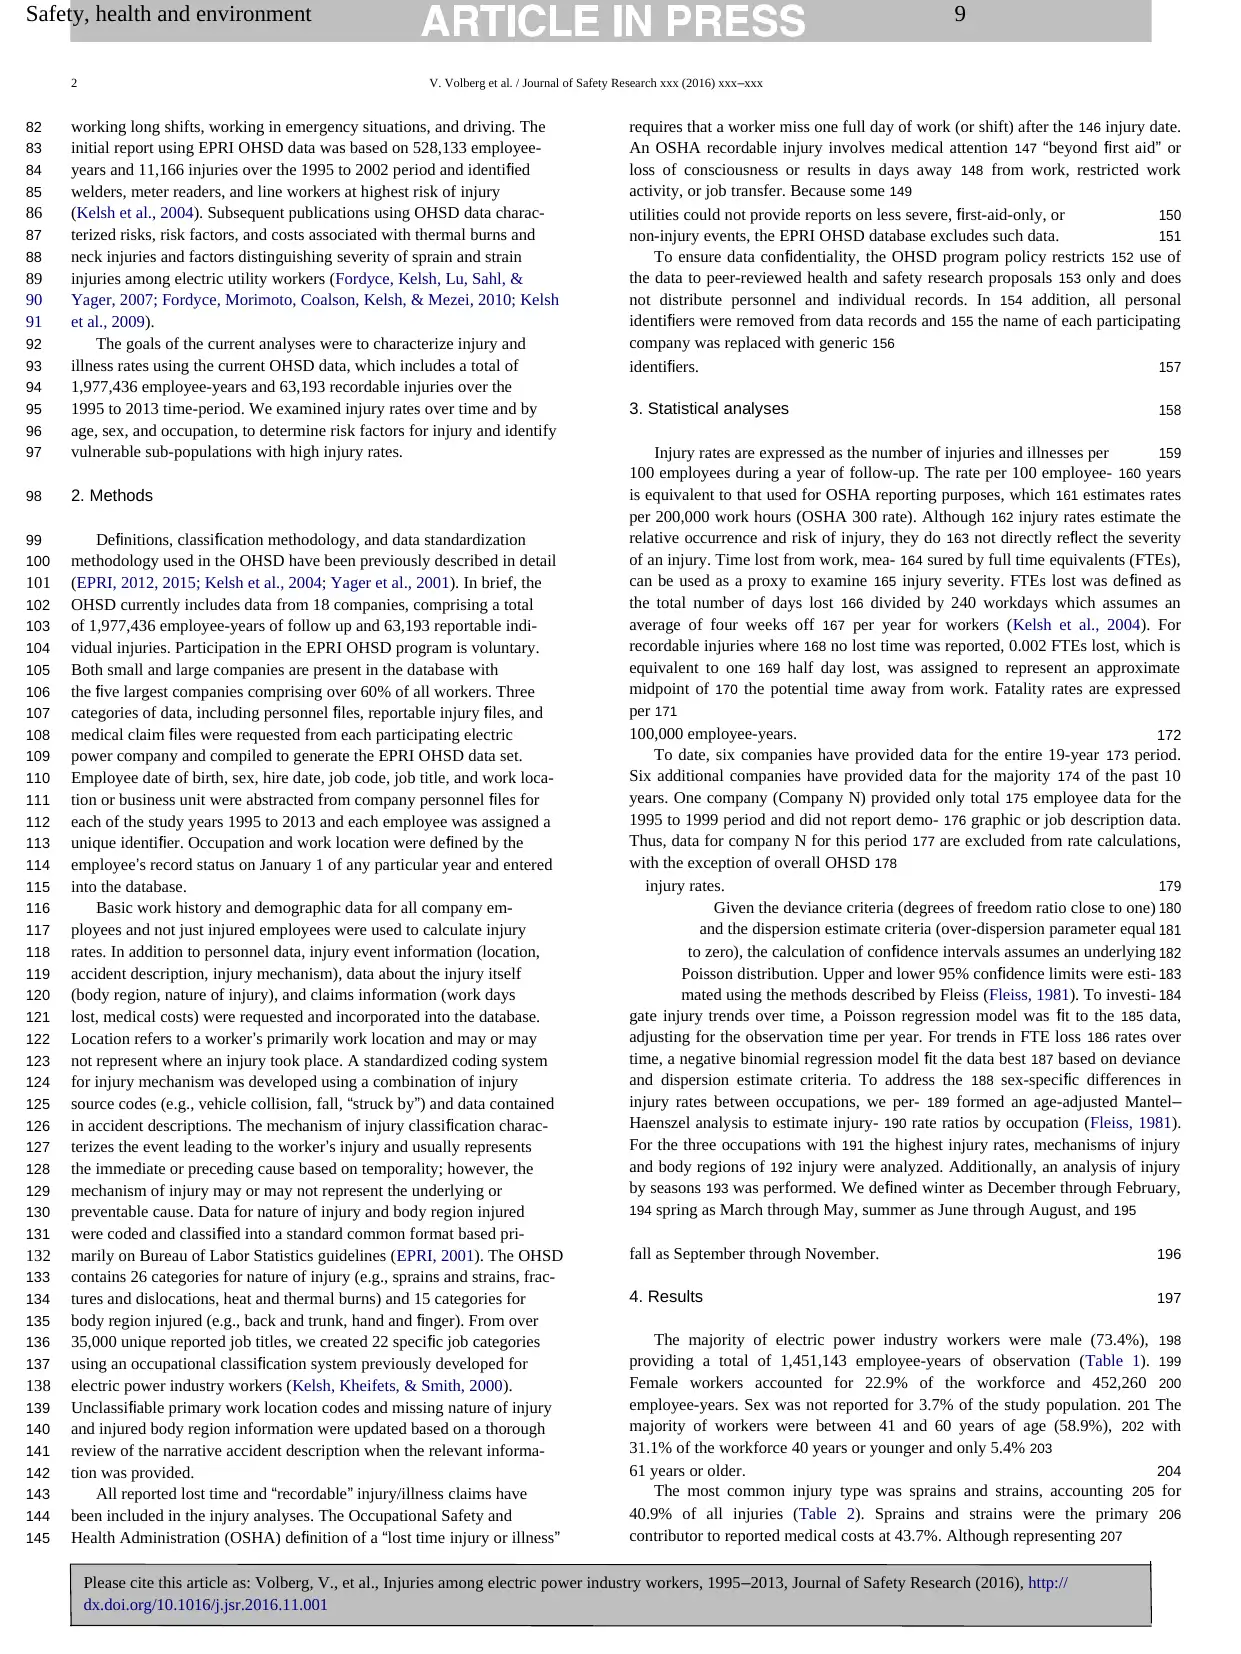
210 Commonly affected body regions were back and trunk (17.8%); hand
211 and finger (14.3%); head (excluding eyes, 9.9%); upper extremities,
212 including arm, forearm and elbow (8.3%); neck and shoulder (8.2%);
213 and knees (8.0%) (Fig. 1). There was a statistically significant increase
214 in the proportion of injuries to the head, excluding eyes, with increasing
215 age (pb0.01). The unadjusted distributions of injuries were similar
216 between males and females, with a few notable exceptions. Injuries to
217 the wrist and upper extremities were more frequent among female
workers (14.1% and 12.2% vs. 3.3% and 8.1%, respectively), while injuries 218 to
the back and trunk (17.5% vs. 12.6%), head (11.1% vs. 4.6%), and eyes 219
(5.0% vs. 1.8%) were more frequent among male workers. 220
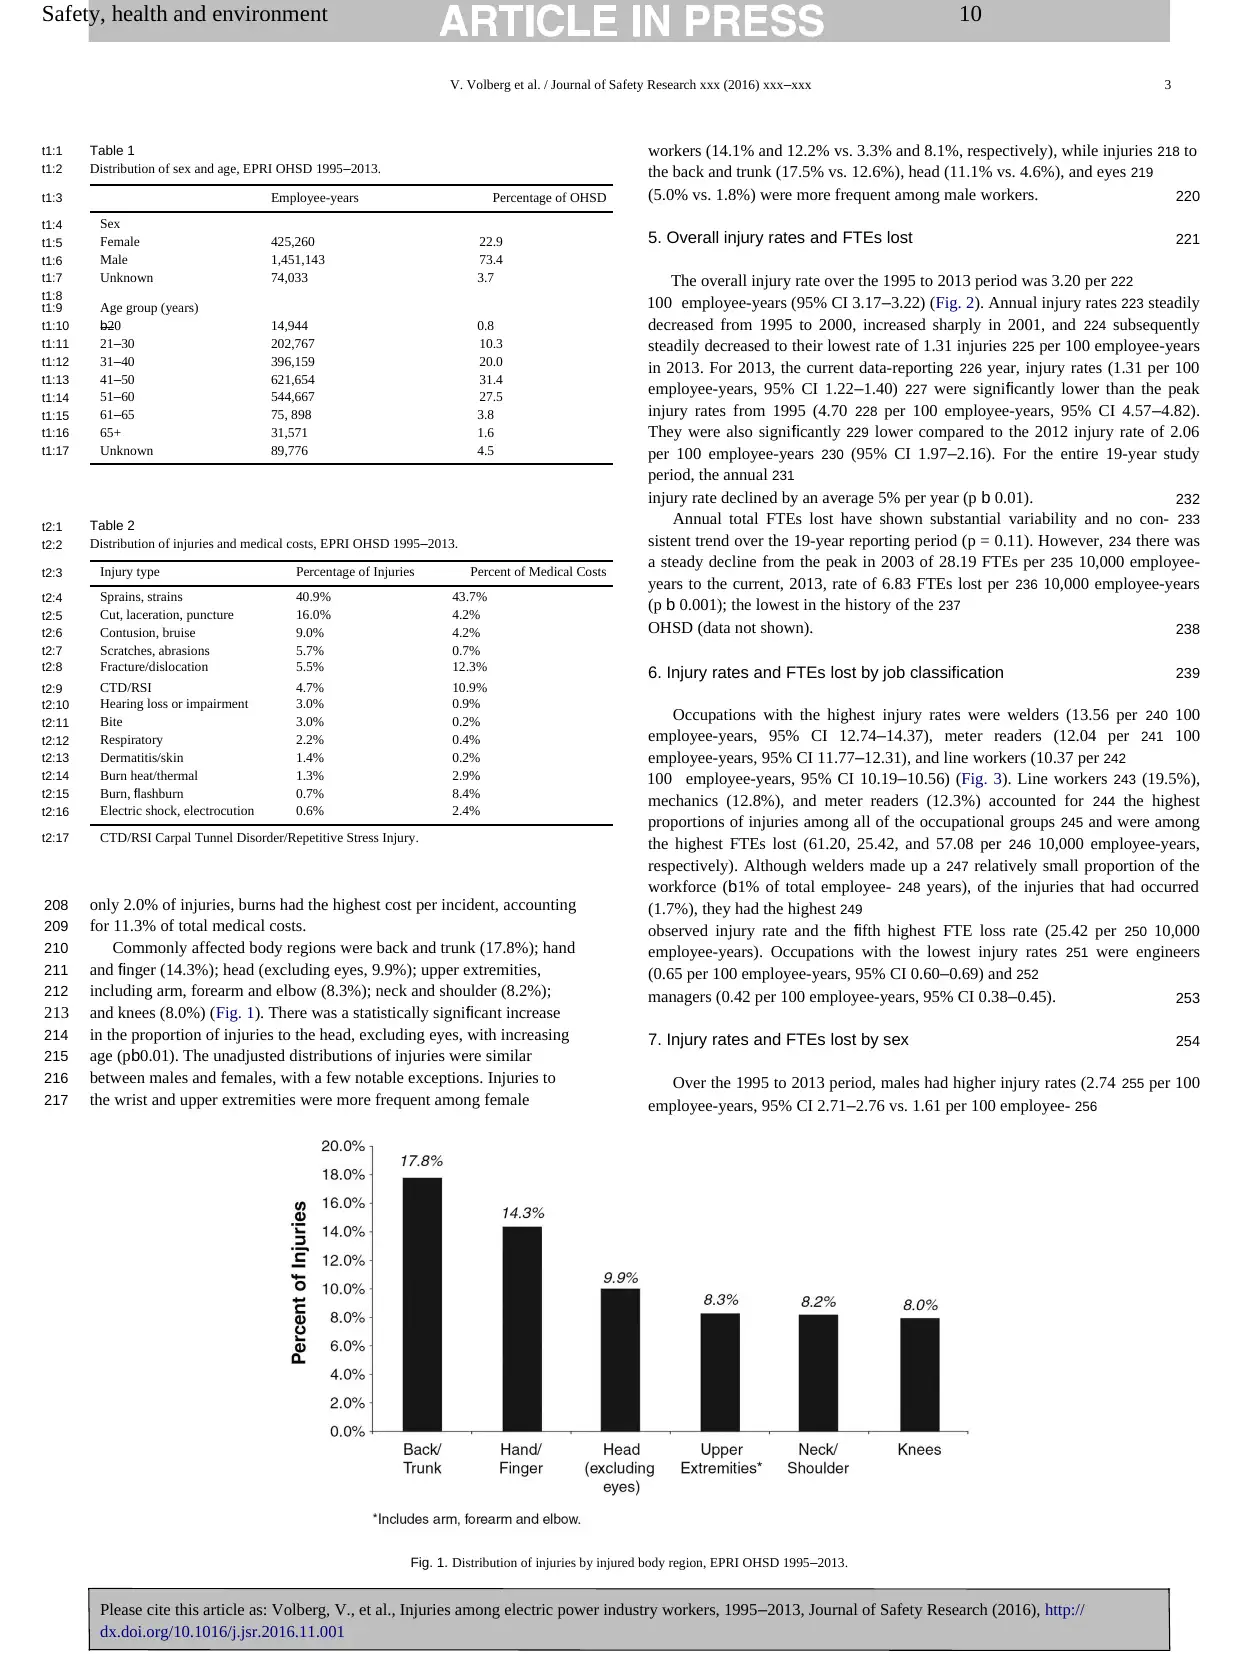
5. Overall injury rates and FTEs lost 221
The overall injury rate over the 1995 to 2013 period was 3.20 per 222
100 employee-years (95% CI 3.17–3.22) (Fig. 2). Annual injury rates 223 steadily
decreased from 1995 to 2000, increased sharply in 2001, and 224 subsequently
steadily decreased to their lowest rate of 1.31 injuries 225 per 100 employee-years
in 2013. For 2013, the current data-reporting 226 year, injury rates (1.31 per 100
employee-years, 95% CI 1.22–1.40) 227 were significantly lower than the peak
injury rates from 1995 (4.70 228 per 100 employee-years, 95% CI 4.57–4.82).
They were also significantly 229 lower compared to the 2012 injury rate of 2.06
per 100 employee-years 230 (95% CI 1.97–2.16). For the entire 19-year study
period, the annual 231
injury rate declined by an average 5% per year (p b 0.01). 232
Annual total FTEs lost have shown substantial variability and no con- 233
sistent trend over the 19-year reporting period (p = 0.11). However, 234 there was
a steady decline from the peak in 2003 of 28.19 FTEs per 235 10,000 employee-
years to the current, 2013, rate of 6.83 FTEs lost per 236 10,000 employee-years
(p b 0.001); the lowest in the history of the 237
OHSD (data not shown). 238
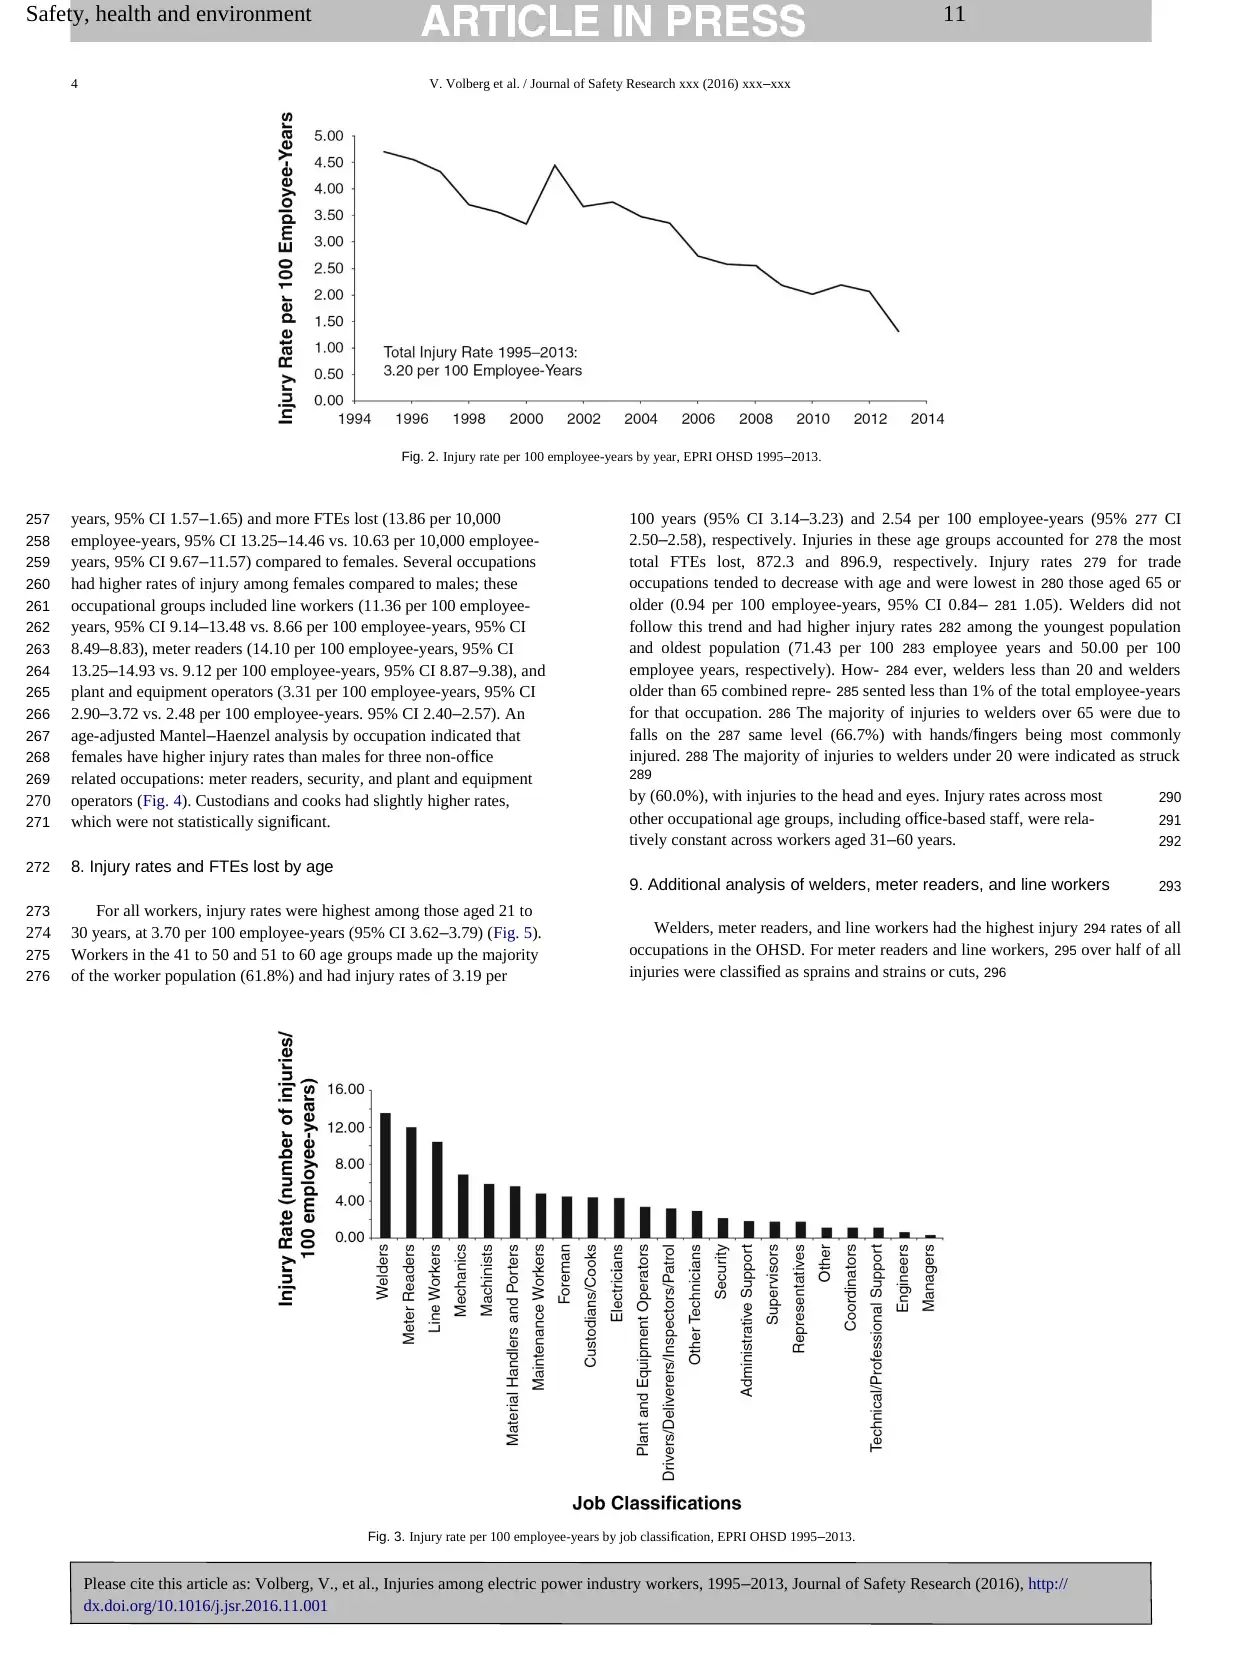
6. Injury rates and FTEs lost by job classification 239
Occupations with the highest injury rates were welders (13.56 per 240 100
employee-years, 95% CI 12.74–14.37), meter readers (12.04 per 241 100
employee-years, 95% CI 11.77–12.31), and line workers (10.37 per 242
100 employee-years, 95% CI 10.19–10.56) (Fig. 3). Line workers 243 (19.5%),
mechanics (12.8%), and meter readers (12.3%) accounted for 244 the highest
proportions of injuries among all of the occupational groups 245 and were among
the highest FTEs lost (61.20, 25.42, and 57.08 per 246 10,000 employee-years,
respectively). Although welders made up a 247 relatively small proportion of the
workforce (b1% of total employee- 248 years), of the injuries that had occurred
(1.7%), they had the highest 249
observed injury rate and the fifth highest FTE loss rate (25.42 per 250 10,000
employee-years). Occupations with the lowest injury rates 251 were engineers
(0.65 per 100 employee-years, 95% CI 0.60–0.69) and 252
managers (0.42 per 100 employee-years, 95% CI 0.38–0.45). 253
7. Injury rates and FTEs lost by sex 254
Over the 1995 to 2013 period, males had higher injury rates (2.74 255 per 100
employee-years, 95% CI 2.71–2.76 vs. 1.61 per 100 employee- 256
Fig. 1. Distribution of injuries by injured body region, EPRI OHSD 1995–2013.
Please cite this article as: Volberg, V., et al., Injuries among electric power industry workers, 1995–2013, Journal of Safety Research (2016), http://
dx.doi.org/10.1016/j.jsr.2016.11.001
V. Volberg et al. / Journal of Safety Research xxx (2016) xxx–xxx 3
t1:1 Table 1
t1:2 Distribution of sex and age, EPRI OHSD 1995–2013.
t1:3 Employee-years Percentage of OHSD
t1:4 Sex
t1:5 Female 425,260 22.9
t1:6 Male 1,451,143 73.4
t1:7 Unknown 74,033 3.7
t1:8 Age group (years)t1:9
t1:10 b20 14,944 0.8
t1:11 21–30 202,767 10.3
t1:12 31–40 396,159 20.0
t1:13 41–50 621,654 31.4
t1:14 51–60 544,667 27.5
t1:15 61–65 75, 898 3.8
t1:16 65+ 31,571 1.6
t1:17 Unknown 89,776 4.5
t2:1 Table 2
t2:2 Distribution of injuries and medical costs, EPRI OHSD 1995–2013.
t2:3 Injury type Percentage of Injuries Percent of Medical Costs
t2:4 Sprains, strains 40.9% 43.7%
t2:5 Cut, laceration, puncture 16.0% 4.2%
t2:6 Contusion, bruise 9.0% 4.2%
t2:7 Scratches, abrasions 5.7% 0.7%
t2:8 Fracture/dislocation 5.5% 12.3%
t2:9 CTD/RSI 4.7% 10.9%
t2:10 Hearing loss or impairment 3.0% 0.9%
t2:11 Bite 3.0% 0.2%
t2:12 Respiratory 2.2% 0.4%
t2:13 Dermatitis/skin 1.4% 0.2%
t2:14 Burn heat/thermal 1.3% 2.9%
t2:15 Burn, flashburn 0.7% 8.4%
t2:16 Electric shock, electrocution 0.6% 2.4%
t2:17 CTD/RSI Carpal Tunnel Disorder/Repetitive Stress Injury.
208 only 2.0% of injuries, burns had the highest cost per incident, accounting
209 for 11.3% of total medical costs.
210 Commonly affected body regions were back and trunk (17.8%); hand
211 and finger (14.3%); head (excluding eyes, 9.9%); upper extremities,
212 including arm, forearm and elbow (8.3%); neck and shoulder (8.2%);
213 and knees (8.0%) (Fig. 1). There was a statistically significant increase
214 in the proportion of injuries to the head, excluding eyes, with increasing
215 age (pb0.01). The unadjusted distributions of injuries were similar
216 between males and females, with a few notable exceptions. Injuries to
217 the wrist and upper extremities were more frequent among female
workers (14.1% and 12.2% vs. 3.3% and 8.1%, respectively), while injuries 218 to
the back and trunk (17.5% vs. 12.6%), head (11.1% vs. 4.6%), and eyes 219
(5.0% vs. 1.8%) were more frequent among male workers. 220
5. Overall injury rates and FTEs lost 221
The overall injury rate over the 1995 to 2013 period was 3.20 per 222
100 employee-years (95% CI 3.17–3.22) (Fig. 2). Annual injury rates 223 steadily
decreased from 1995 to 2000, increased sharply in 2001, and 224 subsequently
steadily decreased to their lowest rate of 1.31 injuries 225 per 100 employee-years
in 2013. For 2013, the current data-reporting 226 year, injury rates (1.31 per 100
employee-years, 95% CI 1.22–1.40) 227 were significantly lower than the peak
injury rates from 1995 (4.70 228 per 100 employee-years, 95% CI 4.57–4.82).
They were also significantly 229 lower compared to the 2012 injury rate of 2.06
per 100 employee-years 230 (95% CI 1.97–2.16). For the entire 19-year study
period, the annual 231
injury rate declined by an average 5% per year (p b 0.01). 232
Annual total FTEs lost have shown substantial variability and no con- 233
sistent trend over the 19-year reporting period (p = 0.11). However, 234 there was
a steady decline from the peak in 2003 of 28.19 FTEs per 235 10,000 employee-
years to the current, 2013, rate of 6.83 FTEs lost per 236 10,000 employee-years
(p b 0.001); the lowest in the history of the 237
OHSD (data not shown). 238
6. Injury rates and FTEs lost by job classification 239
Occupations with the highest injury rates were welders (13.56 per 240 100
employee-years, 95% CI 12.74–14.37), meter readers (12.04 per 241 100
employee-years, 95% CI 11.77–12.31), and line workers (10.37 per 242
100 employee-years, 95% CI 10.19–10.56) (Fig. 3). Line workers 243 (19.5%),
mechanics (12.8%), and meter readers (12.3%) accounted for 244 the highest
proportions of injuries among all of the occupational groups 245 and were among
the highest FTEs lost (61.20, 25.42, and 57.08 per 246 10,000 employee-years,
respectively). Although welders made up a 247 relatively small proportion of the
workforce (b1% of total employee- 248 years), of the injuries that had occurred
(1.7%), they had the highest 249
observed injury rate and the fifth highest FTE loss rate (25.42 per 250 10,000
employee-years). Occupations with the lowest injury rates 251 were engineers
(0.65 per 100 employee-years, 95% CI 0.60–0.69) and 252
managers (0.42 per 100 employee-years, 95% CI 0.38–0.45). 253
7. Injury rates and FTEs lost by sex 254
Over the 1995 to 2013 period, males had higher injury rates (2.74 255 per 100
employee-years, 95% CI 2.71–2.76 vs. 1.61 per 100 employee- 256
Fig. 1. Distribution of injuries by injured body region, EPRI OHSD 1995–2013.
Please cite this article as: Volberg, V., et al., Injuries among electric power industry workers, 1995–2013, Journal of Safety Research (2016), http://
dx.doi.org/10.1016/j.jsr.2016.11.001
Paraphrase This Document
Need a fresh take? Get an instant paraphrase of this document with our AI Paraphraser
Safety, health and environment 11
4 V. Volberg et al. / Journal of Safety Research xxx (2016) xxx–xxx
Fig. 2. Injury rate per 100 employee-years by year, EPRI OHSD 1995–2013.
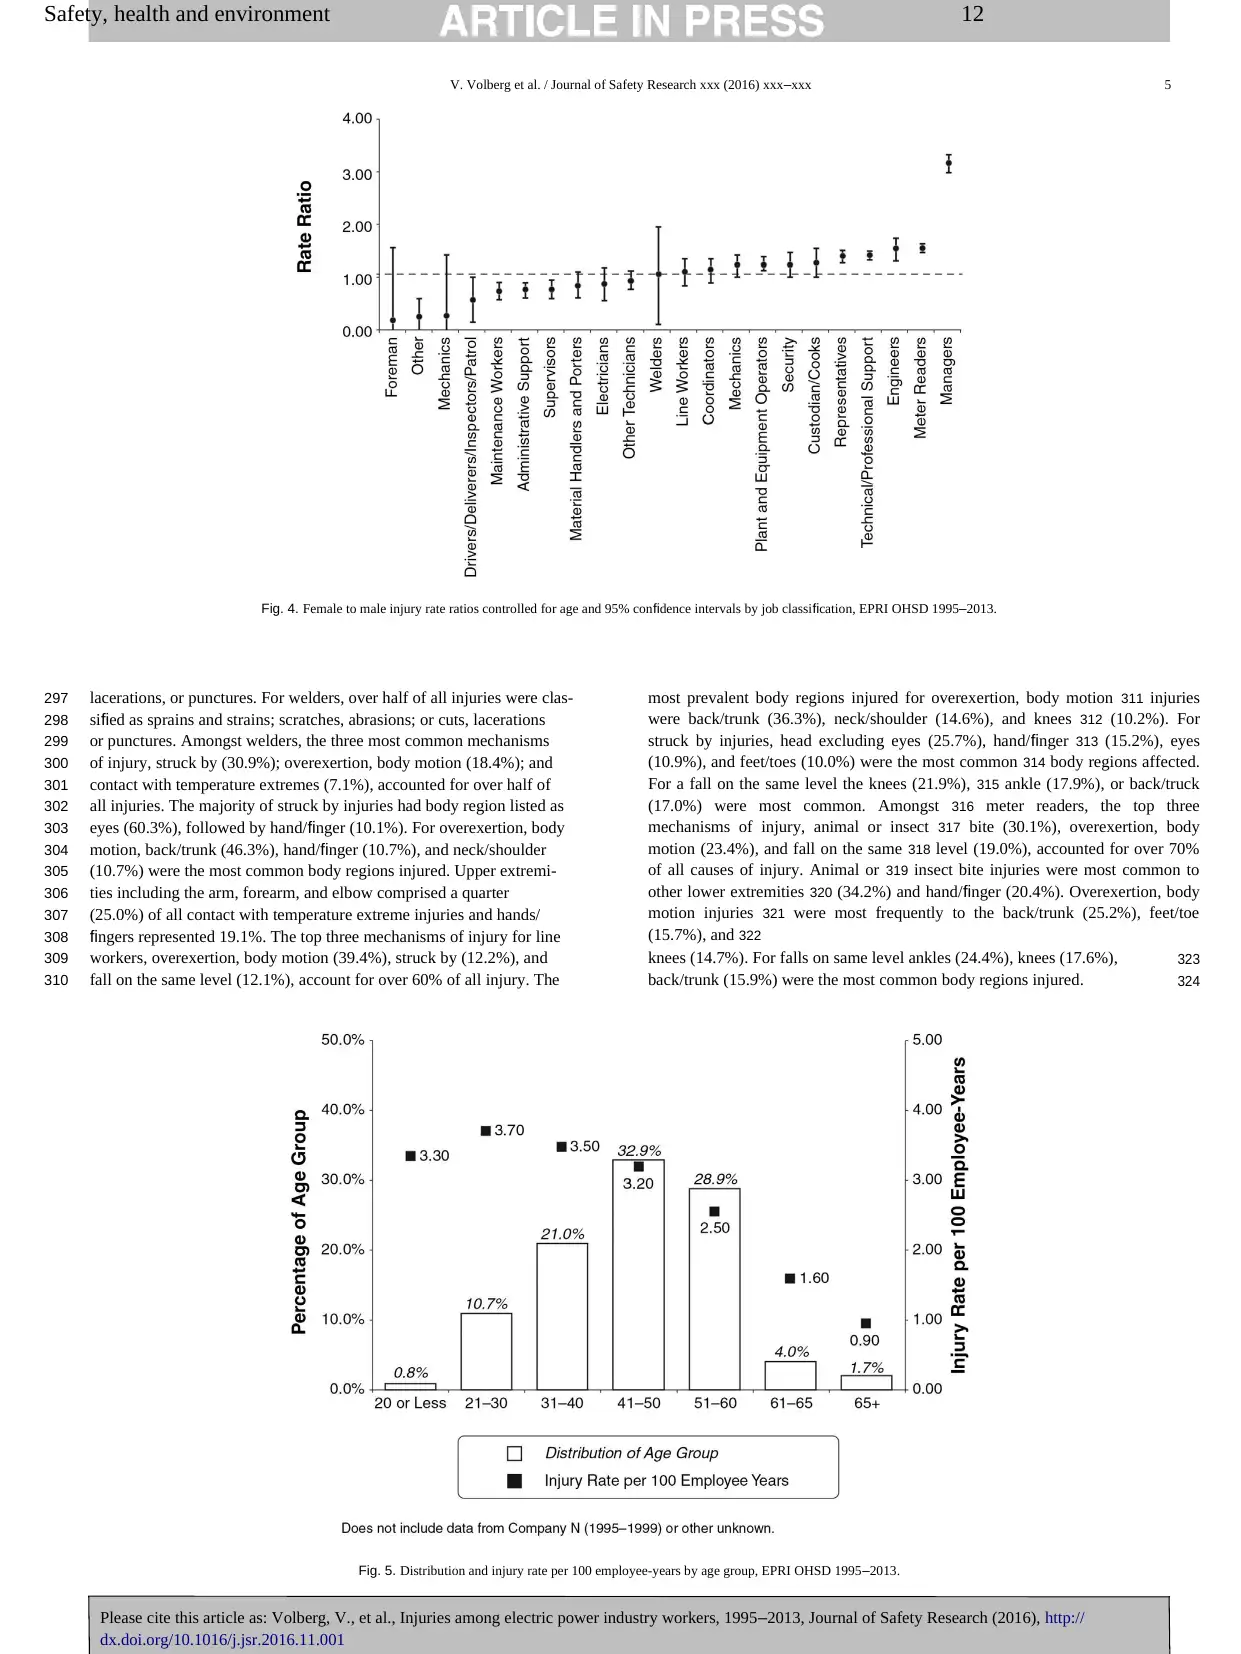
257 years, 95% CI 1.57–1.65) and more FTEs lost (13.86 per 10,000
258 employee-years, 95% CI 13.25–14.46 vs. 10.63 per 10,000 employee-
259 years, 95% CI 9.67–11.57) compared to females. Several occupations
260 had higher rates of injury among females compared to males; these
261 occupational groups included line workers (11.36 per 100 employee-
262 years, 95% CI 9.14–13.48 vs. 8.66 per 100 employee-years, 95% CI
263 8.49–8.83), meter readers (14.10 per 100 employee-years, 95% CI
264 13.25–14.93 vs. 9.12 per 100 employee-years, 95% CI 8.87–9.38), and
265 plant and equipment operators (3.31 per 100 employee-years, 95% CI
266 2.90–3.72 vs. 2.48 per 100 employee-years. 95% CI 2.40–2.57). An
267 age-adjusted Mantel–Haenzel analysis by occupation indicated that
268 females have higher injury rates than males for three non-office
269 related occupations: meter readers, security, and plant and equipment
270 operators (Fig. 4). Custodians and cooks had slightly higher rates,
271 which were not statistically significant.
272 8. Injury rates and FTEs lost by age
273 For all workers, injury rates were highest among those aged 21 to
274 30 years, at 3.70 per 100 employee-years (95% CI 3.62–3.79) (Fig. 5).
275 Workers in the 41 to 50 and 51 to 60 age groups made up the majority
276 of the worker population (61.8%) and had injury rates of 3.19 per
100 years (95% CI 3.14–3.23) and 2.54 per 100 employee-years (95% 277 CI
2.50–2.58), respectively. Injuries in these age groups accounted for 278 the most
total FTEs lost, 872.3 and 896.9, respectively. Injury rates 279 for trade
occupations tended to decrease with age and were lowest in 280 those aged 65 or
older (0.94 per 100 employee-years, 95% CI 0.84– 281 1.05). Welders did not
follow this trend and had higher injury rates 282 among the youngest population
and oldest population (71.43 per 100 283 employee years and 50.00 per 100
employee years, respectively). How- 284 ever, welders less than 20 and welders
older than 65 combined repre- 285 sented less than 1% of the total employee-years
for that occupation. 286 The majority of injuries to welders over 65 were due to
falls on the 287 same level (66.7%) with hands/fingers being most commonly
injured. 288 The majority of injuries to welders under 20 were indicated as struck
289
by (60.0%), with injuries to the head and eyes. Injury rates across most 290
other occupational age groups, including office-based staff, were rela- 291
tively constant across workers aged 31–60 years. 292
9. Additional analysis of welders, meter readers, and line workers 293
Welders, meter readers, and line workers had the highest injury 294 rates of all
occupations in the OHSD. For meter readers and line workers, 295 over half of all
injuries were classified as sprains and strains or cuts, 296
Fig. 3. Injury rate per 100 employee-years by job classification, EPRI OHSD 1995–2013.
Please cite this article as: Volberg, V., et al., Injuries among electric power industry workers, 1995–2013, Journal of Safety Research (2016), http://
dx.doi.org/10.1016/j.jsr.2016.11.001
4 V. Volberg et al. / Journal of Safety Research xxx (2016) xxx–xxx
Fig. 2. Injury rate per 100 employee-years by year, EPRI OHSD 1995–2013.
257 years, 95% CI 1.57–1.65) and more FTEs lost (13.86 per 10,000
258 employee-years, 95% CI 13.25–14.46 vs. 10.63 per 10,000 employee-
259 years, 95% CI 9.67–11.57) compared to females. Several occupations
260 had higher rates of injury among females compared to males; these
261 occupational groups included line workers (11.36 per 100 employee-
262 years, 95% CI 9.14–13.48 vs. 8.66 per 100 employee-years, 95% CI
263 8.49–8.83), meter readers (14.10 per 100 employee-years, 95% CI
264 13.25–14.93 vs. 9.12 per 100 employee-years, 95% CI 8.87–9.38), and
265 plant and equipment operators (3.31 per 100 employee-years, 95% CI
266 2.90–3.72 vs. 2.48 per 100 employee-years. 95% CI 2.40–2.57). An
267 age-adjusted Mantel–Haenzel analysis by occupation indicated that
268 females have higher injury rates than males for three non-office
269 related occupations: meter readers, security, and plant and equipment
270 operators (Fig. 4). Custodians and cooks had slightly higher rates,
271 which were not statistically significant.
272 8. Injury rates and FTEs lost by age
273 For all workers, injury rates were highest among those aged 21 to
274 30 years, at 3.70 per 100 employee-years (95% CI 3.62–3.79) (Fig. 5).
275 Workers in the 41 to 50 and 51 to 60 age groups made up the majority
276 of the worker population (61.8%) and had injury rates of 3.19 per
100 years (95% CI 3.14–3.23) and 2.54 per 100 employee-years (95% 277 CI
2.50–2.58), respectively. Injuries in these age groups accounted for 278 the most
total FTEs lost, 872.3 and 896.9, respectively. Injury rates 279 for trade
occupations tended to decrease with age and were lowest in 280 those aged 65 or
older (0.94 per 100 employee-years, 95% CI 0.84– 281 1.05). Welders did not
follow this trend and had higher injury rates 282 among the youngest population
and oldest population (71.43 per 100 283 employee years and 50.00 per 100
employee years, respectively). How- 284 ever, welders less than 20 and welders
older than 65 combined repre- 285 sented less than 1% of the total employee-years
for that occupation. 286 The majority of injuries to welders over 65 were due to
falls on the 287 same level (66.7%) with hands/fingers being most commonly
injured. 288 The majority of injuries to welders under 20 were indicated as struck
289
by (60.0%), with injuries to the head and eyes. Injury rates across most 290
other occupational age groups, including office-based staff, were rela- 291
tively constant across workers aged 31–60 years. 292
9. Additional analysis of welders, meter readers, and line workers 293
Welders, meter readers, and line workers had the highest injury 294 rates of all
occupations in the OHSD. For meter readers and line workers, 295 over half of all
injuries were classified as sprains and strains or cuts, 296
Fig. 3. Injury rate per 100 employee-years by job classification, EPRI OHSD 1995–2013.
Please cite this article as: Volberg, V., et al., Injuries among electric power industry workers, 1995–2013, Journal of Safety Research (2016), http://
dx.doi.org/10.1016/j.jsr.2016.11.001
Safety, health and environment 12
V. Volberg et al. / Journal of Safety Research xxx (2016) xxx–xxx 5
Fig. 4. Female to male injury rate ratios controlled for age and 95% confidence intervals by job classification, EPRI OHSD 1995–2013.
297 lacerations, or punctures. For welders, over half of all injuries were clas-
298 sified as sprains and strains; scratches, abrasions; or cuts, lacerations
299 or punctures. Amongst welders, the three most common mechanisms
300 of injury, struck by (30.9%); overexertion, body motion (18.4%); and
301 contact with temperature extremes (7.1%), accounted for over half of
302 all injuries. The majority of struck by injuries had body region listed as
303 eyes (60.3%), followed by hand/finger (10.1%). For overexertion, body
304 motion, back/trunk (46.3%), hand/finger (10.7%), and neck/shoulder
305 (10.7%) were the most common body regions injured. Upper extremi-
306 ties including the arm, forearm, and elbow comprised a quarter
307 (25.0%) of all contact with temperature extreme injuries and hands/
308 fingers represented 19.1%. The top three mechanisms of injury for line
309 workers, overexertion, body motion (39.4%), struck by (12.2%), and
310 fall on the same level (12.1%), account for over 60% of all injury. The
most prevalent body regions injured for overexertion, body motion 311 injuries
were back/trunk (36.3%), neck/shoulder (14.6%), and knees 312 (10.2%). For
struck by injuries, head excluding eyes (25.7%), hand/finger 313 (15.2%), eyes
(10.9%), and feet/toes (10.0%) were the most common 314 body regions affected.
For a fall on the same level the knees (21.9%), 315 ankle (17.9%), or back/truck
(17.0%) were most common. Amongst 316 meter readers, the top three
mechanisms of injury, animal or insect 317 bite (30.1%), overexertion, body
motion (23.4%), and fall on the same 318 level (19.0%), accounted for over 70%
of all causes of injury. Animal or 319 insect bite injuries were most common to
other lower extremities 320 (34.2%) and hand/finger (20.4%). Overexertion, body
motion injuries 321 were most frequently to the back/trunk (25.2%), feet/toe
(15.7%), and 322
knees (14.7%). For falls on same level ankles (24.4%), knees (17.6%), 323
back/trunk (15.9%) were the most common body regions injured. 324
Fig. 5. Distribution and injury rate per 100 employee-years by age group, EPRI OHSD 1995–2013.
Please cite this article as: Volberg, V., et al., Injuries among electric power industry workers, 1995–2013, Journal of Safety Research (2016), http://
dx.doi.org/10.1016/j.jsr.2016.11.001
⊘ This is a preview!⊘
Do you want full access?
Subscribe today to unlock all pages.
Trusted by 1+ million students worldwide
1 out of 15
Related Documents


Your All-in-One AI-Powered Toolkit for Academic Success.
+13062052269
info@desklib.com
Available 24*7 on WhatsApp / Email
![[object Object]](/_next/static/media/star-bottom.7253800d.svg)
Unlock your academic potential
Copyright © 2020–2026 A2Z Services. All Rights Reserved. Developed and managed by ZUCOL.