Load Tests and Simulations of Electrical Machines: A Report
VerifiedAdded on 2021/04/19
|33
|3889
|77
Report
AI Summary
This report presents a comprehensive analysis of various electrical machines, including DC shunt motors, compound generators, and single-phase induction motors. The report begins with a discussion of health, safety, and risk assessment issues related to the operation and grounding of electrical machines, as well as constraints related to environmental and sustainability limitations. The core of the report focuses on load tests conducted on each type of machine, detailing the aim, introduction, theory, apparatus, procedure, results, and analysis of results. Additionally, the report includes operation simulations and results verification of a DC shunt motor and a single-phase induction motor using MATLAB Simulink. The simulations provide a deeper understanding of the machines' behavior under different conditions. The report concludes with references and provides a valuable resource for students studying electrical machines and their performance characteristics.

Electrical machines 1
ELECTRICAL MACHINES
By (Name)
Course
Professor’s name
University name
City, State
Date of submission
ELECTRICAL MACHINES
By (Name)
Course
Professor’s name
University name
City, State
Date of submission
Paraphrase This Document
Need a fresh take? Get an instant paraphrase of this document with our AI Paraphraser

Electrical machines 2
Table of Contents
Health, safety and risk assessment issues related to operations and grounding of electrical
machines and generators...............................................................................................................3
Constraints related to environmental and sustainability limitations............................................6
LOAD TEST ON DC SHUNT MOTOR.....................................................................................6
Aim:.............................................................................................................................................6
Introduction..................................................................................................................................6
Theory..........................................................................................................................................7
Armature current vs speed characteristics................................................................................7
Armature current vs torque characteristics...............................................................................8
Apparatus.....................................................................................................................................8
Circuit diagram............................................................................................................................9
Procedure.....................................................................................................................................9
Results........................................................................................................................................10
Analysis of results..................................................................................................................10
Operation simulation and results verification of dc shunt motor using Matlab Simulink.. .11
Results........................................................................................................................................14
LOAD TEST ON COMPOUND GENERATOR......................................................................14
AIM:...........................................................................................................................................14
Introduction................................................................................................................................15
Theory........................................................................................................................................15
Apparatus...................................................................................................................................16
Procedure...................................................................................................................................17
Results........................................................................................................................................17
Results analysis......................................................................................................................18

Electrical machines 3
LOAD TEST ON SINGLE PHASE INDUCTION MOTOR..................................................18
AIM:...........................................................................................................................................18
Introduction................................................................................................................................18
Theory........................................................................................................................................19
Apparatus...................................................................................................................................19
Circuit diagram..........................................................................................................................20
Procedure...................................................................................................................................20
Results........................................................................................................................................20
Results analysis..........................................................................................................................21
Simulation of single phase induction motor on Simulink........................................................22
Single phase induction motor model......................................................................................22
Stator magnetic flux...............................................................................................................22
Rotor magnetic flux................................................................................................................23
Rotor currents.........................................................................................................................24
Dynamic equation...................................................................................................................25
RESULTS..................................................................................................................................26
SIMULATION OF SEPARATELY EXCITED DC MOTOR................................................27
AIM:...........................................................................................................................................27
Introduction................................................................................................................................27
Mathematical modelling of SEDC.........................................................................................27
Results........................................................................................................................................30
References.....................................................................................................................................31
⊘ This is a preview!⊘
Do you want full access?
Subscribe today to unlock all pages.
Trusted by 1+ million students worldwide
Electrical machines 4
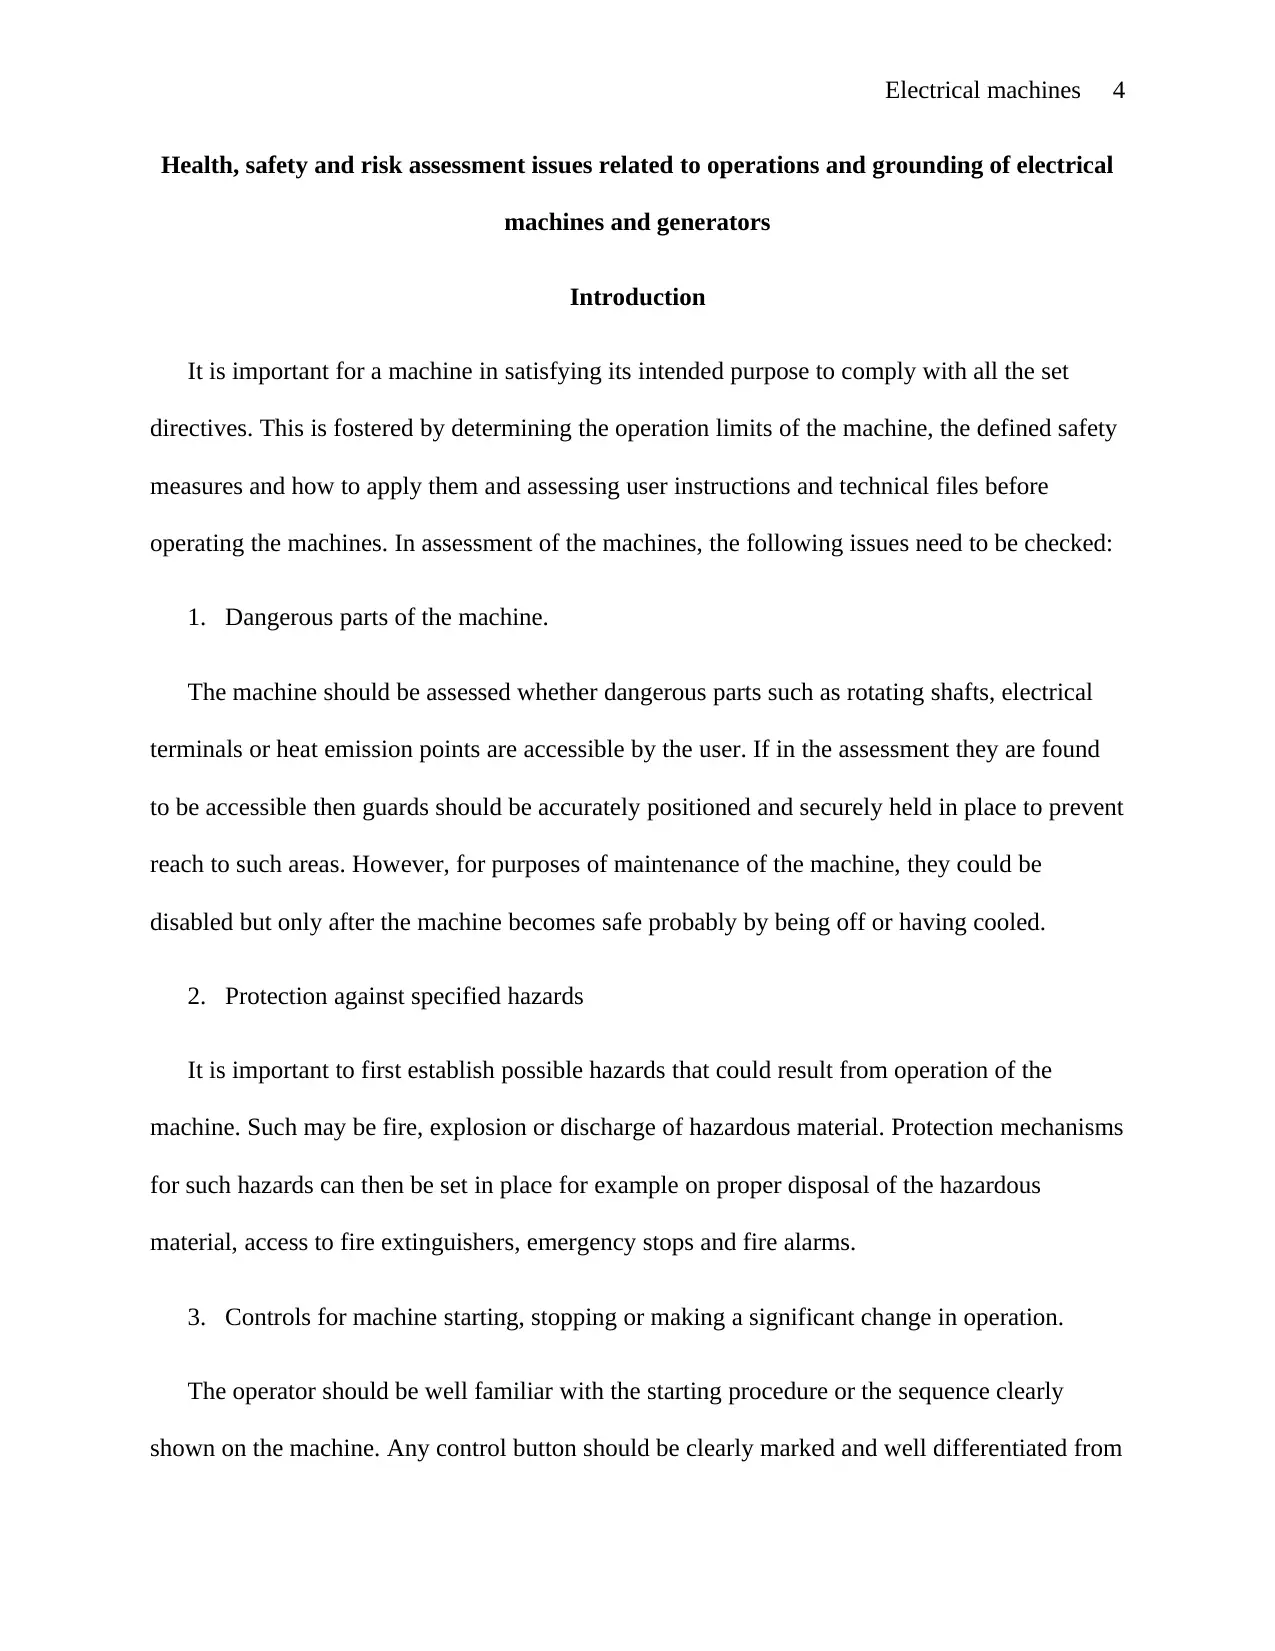
Health, safety and risk assessment issues related to operations and grounding of electrical
machines and generators
Introduction
It is important for a machine in satisfying its intended purpose to comply with all the set
directives. This is fostered by determining the operation limits of the machine, the defined safety
measures and how to apply them and assessing user instructions and technical files before
operating the machines. In assessment of the machines, the following issues need to be checked:
1. Dangerous parts of the machine.
The machine should be assessed whether dangerous parts such as rotating shafts, electrical
terminals or heat emission points are accessible by the user. If in the assessment they are found
to be accessible then guards should be accurately positioned and securely held in place to prevent
reach to such areas. However, for purposes of maintenance of the machine, they could be
disabled but only after the machine becomes safe probably by being off or having cooled.
2. Protection against specified hazards
It is important to first establish possible hazards that could result from operation of the
machine. Such may be fire, explosion or discharge of hazardous material. Protection mechanisms
for such hazards can then be set in place for example on proper disposal of the hazardous
material, access to fire extinguishers, emergency stops and fire alarms.
3. Controls for machine starting, stopping or making a significant change in operation.
The operator should be well familiar with the starting procedure or the sequence clearly
shown on the machine. Any control button should be clearly marked and well differentiated from
Paraphrase This Document
Need a fresh take? Get an instant paraphrase of this document with our AI Paraphraser
Electrical machines 5
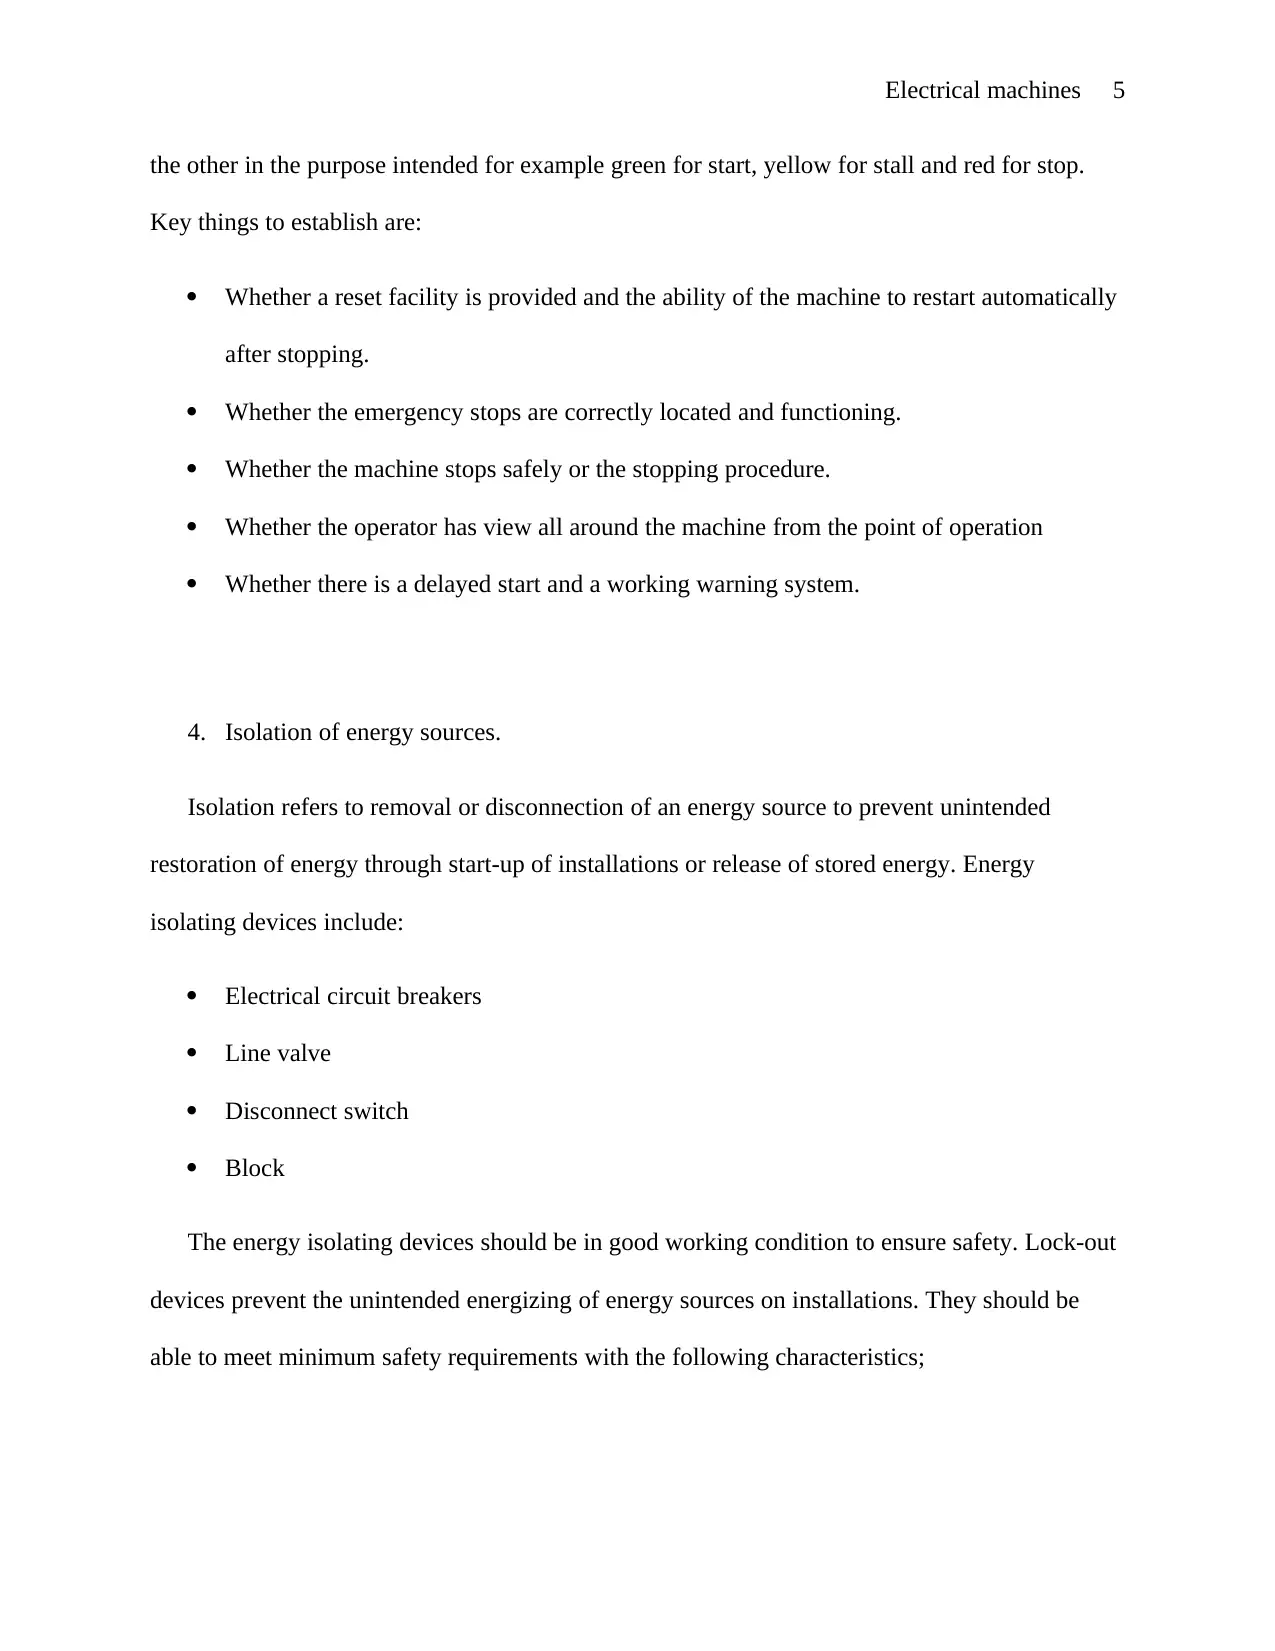
the other in the purpose intended for example green for start, yellow for stall and red for stop.
Key things to establish are:
Whether a reset facility is provided and the ability of the machine to restart automatically
after stopping.
Whether the emergency stops are correctly located and functioning.
Whether the machine stops safely or the stopping procedure.
Whether the operator has view all around the machine from the point of operation
Whether there is a delayed start and a working warning system.
4. Isolation of energy sources.
Isolation refers to removal or disconnection of an energy source to prevent unintended
restoration of energy through start-up of installations or release of stored energy. Energy
isolating devices include:
Electrical circuit breakers
Line valve
Disconnect switch
Block
The energy isolating devices should be in good working condition to ensure safety. Lock-out
devices prevent the unintended energizing of energy sources on installations. They should be
able to meet minimum safety requirements with the following characteristics;

Electrical machines 6
Visually identified instantly as a safety device well marked for example “DANGER:
LOCK-OUT”
Avoid inadvertent energisation at the point of attachment.
Unique locking mechanism for each lock-out device.
Tamper proof.
5. Lighting and ventilation
Ambient lighting of enough intensity is appropriate around the machine. The operator should
be able to appropriately see essential parts of the machine. If ambient lighting lacks or not
enough then lighting should be provided with adequate lighting. The code of practice for the
electricity (wiring) regulation specifies a vertical illumination level average of 120 luminous
intensity for proper operation of the machine. Suitable ventilation for free flow of air is needed to
avoid the development of high ambient air temperatures exceeding the permissible temperature
around the machine.
6. Working space
The code of practice for the electricity (wiring) regulation recommends a clearance space of
at least 900 mm for full width and in front of meters and of all low voltage control panels
including switch gear with a rating in excess of 100 A. However, a high voltage electrical
equipment should have a minimum clearance space of 1400 mm. For accessibility behind or by
the side of the machine, a clearance space of at least 600 mm is recommended. The clearance
space should be enough for proper operation of draw-out type equipment and opening of the
hinged panels to at least 90 degrees.
⊘ This is a preview!⊘
Do you want full access?
Subscribe today to unlock all pages.
Trusted by 1+ million students worldwide
Electrical machines 7
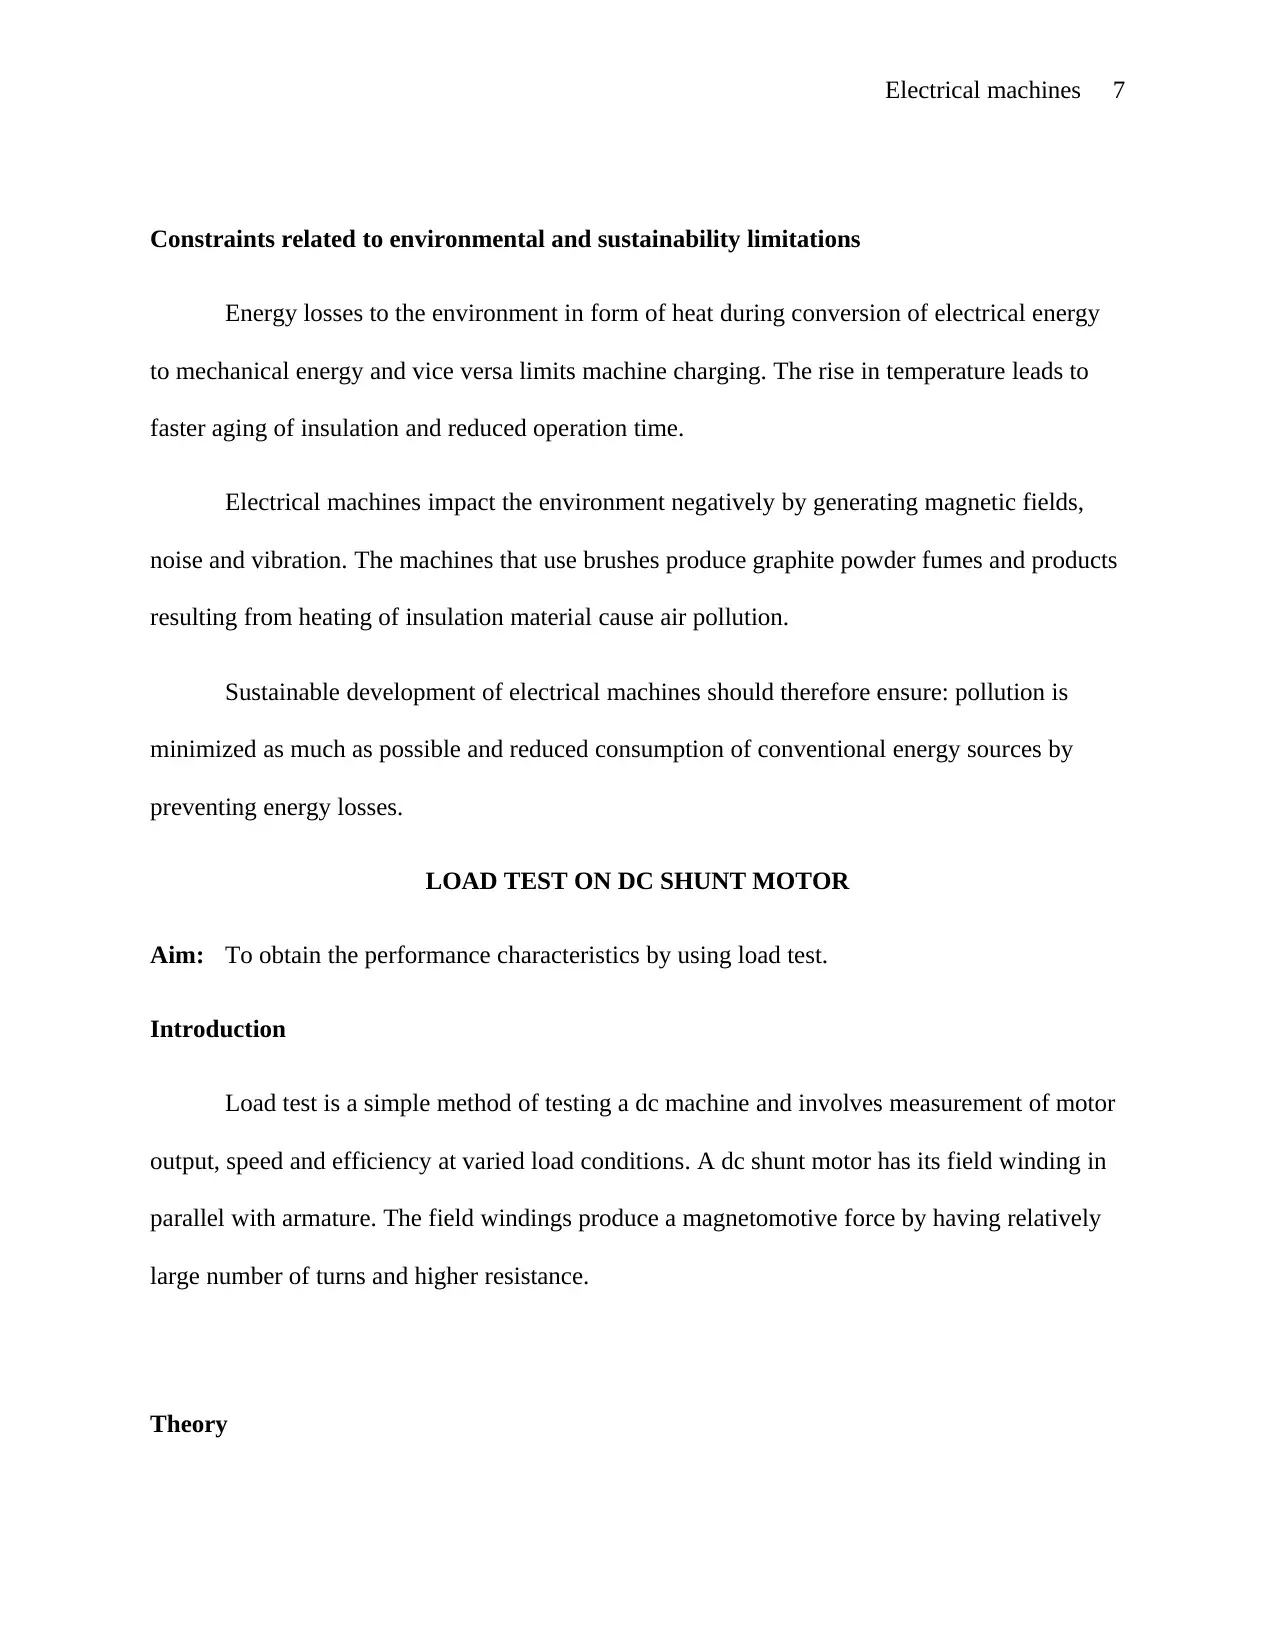
Constraints related to environmental and sustainability limitations
Energy losses to the environment in form of heat during conversion of electrical energy
to mechanical energy and vice versa limits machine charging. The rise in temperature leads to
faster aging of insulation and reduced operation time.
Electrical machines impact the environment negatively by generating magnetic fields,
noise and vibration. The machines that use brushes produce graphite powder fumes and products
resulting from heating of insulation material cause air pollution.
Sustainable development of electrical machines should therefore ensure: pollution is
minimized as much as possible and reduced consumption of conventional energy sources by
preventing energy losses.
LOAD TEST ON DC SHUNT MOTOR
Aim: To obtain the performance characteristics by using load test.
Introduction
Load test is a simple method of testing a dc machine and involves measurement of motor
output, speed and efficiency at varied load conditions. A dc shunt motor has its field winding in
parallel with armature. The field windings produce a magnetomotive force by having relatively
large number of turns and higher resistance.
Theory
Paraphrase This Document
Need a fresh take? Get an instant paraphrase of this document with our AI Paraphraser
Electrical machines 8
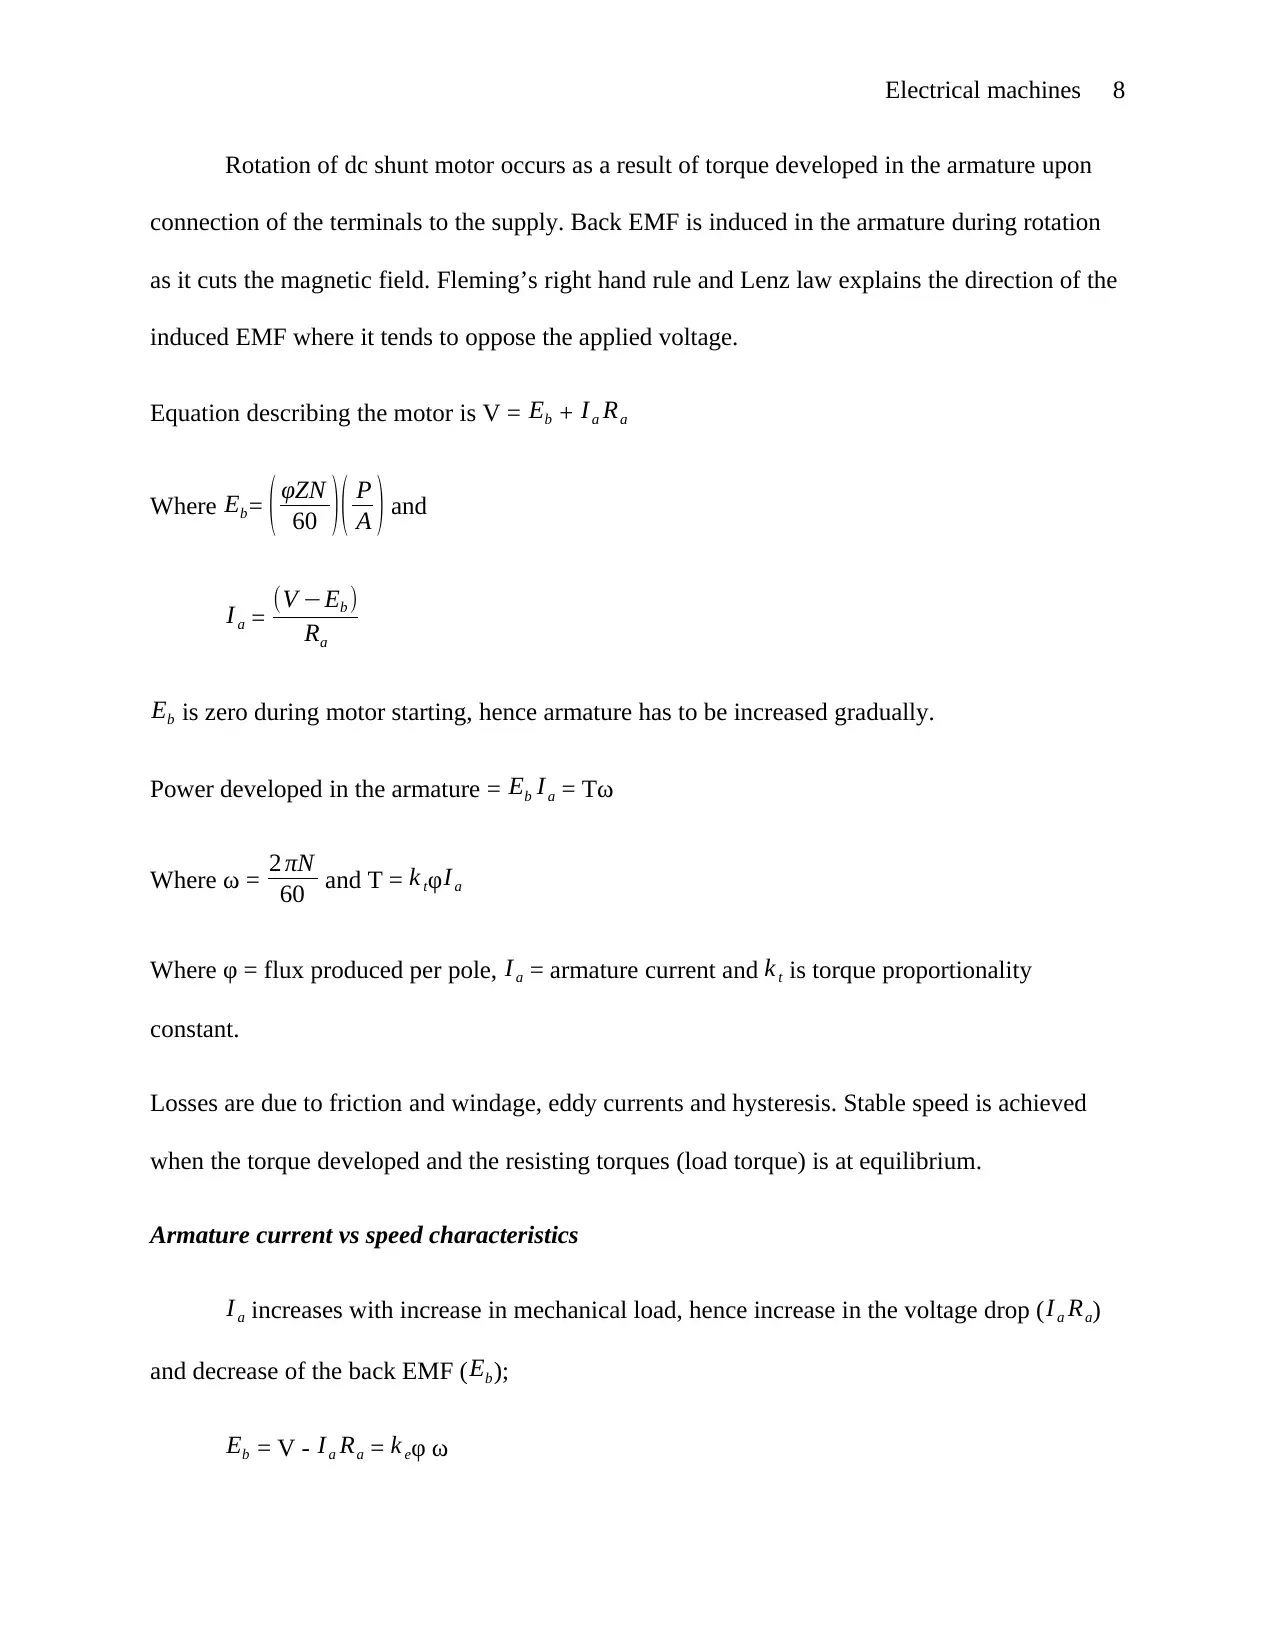
Rotation of dc shunt motor occurs as a result of torque developed in the armature upon
connection of the terminals to the supply. Back EMF is induced in the armature during rotation
as it cuts the magnetic field. Fleming’s right hand rule and Lenz law explains the direction of the
induced EMF where it tends to oppose the applied voltage.
Equation describing the motor is V = Eb + I a Ra
Where Eb= ( φZN
60 )( P
A ) and
I a = (V −Eb )
Ra
Eb is zero during motor starting, hence armature has to be increased gradually.
Power developed in the armature = Eb I a = Tω
Where ω = 2 πN
60 and T = k tφ I a
Where φ = flux produced per pole, I a = armature current and k t is torque proportionality
constant.
Losses are due to friction and windage, eddy currents and hysteresis. Stable speed is achieved
when the torque developed and the resisting torques (load torque) is at equilibrium.
Armature current vs speed characteristics
I a increases with increase in mechanical load, hence increase in the voltage drop ( I a Ra)
and decrease of the back EMF (Eb);
Eb = V - I a Ra = k eφ ω
Electrical machines 9
Where k e is back EMF constant.
If flux (φ) is constant, speed (ω) decreases as Eb decreases. Ra is very small hence I a Ra is
a small value. The speed therefore slightly decreases as I a increases.
Armature current vs torque characteristics
At constant flux, an increase in armature current leads to corresponding increase in torque
developed. However, flux slightly falls with increased armature current in real situation as a
result of armature reaction.
Armature current vs induced EMF
The induced EMF slightly decreases with increase in armature current.
Torque vs speed characteristics
Increasing the load leads to an increase in armature current since the flux is constant. The
decrease in speed is small because the voltage drop due to armature resistance is negligible.
Name plate details:
Apparatus
No. Equipment Range Type Qty.
1. Ammeter 0 – 5 A
0 – 2 A
MC
MC
1No
1No
2. Voltmeter 0 – 250 V MC 1No
3. Rheostats 100/5 A Wire wound 1No
⊘ This is a preview!⊘
Do you want full access?
Subscribe today to unlock all pages.
Trusted by 1+ million students worldwide
Electrical machines 10
400/1.7 A Wire wound 1No
4. Tachometer 0-2000 rpm Digital 1No
5. Connecting wires LS
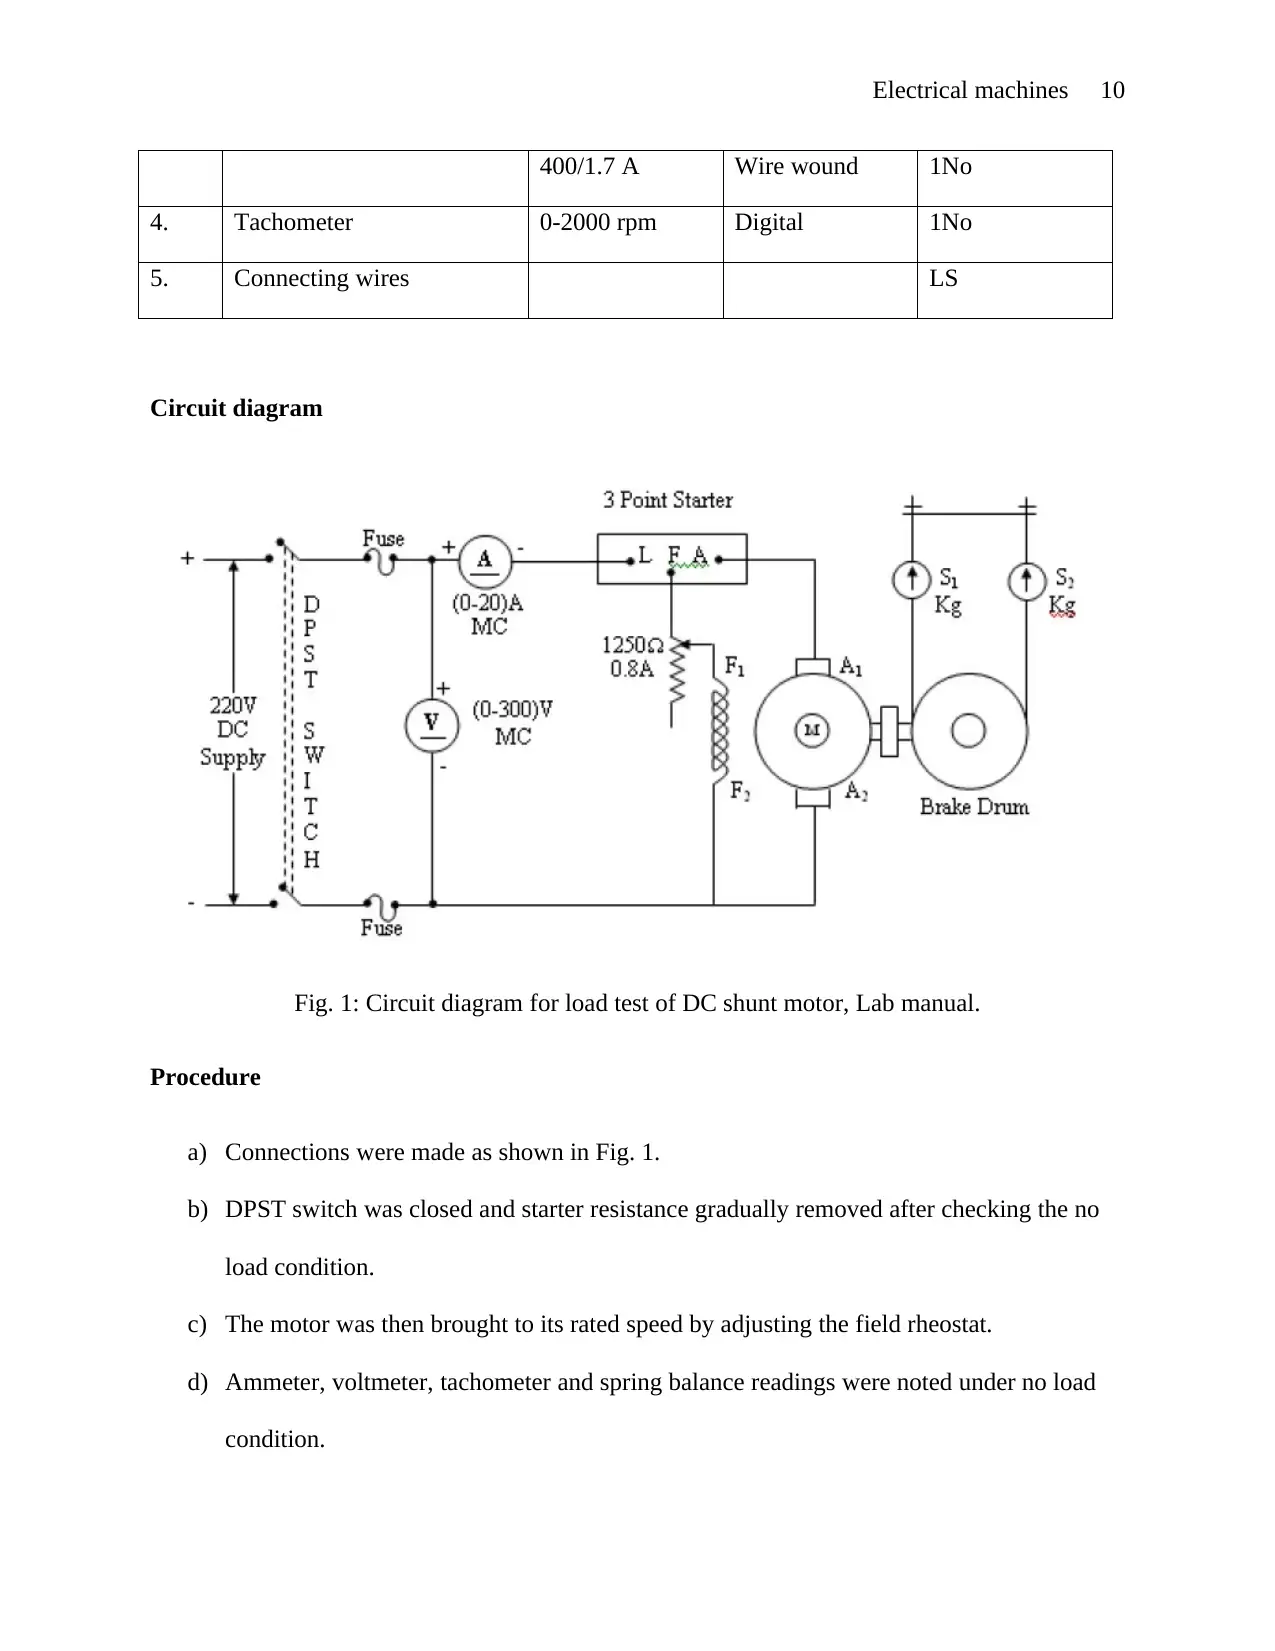
Circuit diagram
Fig. 1: Circuit diagram for load test of DC shunt motor, Lab manual.
Procedure
a) Connections were made as shown in Fig. 1.
b) DPST switch was closed and starter resistance gradually removed after checking the no
load condition.
c) The motor was then brought to its rated speed by adjusting the field rheostat.
d) Ammeter, voltmeter, tachometer and spring balance readings were noted under no load
condition.
400/1.7 A Wire wound 1No
4. Tachometer 0-2000 rpm Digital 1No
5. Connecting wires LS
Circuit diagram
Fig. 1: Circuit diagram for load test of DC shunt motor, Lab manual.
Procedure
a) Connections were made as shown in Fig. 1.
b) DPST switch was closed and starter resistance gradually removed after checking the no
load condition.
c) The motor was then brought to its rated speed by adjusting the field rheostat.
d) Ammeter, voltmeter, tachometer and spring balance readings were noted under no load
condition.
Paraphrase This Document
Need a fresh take? Get an instant paraphrase of this document with our AI Paraphraser
Electrical machines 11
e) The load was then added to the motor gradually and for each load, voltmeter, ammeter,
spring balance readings and speed of the motor were noted.
f) The motor was then brought to no load condition and field rheostat to minimum position
then DPST switch opened.
Results
S.No. Volts Amps S1
(Kg)
S2
(Kg)
S1- S2
(Kg)
rpm T
(Nm)
Po
(W)
Pi (W) Ƞ (%)
1 225 0.94 0.05 0.58 0.53 1548 0.1950 0.316 0.2115 14.9
2 225 0.09 0.165 0.07 0.095 1544 0.0350 0.0057 0.0203 27.9
3 225 0.92 0.185 0.07 0.115 1542 0.0423 0.0068 0.207 3.3
4 225 0.96 0.255 0.105 0.15 1540 0.0552 0.0089 0.216 4.12
5 225 0.97 0.21 0.145 0.065 1432 0.0239 0.0039 0.2183 1.78
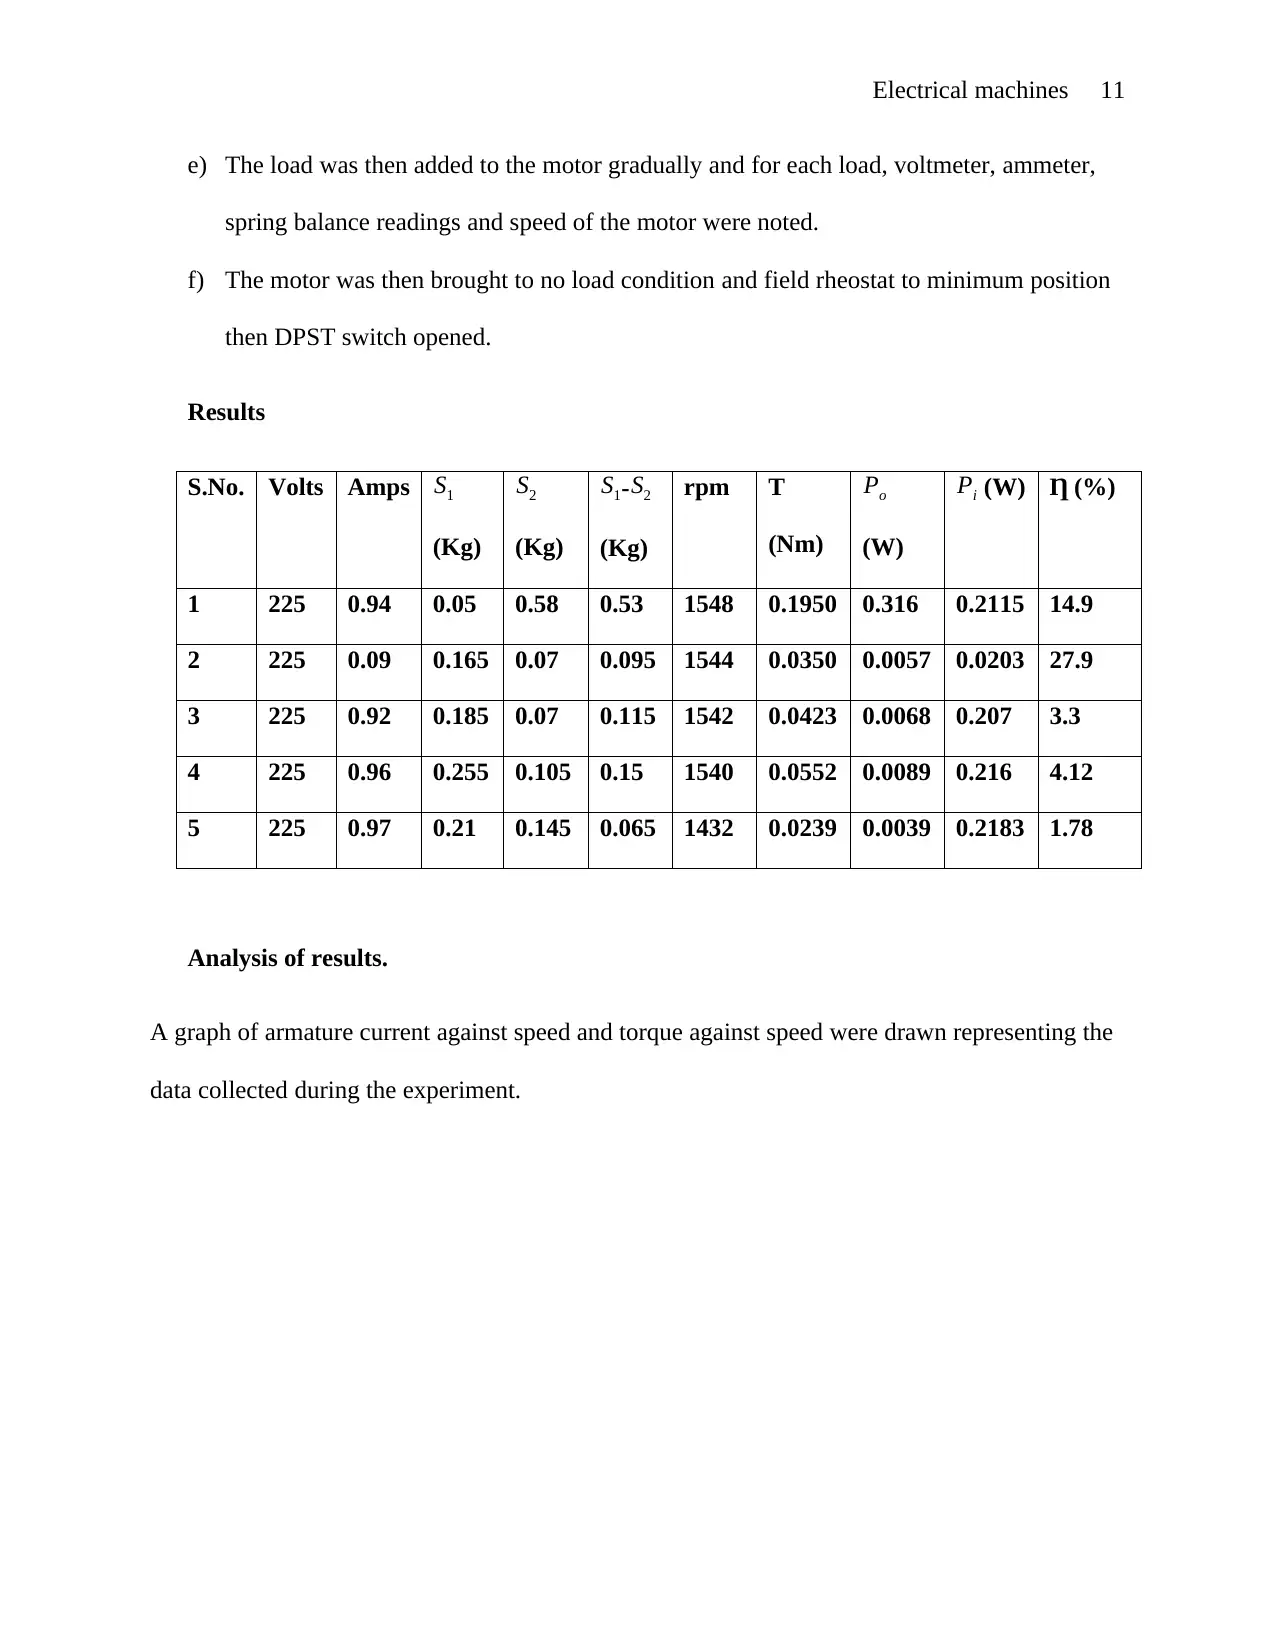
Analysis of results.
A graph of armature current against speed and torque against speed were drawn representing the
data collected during the experiment.
e) The load was then added to the motor gradually and for each load, voltmeter, ammeter,
spring balance readings and speed of the motor were noted.
f) The motor was then brought to no load condition and field rheostat to minimum position
then DPST switch opened.
Results
S.No. Volts Amps S1
(Kg)
S2
(Kg)
S1- S2
(Kg)
rpm T
(Nm)
Po
(W)
Pi (W) Ƞ (%)
1 225 0.94 0.05 0.58 0.53 1548 0.1950 0.316 0.2115 14.9
2 225 0.09 0.165 0.07 0.095 1544 0.0350 0.0057 0.0203 27.9
3 225 0.92 0.185 0.07 0.115 1542 0.0423 0.0068 0.207 3.3
4 225 0.96 0.255 0.105 0.15 1540 0.0552 0.0089 0.216 4.12
5 225 0.97 0.21 0.145 0.065 1432 0.0239 0.0039 0.2183 1.78
Analysis of results.
A graph of armature current against speed and torque against speed were drawn representing the
data collected during the experiment.
Electrical machines 12
From the graph, it is possible to deduce that armature current varies inversely with speed.
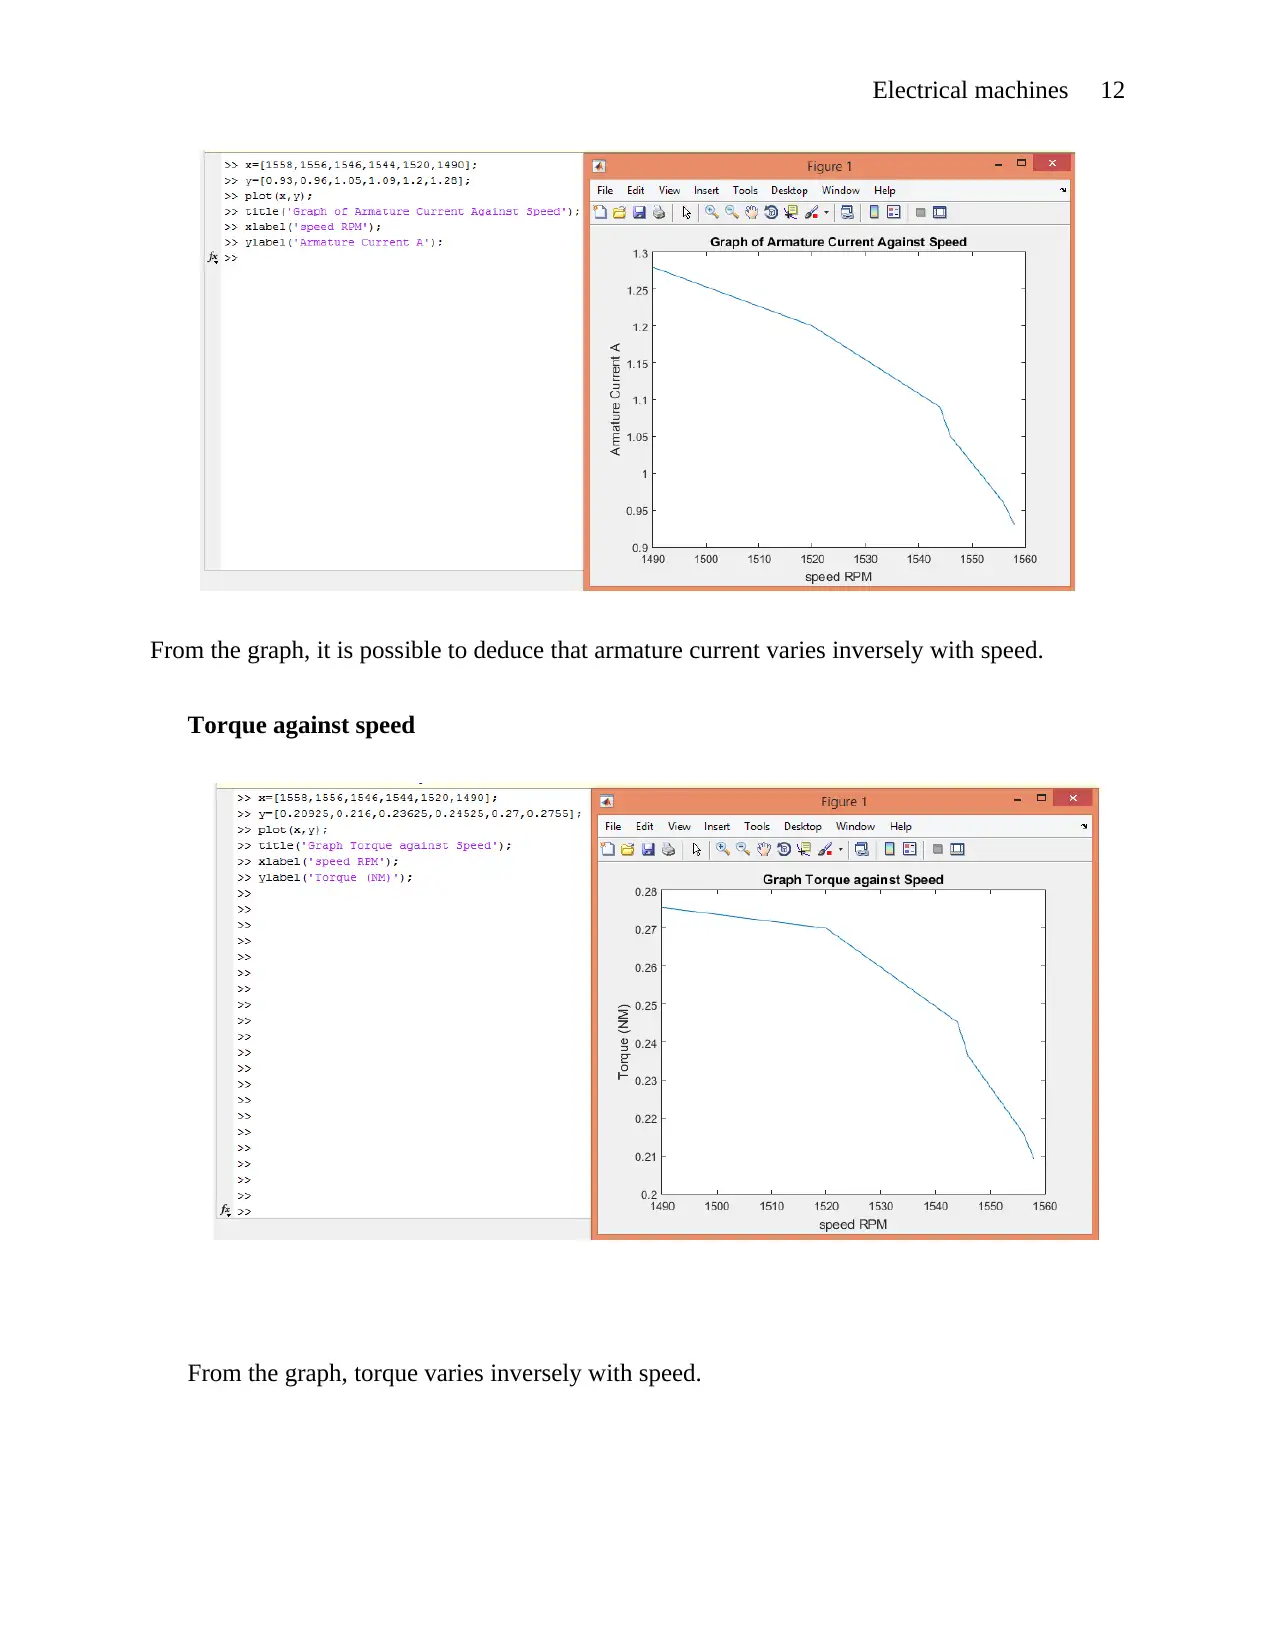
Torque against speed
From the graph, torque varies inversely with speed.
From the graph, it is possible to deduce that armature current varies inversely with speed.
Torque against speed
From the graph, torque varies inversely with speed.
⊘ This is a preview!⊘
Do you want full access?
Subscribe today to unlock all pages.
Trusted by 1+ million students worldwide
1 out of 33
Related Documents


Your All-in-One AI-Powered Toolkit for Academic Success.
+13062052269
info@desklib.com
Available 24*7 on WhatsApp / Email
![[object Object]](/_next/static/media/star-bottom.7253800d.svg)
Unlock your academic potential
Copyright © 2020–2026 A2Z Services. All Rights Reserved. Developed and managed by ZUCOL.