T1 2019 ME603 Project 1: Heart Rate Monitoring System Design

Verified

Added on  2023/04/21

|4
|1527
|378
Project
AI Summary
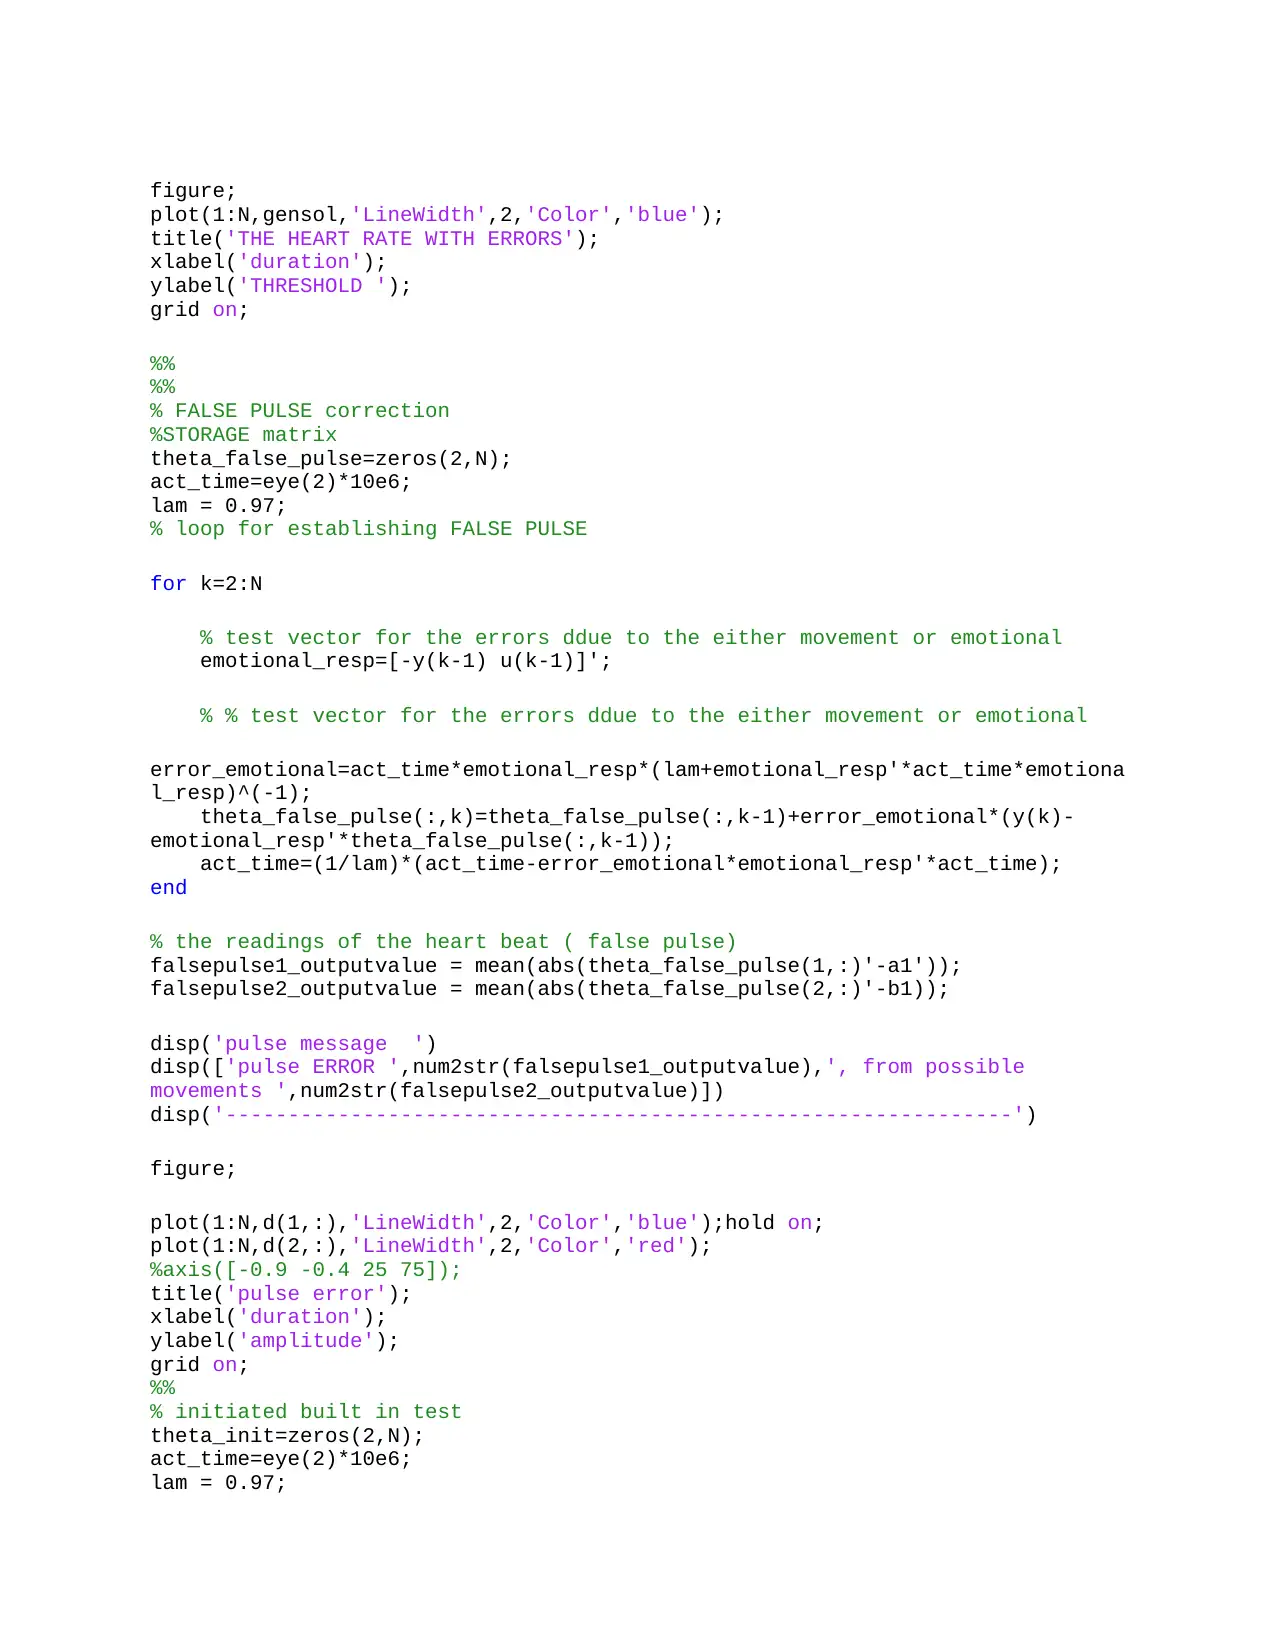
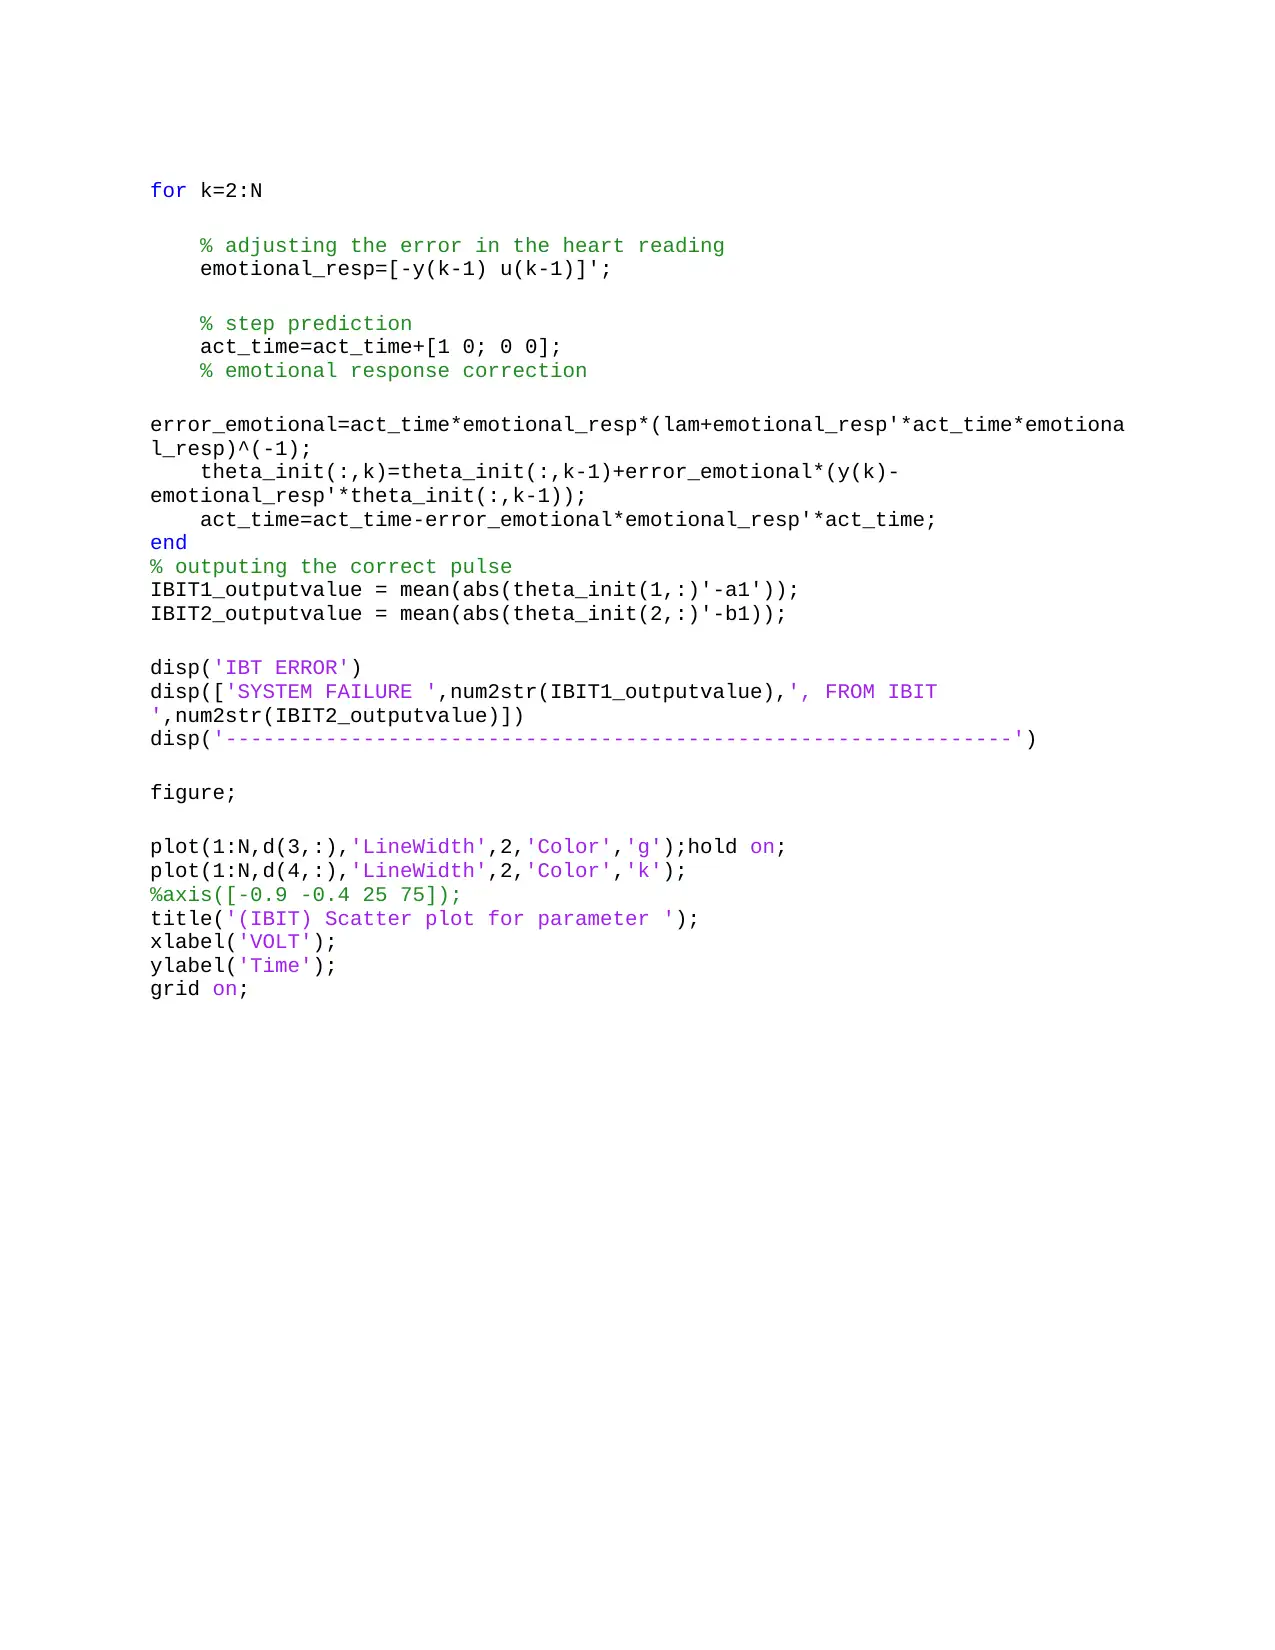
This assignment presents a project undertaken in pursuit of a Bachelor’s Degree in Mechanical Engineering, focusing on the design and analysis of an electrocardiography machine. The project addresses the challenges of accurately measuring heart rates, particularly in scenarios where patient movement or emotional responses introduce errors. The solution employs a harmonic equation to model heart parameters and uses MATLAB for simulation, incorporating techniques to correct for errors arising from patient movements. The assignment includes the development of a system model, a description of the simulator, and the design purpose, aiming to improve the reliability of heart rate monitoring systems. The project also includes the analysis of various parameters such as the mass of the heart, the force from the movement, and the constant of the harmonic equation. Furthermore, the project provides details on the simulation parameters, including the sampling time interval, time vector, and the expected feed voltage in the heart measuring system. The project then simulates the equipment system to determine the heart beat rates with and without errors. The solution also includes the plots of the data of the system machine with no errors, the machine response without errors, the error monitoring using equipment, system error monitoring time, the heart rate with errors, pulse error, and (IBIT) Scatter plot for parameter. The project aims to enhance the accuracy of heart rate measurements, providing a more reliable assessment of a patient's health.
tabler-icon-diamond-filled.svg

Contribute Materials

Your contribution can guide someone’s learning journey. Share your documents today.
Document Page
%% this was developed to correct the errors that occur when reading the heart
rates
... of poeple in hospitals when they make moves when the measurements are
taking place in the hospital
clear all;close all;clc
%% harmonic equation for correctin heart parameters
m1=10000; % the mass of the heart of patient in grams
F=0.0001; % Initial value of force from the movemen
k=72; % the number of heart beats of a normal health person
c=3965; % the constant of the harmonic equation
%% Simulation
% sampling time interval
Ts=0.05;
% time vector
t=(0:2499)*Ts;
% number of iteration
N=2500;
%expect feed voltage in the heart measuring system
u=[ones(1,50),-ones(1,50)];
u=repmat(u,1,N/100);
% the storage matrix for the vector
u(1:10)=zeros(1,10);
% signal from system integrity test
CBIT2_outputvalue=0.003*randn(1,N);
% THE general solution for the simple harmonic equation
gensol=[25*ones(1,500),25+50*sin(2*pi*0.01*(t(501:1500)-
t(500))).^2,25+10*sin(2*pi*0.01*(t(1501:end)-t(1500))).^2];
% equipment parameters:
b1=Ts/m1/F; % time invariant parameter b1
R2=k*exp(c*(1./(gensol+273)-1/289)); % time-varying resistance R2
a1=-1+Ts*(m1+R2)./m1./R2/F; % time-varying parameter a1
% initalise output voltage for the equipment
y=zeros(1,N);
% simulation of equipment system when there is no movements from the
% patient without errors
for k=2:N
y(k)=-a1(k)*y(k-1)+b1*u(k-1)+CBIT2_outputvalue(k);
end
%% Plot data of the system machine with no errors
figure;
plot(1:N,u,'LineWidth',2,'Color','blue');hold on;
plot(1:N,y,'LineWidth',2,'Color','red');
title('heart beats with no errors')
xlabel('Time')
tabler-icon-diamond-filled.svg

Secure Best Marks with AI Grader

Need help grading? Try our AI Grader for instant feedback on your assignments.
Document Page
ylabel('Voltage [V]')
legend('input','output')
%%
figure;
subplot(211)
plot(1:N,gensol,'LineWidth',2,'Color','blue');
title('the machine response without errors ')
ylabel('V');
xlabel('Time');
subplot(212)
plot(1:N,a1,'LineWidth',2,'Color','blue');
title('error monitoring using equipment')
xlabel('Time')
ylabel('volt')
figure;
plot(a1,gensol,'.r');
title('system error monitoring time');
xlabel('time');
ylabel('the structure covered');
grid on;
%% adjusting the errors in the patients hear rate
disp('the adjumnets for errors when the patient moves')
% (CONTINOUES BUILT IN TEST)
% storage vector for poossible errors
theta_test=zeros(2,N);
act_time=eye(2)*10e7;
% loop for establishing heart rate errors dur tp movements
for k=5:N
% test vector for the errors ddue to the either movement or emotional
emotional_resp=[-y(k-1) u(k-1)]'; % possible emotional reponse due to fear
or excite
% calculating errors in reading
error_emotional=act_time*emotional_resp*(1+emotional_resp'*act_time*emotional_
resp)^(-1);
theta_test(:,k)=theta_test(:,k-1)+error_emotional*(y(k)-
emotional_resp'*theta_test(:,k-1));
act_time=act_time-error_emotional*emotional_resp'*act_time;
d=randn(4,2500);
error=d;
end
% estimating the output deviations from the normal heart rate
CBIT1_outputvalue = mean(abs(theta_test(1,:)'-a1'));
CBIT2_outputvalue = mean(abs(theta_test(2,:)'-b1'));
% outputing the error and the margine of the error in the window
disp('error message ')
disp(['HEART RATE ERROR',num2str(CBIT1_outputvalue),', DUE TO PATIENTS
MOVEMENT ',num2str(CBIT2_outputvalue)])
disp('---------------------------------------------------------------')
Document Page
figure;
plot(1:N,gensol,'LineWidth',2,'Color','blue');
title('THE HEART RATE WITH ERRORS');
xlabel('duration');
ylabel('THRESHOLD ');
grid on;
%%
%%
% FALSE PULSE correction
%STORAGE matrix
theta_false_pulse=zeros(2,N);
act_time=eye(2)*10e6;
lam = 0.97;
% loop for establishing FALSE PULSE
for k=2:N
% test vector for the errors ddue to the either movement or emotional
emotional_resp=[-y(k-1) u(k-1)]';
% % test vector for the errors ddue to the either movement or emotional
error_emotional=act_time*emotional_resp*(lam+emotional_resp'*act_time*emotiona
l_resp)^(-1);
theta_false_pulse(:,k)=theta_false_pulse(:,k-1)+error_emotional*(y(k)-
emotional_resp'*theta_false_pulse(:,k-1));
act_time=(1/lam)*(act_time-error_emotional*emotional_resp'*act_time);
end
% the readings of the heart beat ( false pulse)
falsepulse1_outputvalue = mean(abs(theta_false_pulse(1,:)'-a1'));
falsepulse2_outputvalue = mean(abs(theta_false_pulse(2,:)'-b1));
disp('pulse message ')
disp(['pulse ERROR ',num2str(falsepulse1_outputvalue),', from possible
movements ',num2str(falsepulse2_outputvalue)])
disp('---------------------------------------------------------------')
figure;
plot(1:N,d(1,:),'LineWidth',2,'Color','blue');hold on;
plot(1:N,d(2,:),'LineWidth',2,'Color','red');
%axis([-0.9 -0.4 25 75]);
title('pulse error');
xlabel('duration');
ylabel('amplitude');
grid on;
%%
% initiated built in test
theta_init=zeros(2,N);
act_time=eye(2)*10e6;
lam = 0.97;
Document Page
for k=2:N
% adjusting the error in the heart reading
emotional_resp=[-y(k-1) u(k-1)]';
% step prediction
act_time=act_time+[1 0; 0 0];
% emotional response correction
error_emotional=act_time*emotional_resp*(lam+emotional_resp'*act_time*emotiona
l_resp)^(-1);
theta_init(:,k)=theta_init(:,k-1)+error_emotional*(y(k)-
emotional_resp'*theta_init(:,k-1));
act_time=act_time-error_emotional*emotional_resp'*act_time;
end
% outputing the correct pulse
IBIT1_outputvalue = mean(abs(theta_init(1,:)'-a1'));
IBIT2_outputvalue = mean(abs(theta_init(2,:)'-b1));
disp('IBT ERROR')
disp(['SYSTEM FAILURE ',num2str(IBIT1_outputvalue),', FROM IBIT
',num2str(IBIT2_outputvalue)])
disp('---------------------------------------------------------------')
figure;
plot(1:N,d(3,:),'LineWidth',2,'Color','g');hold on;
plot(1:N,d(4,:),'LineWidth',2,'Color','k');
%axis([-0.9 -0.4 25 75]);
title('(IBIT) Scatter plot for parameter ');
xlabel('VOLT');
ylabel('Time');
grid on;
chevron_up_icon
1 out of 4
circle_padding
hide_on_mobile
zoom_out_icon
logo.png

Your All-in-One AI-Powered Toolkit for Academic Success.

Available 24*7 on WhatsApp / Email

[object Object]