Supply Chain Analysis Report: Consumer Complaint Data Analysis
VerifiedAdded on 2020/06/04
|10
|1735
|203
Report
AI Summary
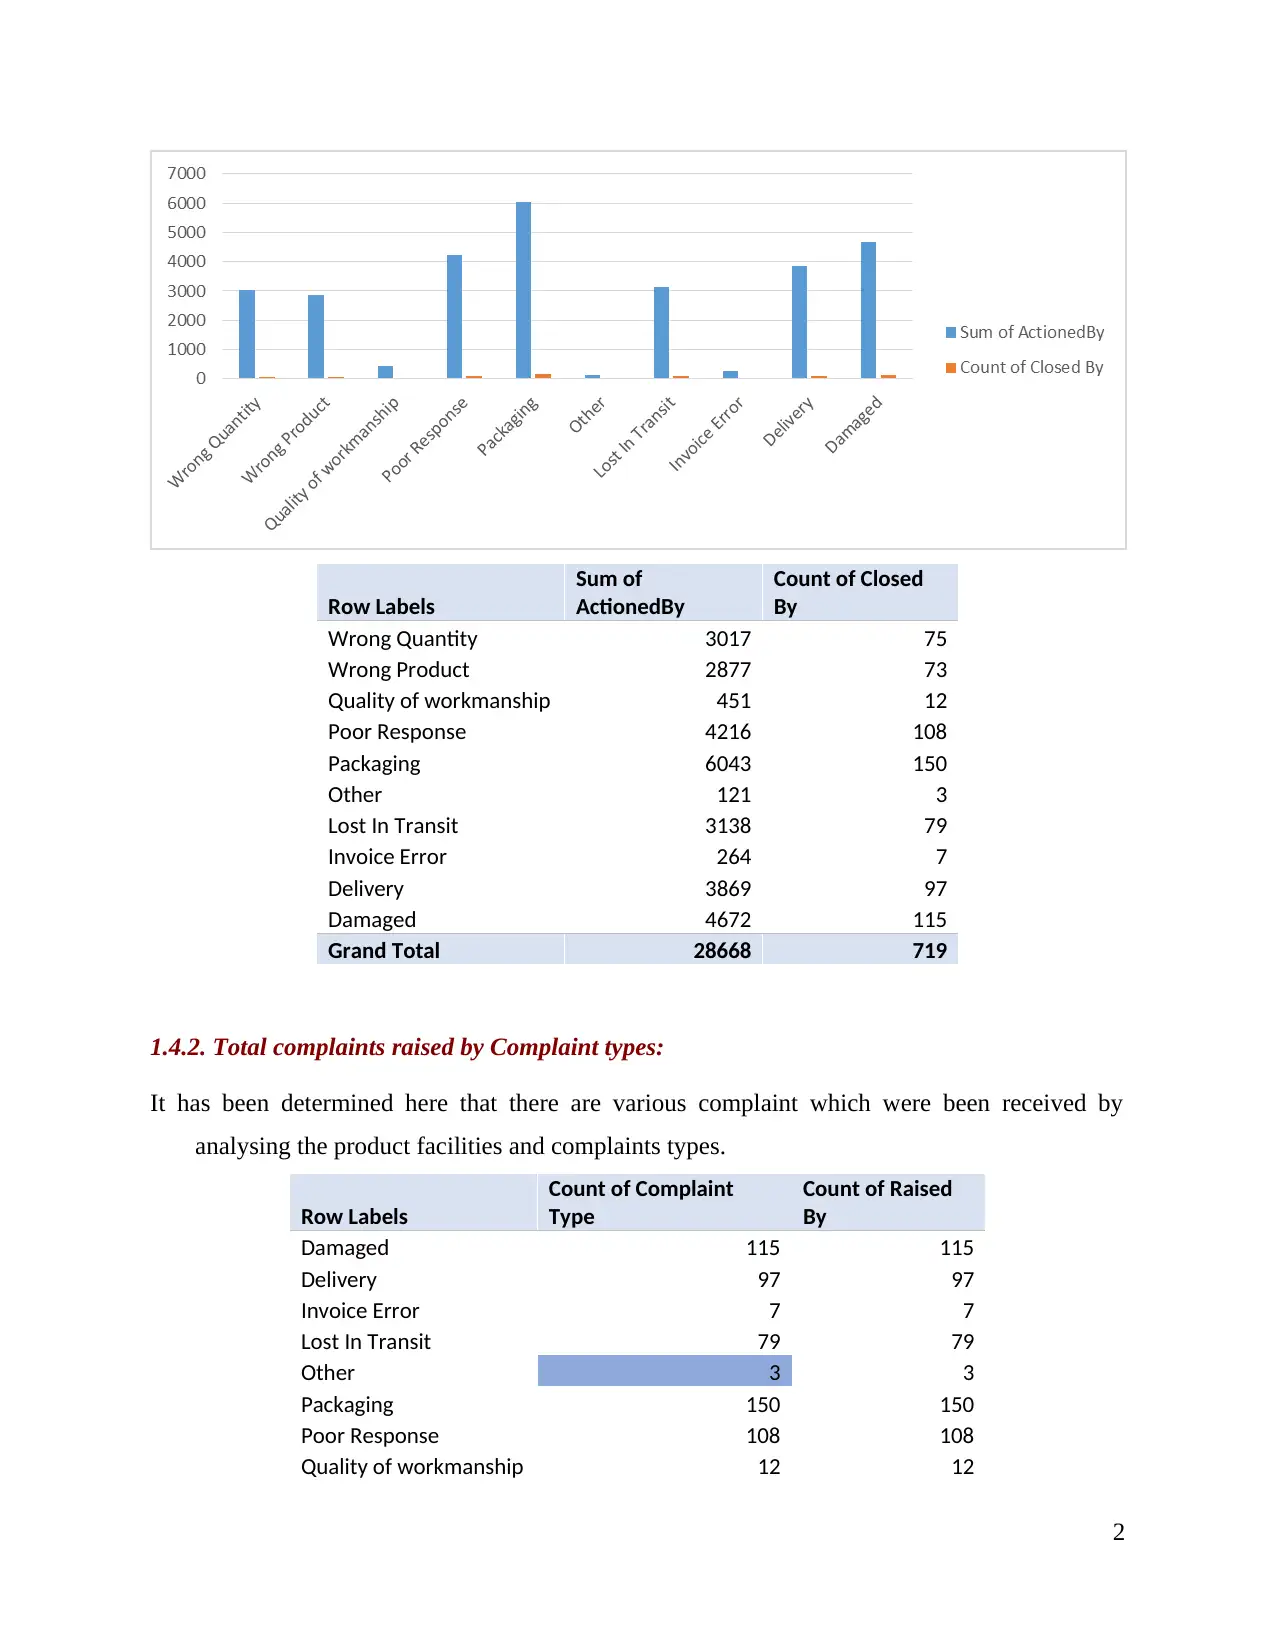
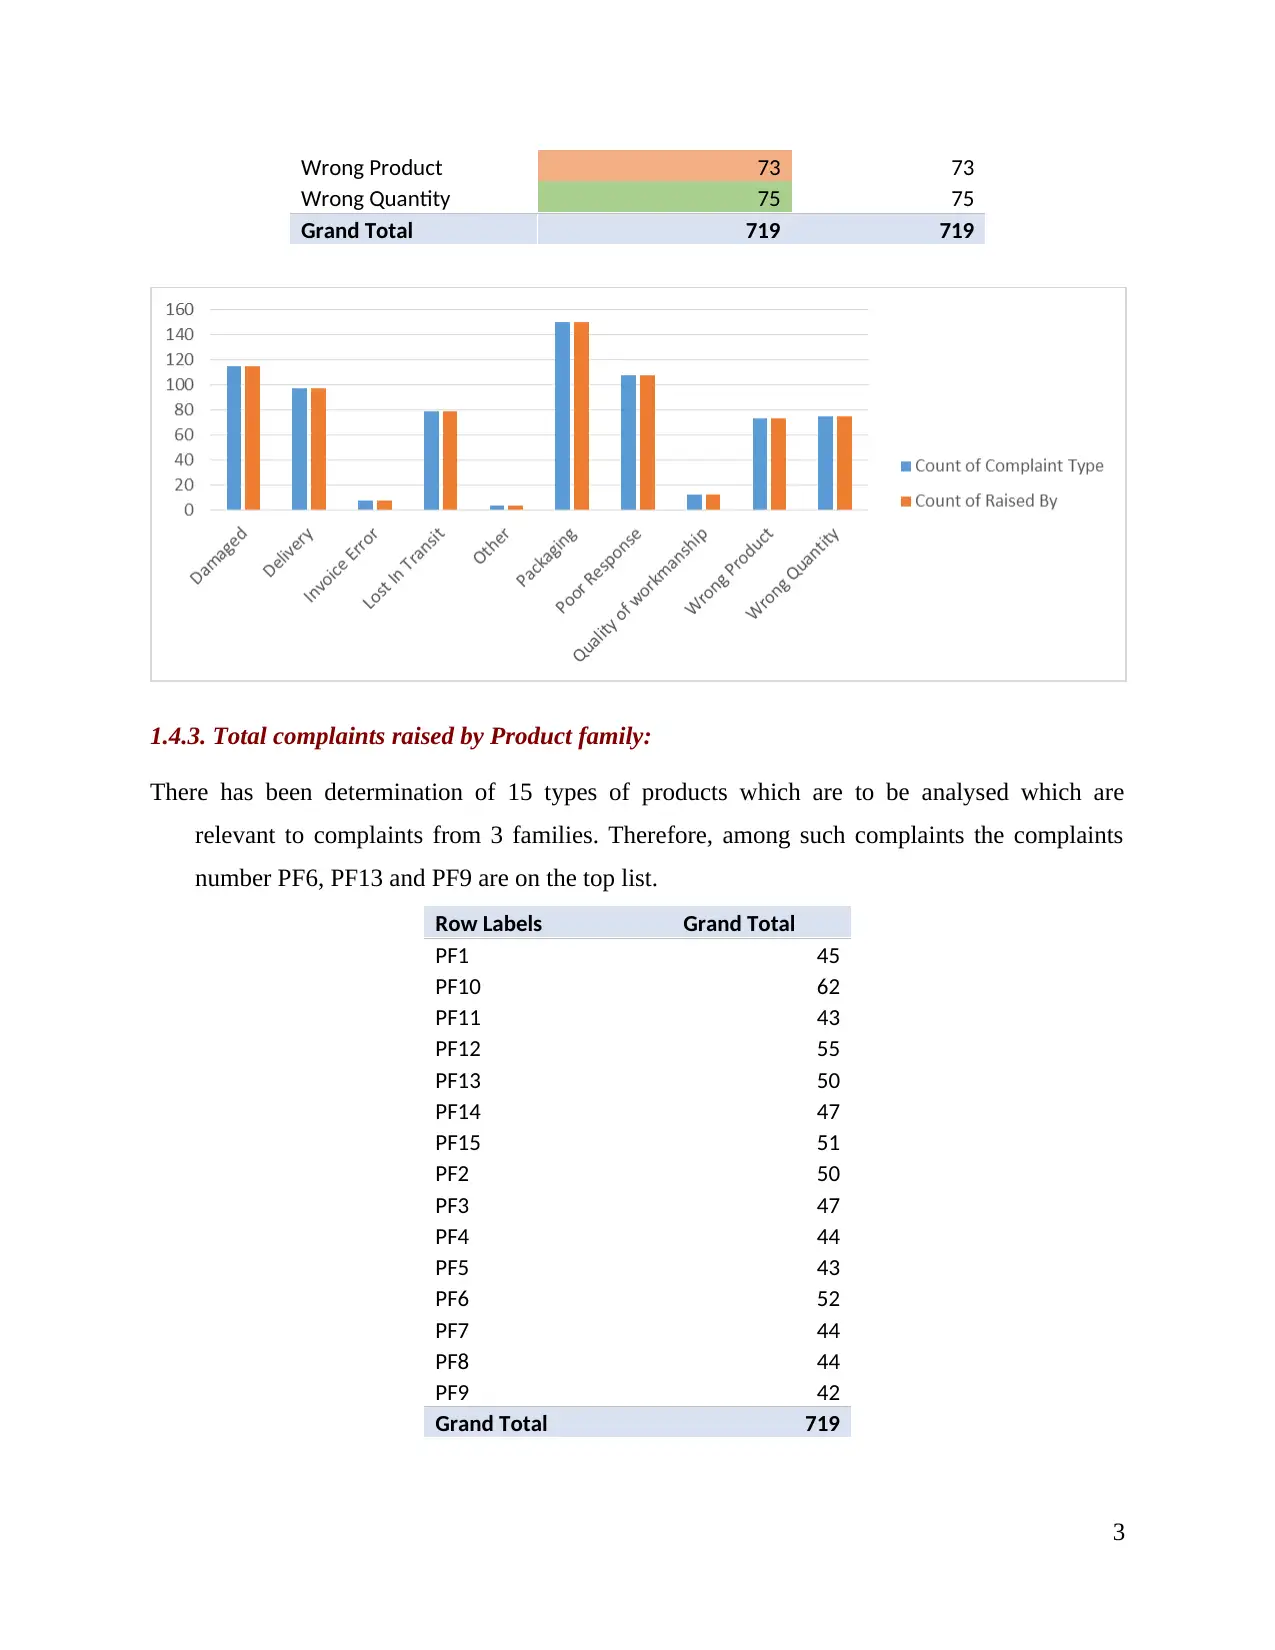
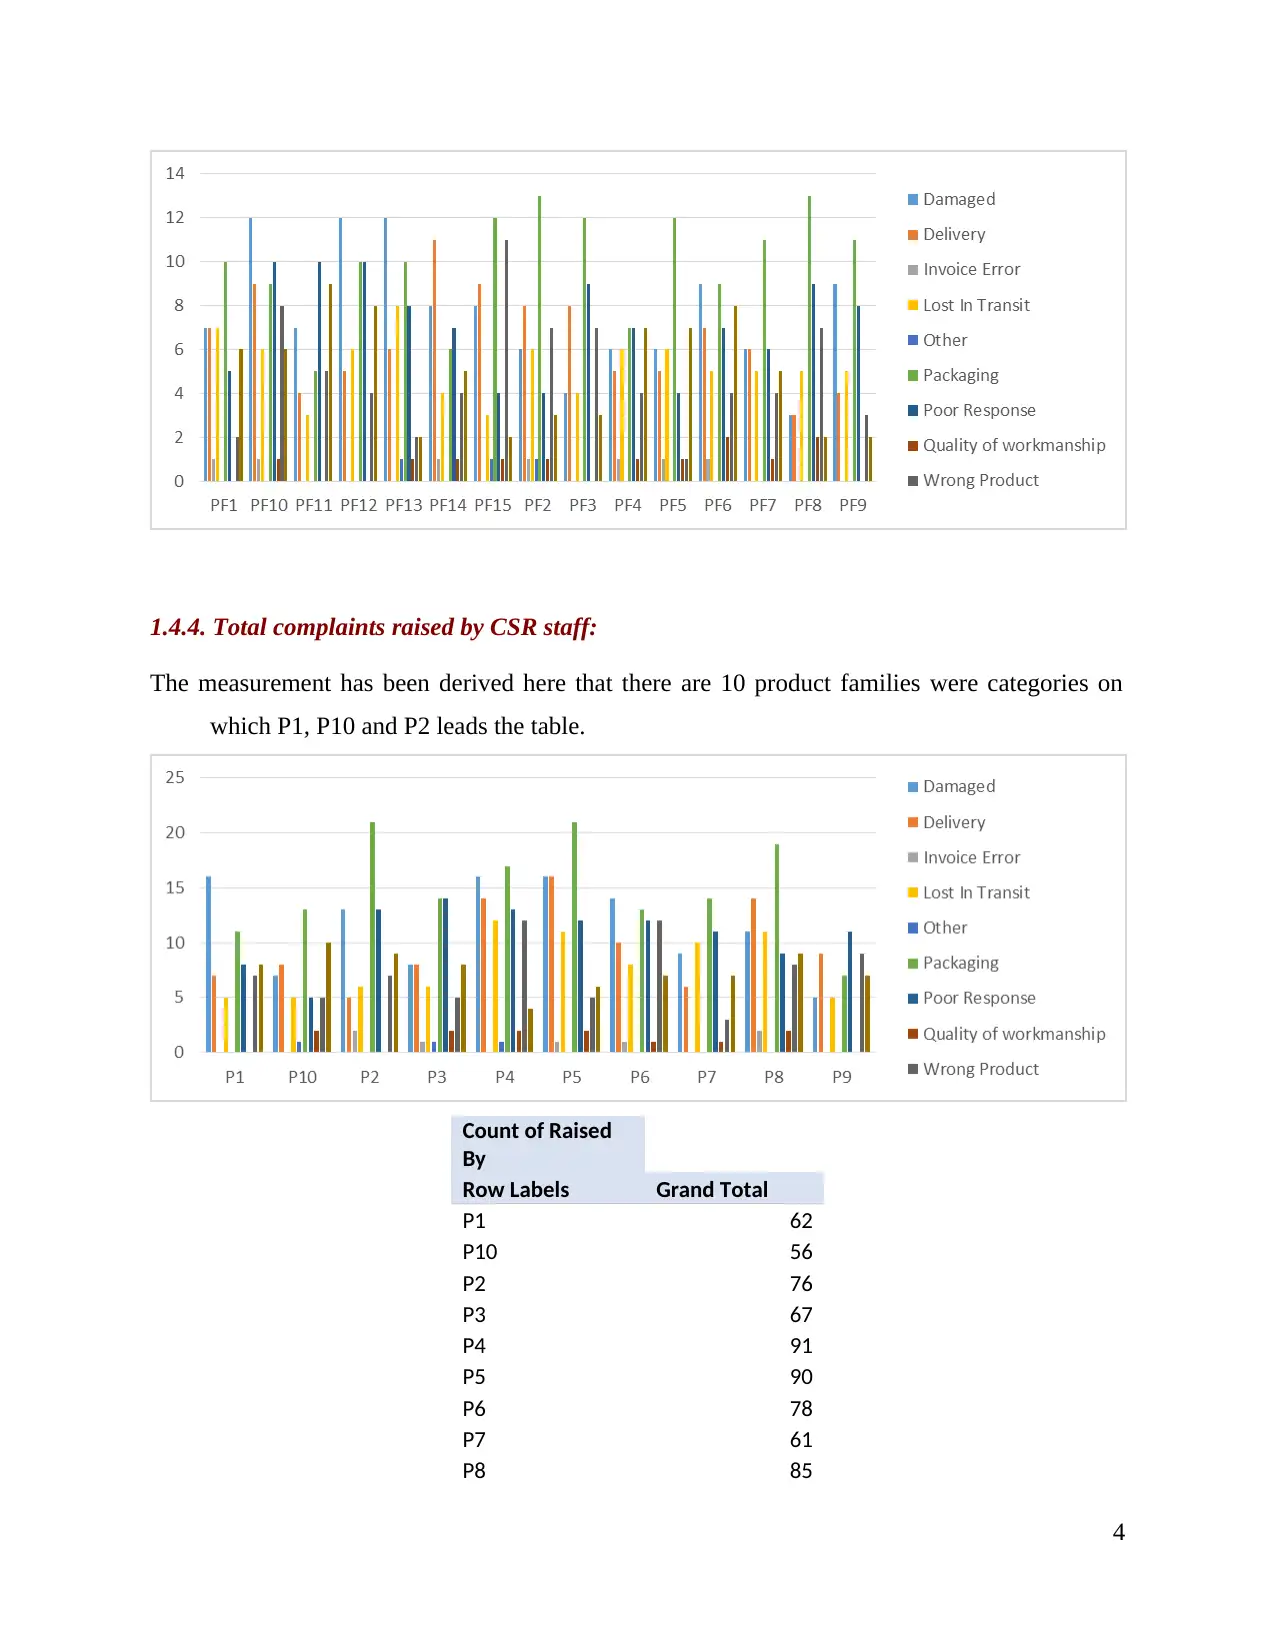
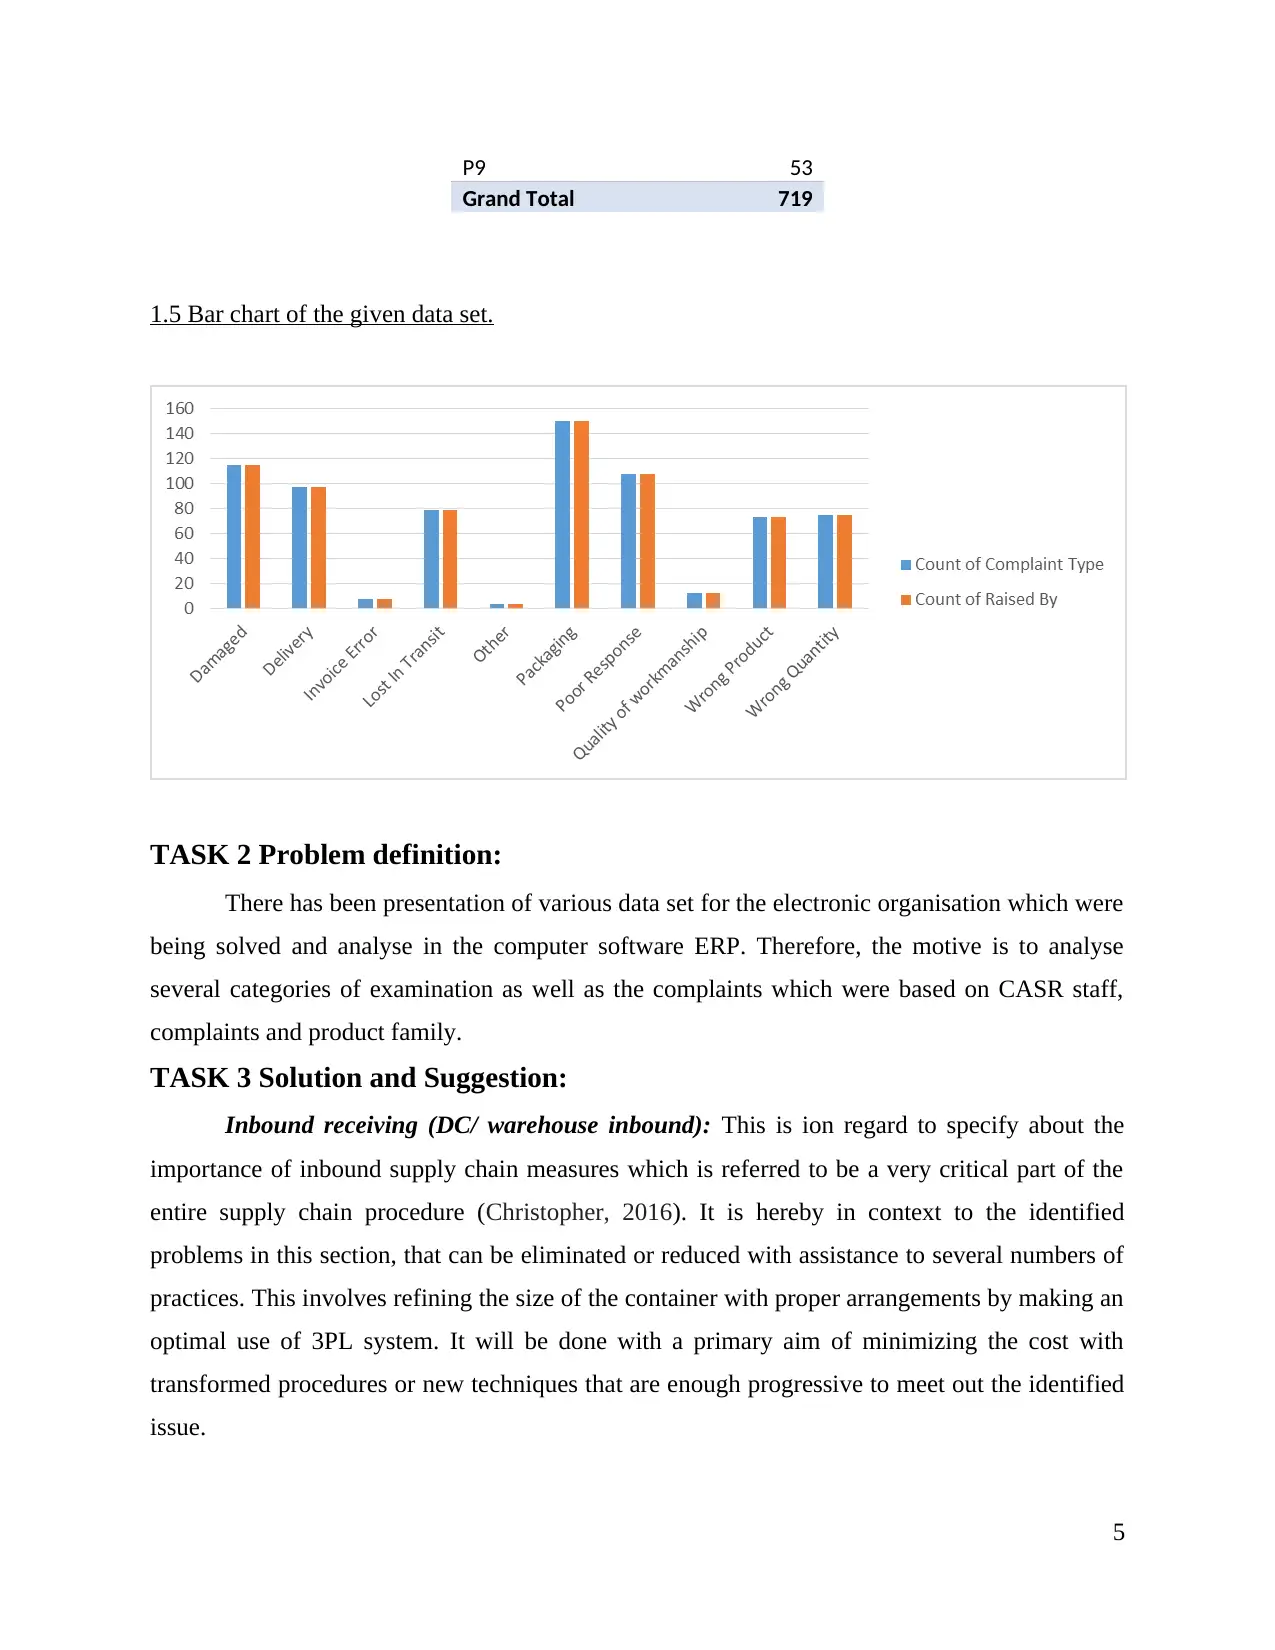
This report presents a comprehensive analysis of an electronic company's supply chain management, focusing on consumer complaints, product families, and CSR staff data. The analysis utilizes various techniques, including SUMPRODUCT and VLOOKUP formulas, pivot tables, and bar charts, to identify patterns and insights. The report examines different complaint types (damage, delivery, wrong product, etc.), product families, and CSR staff performance, providing detailed breakdowns and visualizations. Furthermore, the report defines key problems within the supply chain, such as issues in inbound receiving, put-away operations, outbound dispatch, and warehouse staff communication. It proposes solutions, including optimizing container sizes, implementing programmed mixed-case palletizing, and utilizing electronic product codes and RFID for better tracking and management. The report concludes with a summary of findings and recommendations, supported by references to relevant literature, aiming to improve the company's supply chain efficiency and reduce costs.

SUPPLY CHAIN
ANALYTICS
ANALYTICS
Secure Best Marks with AI Grader
Need help grading? Try our AI Grader for instant feedback on your assignments.

TABLE OF CONTENTS
INTRODUCTION...........................................................................................................................1
TASK 1............................................................................................................................................1
1.1 Product family PF 10 (SUMPRODUCT).........................................................................1
1.2 Using the VLOOKUP formula in context with analysing the wrong product.................1
1.3 Analysing the monthly average complaints from product family....................................1
1.4 preparing the pivot tables in order to analyse the consumer complaints from the given data
set............................................................................................................................................1
1.4.1 Total complaints raised by customers:.....................................................................1
1.4.2. Total complaints raised by Complaint types:..........................................................2
1.4.3. Total complaints raised by Product family:.............................................................3
1.4.4. Total complaints raised by CSR staff:.....................................................................4
1.5 Bar chart of the given data set..........................................................................................5
TASK 2 Problem definition:............................................................................................................5
TASK 3 Solution and Suggestion:...................................................................................................5
CONCLUSION................................................................................................................................6
REFERENCES................................................................................................................................7

EXECUTIVE SUMMARY
In order to analyse the supply chain managements of the corporatisation there has been various
categories and variables which has been making the adequate analysis through the consumer
behaviour and preferences. This, report is being helpful in providing the accurate solution and
determination to the problems over the electronic company. It helps in analysing the utilisation
of the various techniques to identify the supply chain mechanism in this corporations. There will
be examination over the data set such as CSR staff, product families, Consumer complaints etc.
variable which were being analysed and determined as to have appropriate suggestion and
solution to the company.

INTRODUCTION
The use such technique is to assist the product flow and supply chain of the organisation
with the help of various tools and techniques. There can be use of various techniques and
services which will be helpful to the entity in terms of making the adequate changes in the
operations. Therefore, there will be fruitful suggestion which were being facilitated to the
organisation in terms of reducing the costs of manufacture the units, delivery costs, disposal
costs, handling costs, storage etc. they will be suggested to manage their financial and have the
periodical forecast to ascertain the business needs and wants.
TASK 1
Answers for Task 1.1 Task 1.2 Task 1.3
FALSE Warehouse 42087
1.1 Product family PF 10 (SUMPRODUCT)
In relation with analysing the sum product from the given data set it has been analysed
here the false value. Moreover, the value for PF10 is as false value.
1.2 Using the VLOOKUP formula in context with analysing the wrong product
To analyse the consumer value for C9 it has been analysed as the maximum complaints
derived from warehouse from the given data set.
1.3 Analysing the monthly average complaints from product family
To analyse the monthly average value there has been use of the data range as response date
and product family. Therefore, it ascertains that there will be average of 42087.
1.4 preparing the pivot tables in order to analyse the consumer complaints from the given data
set.
1.4.1 Total complaints raised by customers:
There has been determination of 9 kinds of problems such as damage, deliver, wrong, quantity,
wrong products etc. which has been analysed in the excel file.
1
Secure Best Marks with AI Grader
Need help grading? Try our AI Grader for instant feedback on your assignments.

Row Labels
Sum of
ActionedBy
Count of Closed
By
Wrong Quantity 3017 75
Wrong Product 2877 73
Quality of workmanship 451 12
Poor Response 4216 108
Packaging 6043 150
Other 121 3
Lost In Transit 3138 79
Invoice Error 264 7
Delivery 3869 97
Damaged 4672 115
Grand Total 28668 719
1.4.2. Total complaints raised by Complaint types:
It has been determined here that there are various complaint which were been received by
analysing the product facilities and complaints types.
Row Labels
Count of Complaint
Type
Count of Raised
By
Damaged 115 115
Delivery 97 97
Invoice Error 7 7
Lost In Transit 79 79
Other 3 3
Packaging 150 150
Poor Response 108 108
Quality of workmanship 12 12
2

Wrong Product 73 73
Wrong Quantity 75 75
Grand Total 719 719
1.4.3. Total complaints raised by Product family:
There has been determination of 15 types of products which are to be analysed which are
relevant to complaints from 3 families. Therefore, among such complaints the complaints
number PF6, PF13 and PF9 are on the top list.
Row Labels Grand Total
PF1 45
PF10 62
PF11 43
PF12 55
PF13 50
PF14 47
PF15 51
PF2 50
PF3 47
PF4 44
PF5 43
PF6 52
PF7 44
PF8 44
PF9 42
Grand Total 719
3

1.4.4. Total complaints raised by CSR staff:
The measurement has been derived here that there are 10 product families were categories on
which P1, P10 and P2 leads the table.
Count of Raised
By
Row Labels Grand Total
P1 62
P10 56
P2 76
P3 67
P4 91
P5 90
P6 78
P7 61
P8 85
4
The measurement has been derived here that there are 10 product families were categories on
which P1, P10 and P2 leads the table.
Count of Raised
By
Row Labels Grand Total
P1 62
P10 56
P2 76
P3 67
P4 91
P5 90
P6 78
P7 61
P8 85
4
Paraphrase This Document
Need a fresh take? Get an instant paraphrase of this document with our AI Paraphraser

P9 53
Grand Total 719
1.5 Bar chart of the given data set.
TASK 2 Problem definition:
There has been presentation of various data set for the electronic organisation which were
being solved and analyse in the computer software ERP. Therefore, the motive is to analyse
several categories of examination as well as the complaints which were based on CASR staff,
complaints and product family.
TASK 3 Solution and Suggestion:
Inbound receiving (DC/ warehouse inbound): This is ion regard to specify about the
importance of inbound supply chain measures which is referred to be a very critical part of the
entire supply chain procedure (Christopher, 2016). It is hereby in context to the identified
problems in this section, that can be eliminated or reduced with assistance to several numbers of
practices. This involves refining the size of the container with proper arrangements by making an
optimal use of 3PL system. It will be done with a primary aim of minimizing the cost with
transformed procedures or new techniques that are enough progressive to meet out the identified
issue.
5

Put away and operations- This involves techniques to reduce the problems related to the
supply chain management. It can be done by using methods of programmed mixed case
pelletizing, cross docking or container packing, etc. All these methods are not only evident to
resolve the supply chain related issues but are also proven to produce improved results with
enhanced productivity and lowered costs of transportation and labour, etc. (Wilting and van
Oorschot, 2017).
Outbound or dispatch (D/C Warehouse outbound)- Also known as outbound logistics
networking design, it plays a significant role in company’s supply chain management and is thus
required to be processed in well-defined manner (Du and et. al., 2015). It is basically due to its
capable outlook where it plays a contributory role in deciding the success or failure of an
undertaken supply chain method (Jacobs, Chase and Lummus, 2014). It is thereby important for
the designers of this process to closely focus upon its design, storage capacity, plant locations
and consumer’s requirements, etc.
Warehouse staffs- This is to discourse upon the identified issues among the staff
responsible for smooth warehouse functioning where any poor communication can lead to create
vital number of challenges. However, a centralised system can lead to an effective integration of
all company resources (Pingmuanglek, Jakrawatana and Gheewala, 2017). It is with a significant
role of electronic product codes called EPD and radio frequency identification (RFID) that can
be used for controlling the quality, type and numerous other factors related to the process of
supply chain management (Validi, Bhattacharya and Byrne, 2014). This can also lead to easy
tracking of the products by rapidly decreasing the costs related to labours, etc.
CONCLUSION
On the basis of above analysis it can be said that there are various operations which were
being made as to analyse the data set of the electronic company. Moreover, there have been use
of ERP software from the devices as to analyse such data set. There has been observation made
over variables like, products, CSR staff etc. which in turn helpful for analysing the supply chain
of the organisation for the categories like, warehouse, deliveries etc. Further, there are various
issues which were being faced by while analysing the desirable results.
6

REFERENCES
Books and Journals
Christopher, M., 2016. Logistics & supply chain management. Pearson UK.
Du, S. and et. al., 2015. Game-theoretic analysis for an emission-dependent supply chain in a
‘cap-and-trade’system. Annals of Operations Research. 228(1). pp.135-149.
Jacobs, F.R., Chase, R.B. and Lummus, R.R., 2014. Operations and supply chain
management (pp. 533-535). New York, NY: McGraw-Hill/Irwin.
Pingmuanglek, P., Jakrawatana, N. and Gheewala, S.H., 2017. Supply chain analysis for cassava
starch production: Cleaner production opportunities and benefits. Journal of Cleaner
Production. 162. pp.1075-1084.
Validi, S., Bhattacharya, A. and Byrne, P.J., 2014. A case analysis of a sustainable food supply
chain distribution system—A multi-objective approach. International Journal of
Production Economics. 152. pp.71-87.
Wilting, H.C. and van Oorschot, M.M., 2017. Quantifying biodiversity footprints of Dutch
economic sectors: A global supply-chain analysis. Journal of cleaner production. 156. pp.194-
202.
7
1 out of 10
Related Documents

Your All-in-One AI-Powered Toolkit for Academic Success.
+13062052269
info@desklib.com
Available 24*7 on WhatsApp / Email
Unlock your academic potential
© 2024 | Zucol Services PVT LTD | All rights reserved.