ELISA Laboratory Report: Antibody Detection and Assaying in Serum
VerifiedAdded on 2023/05/29
|9
|1631
|206
Report
AI Summary
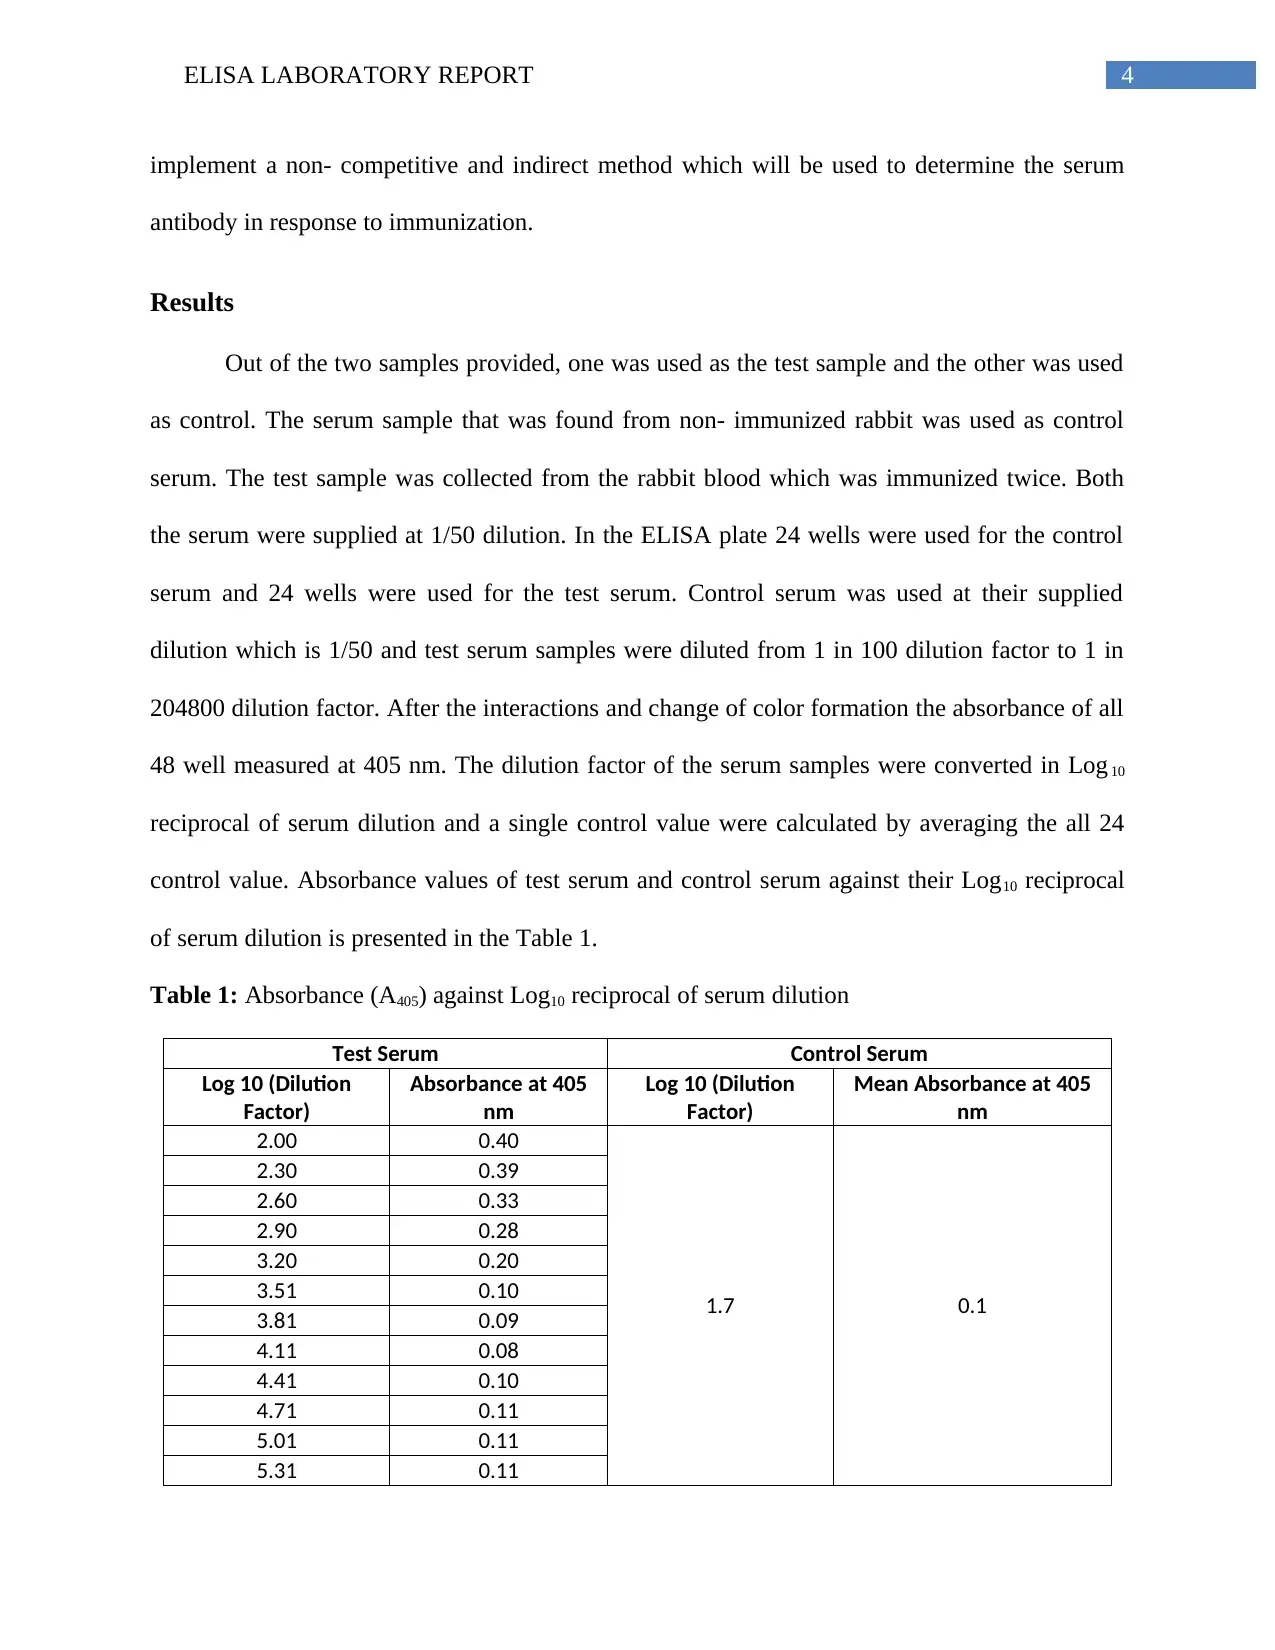
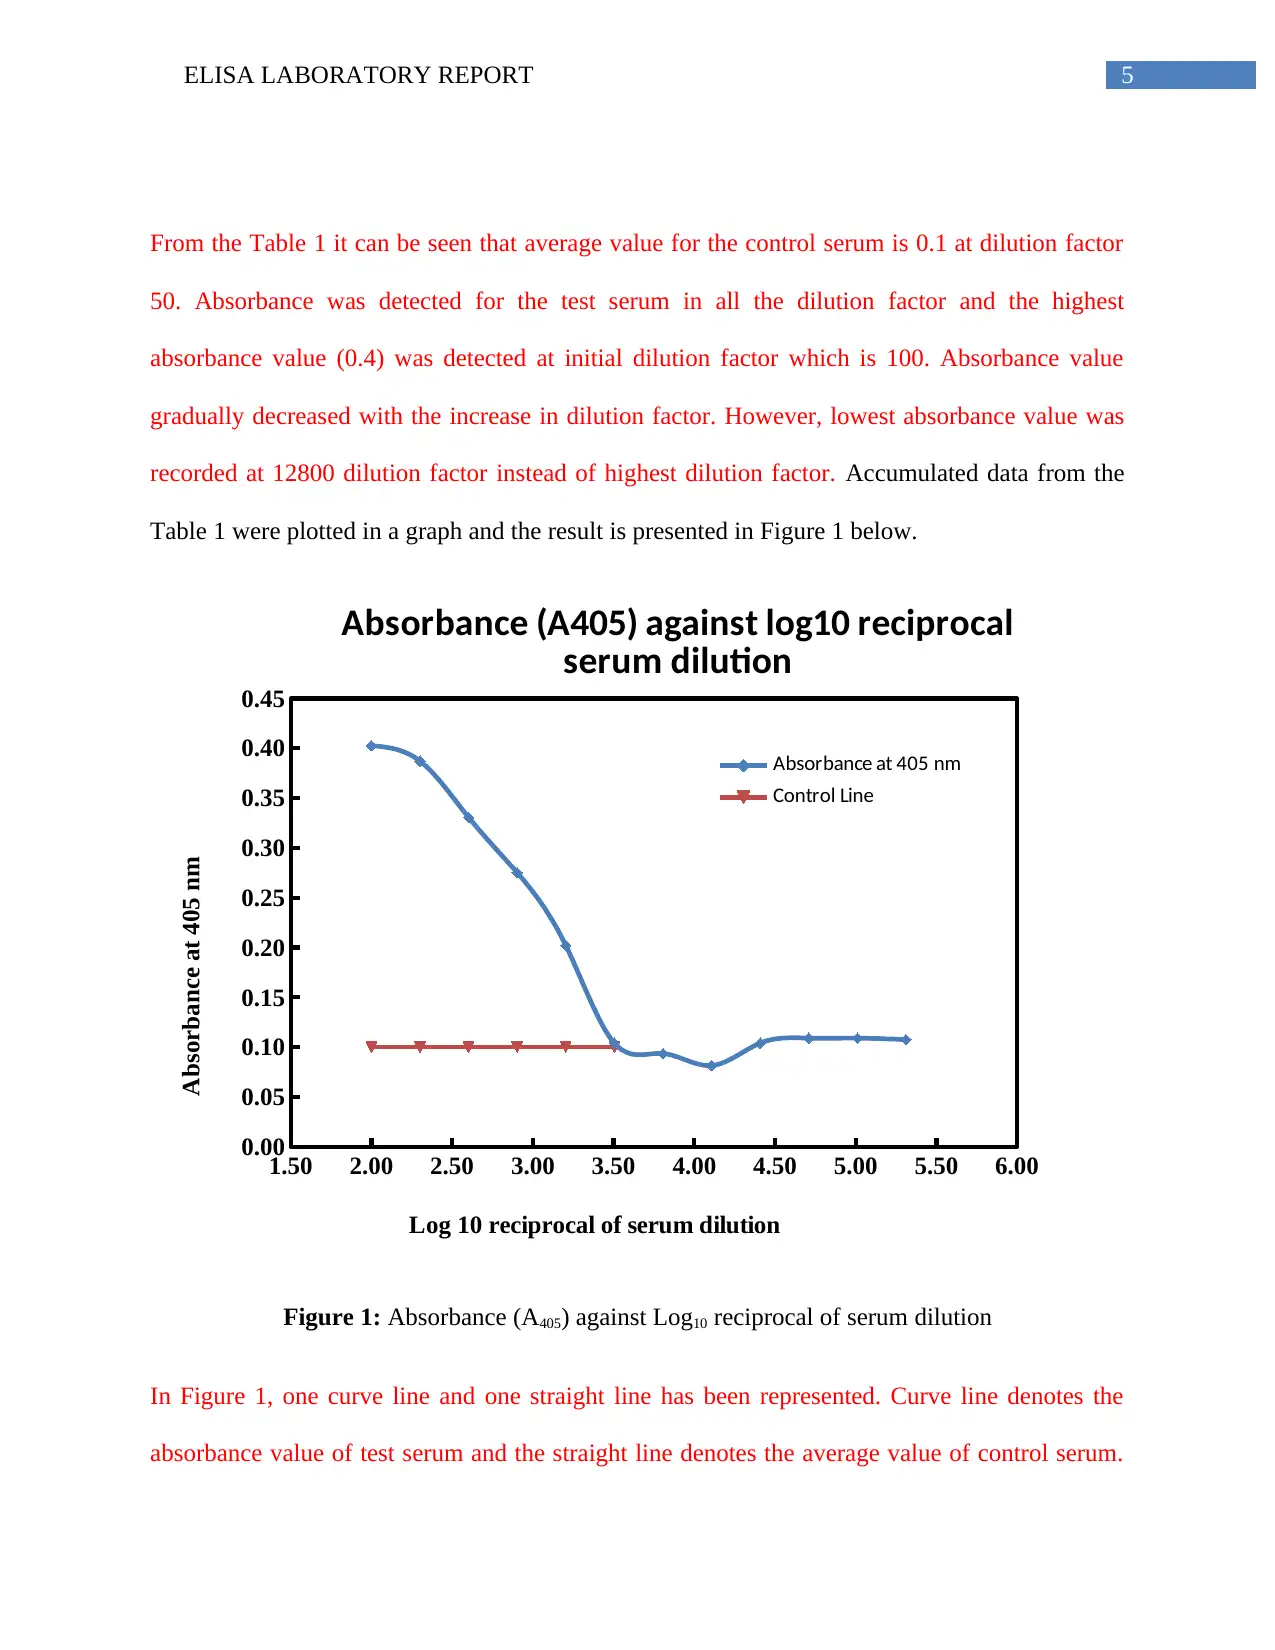
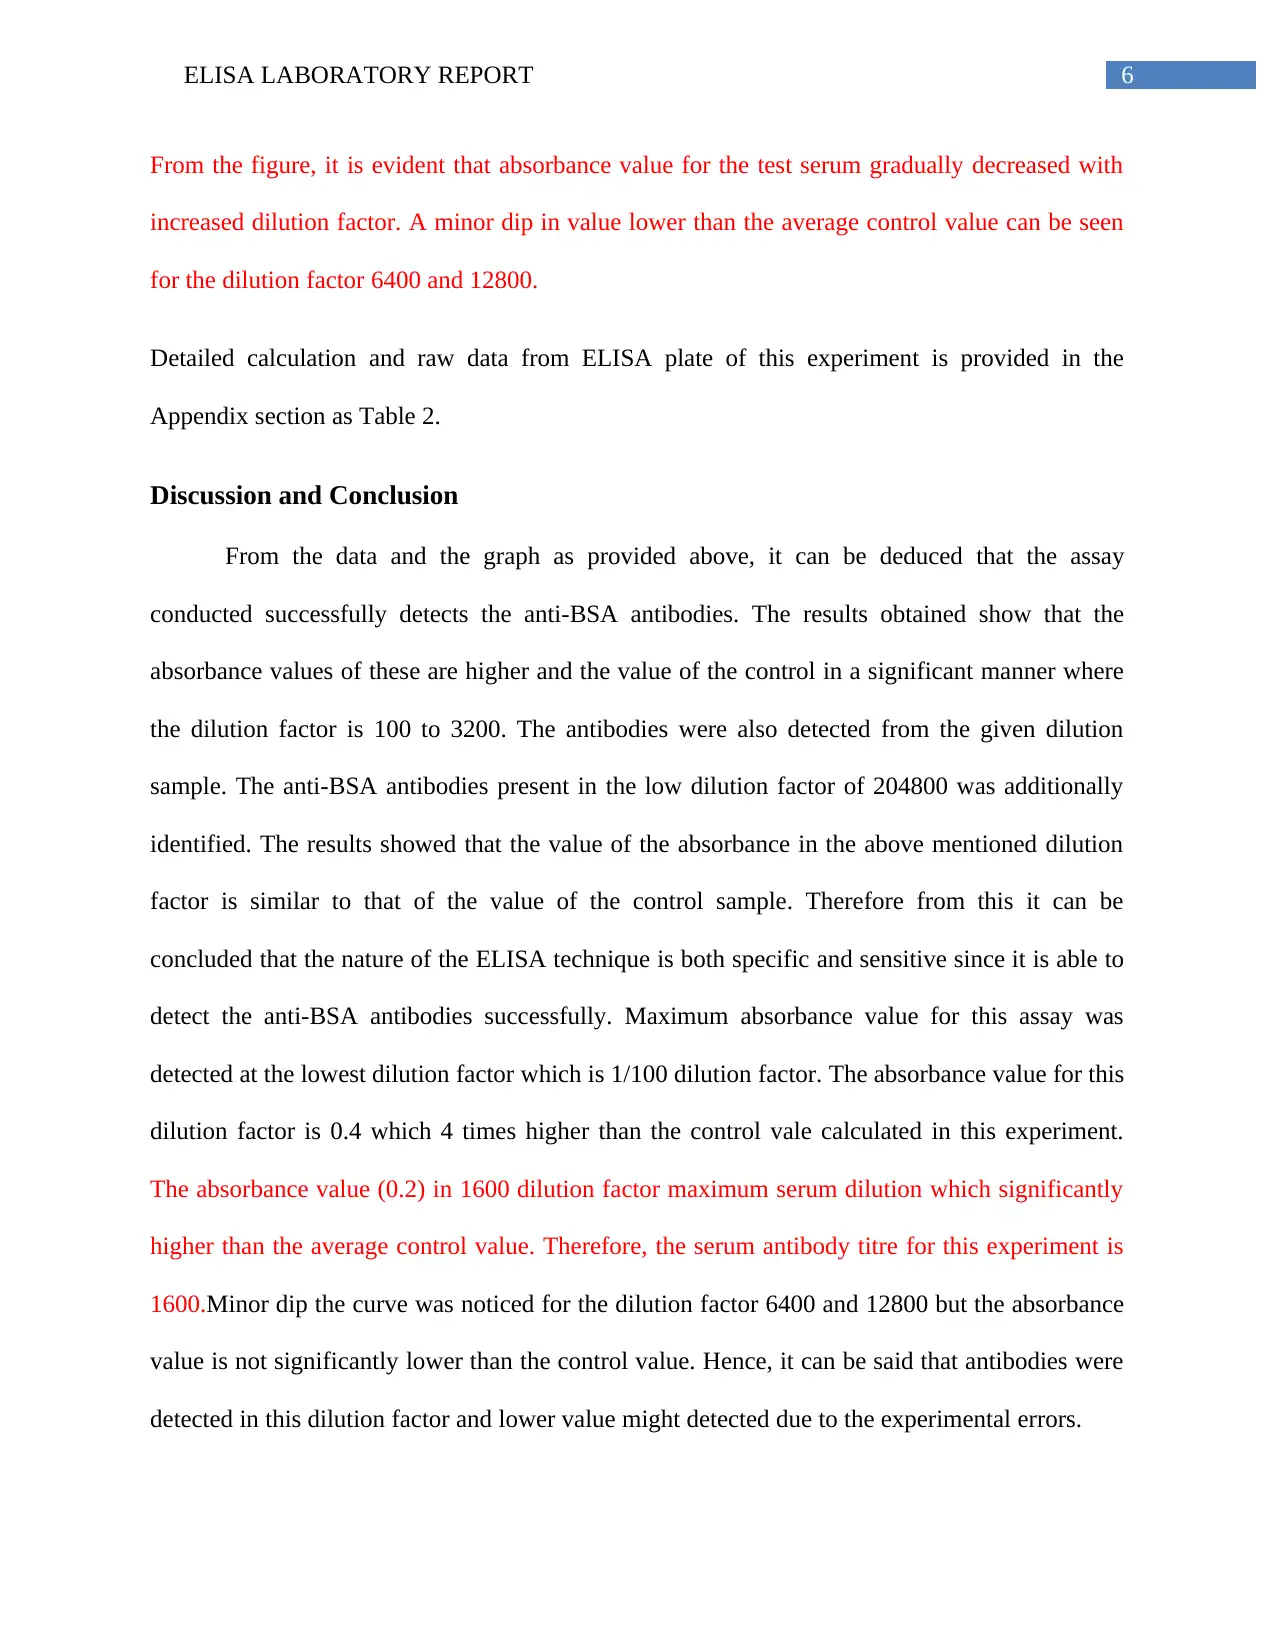
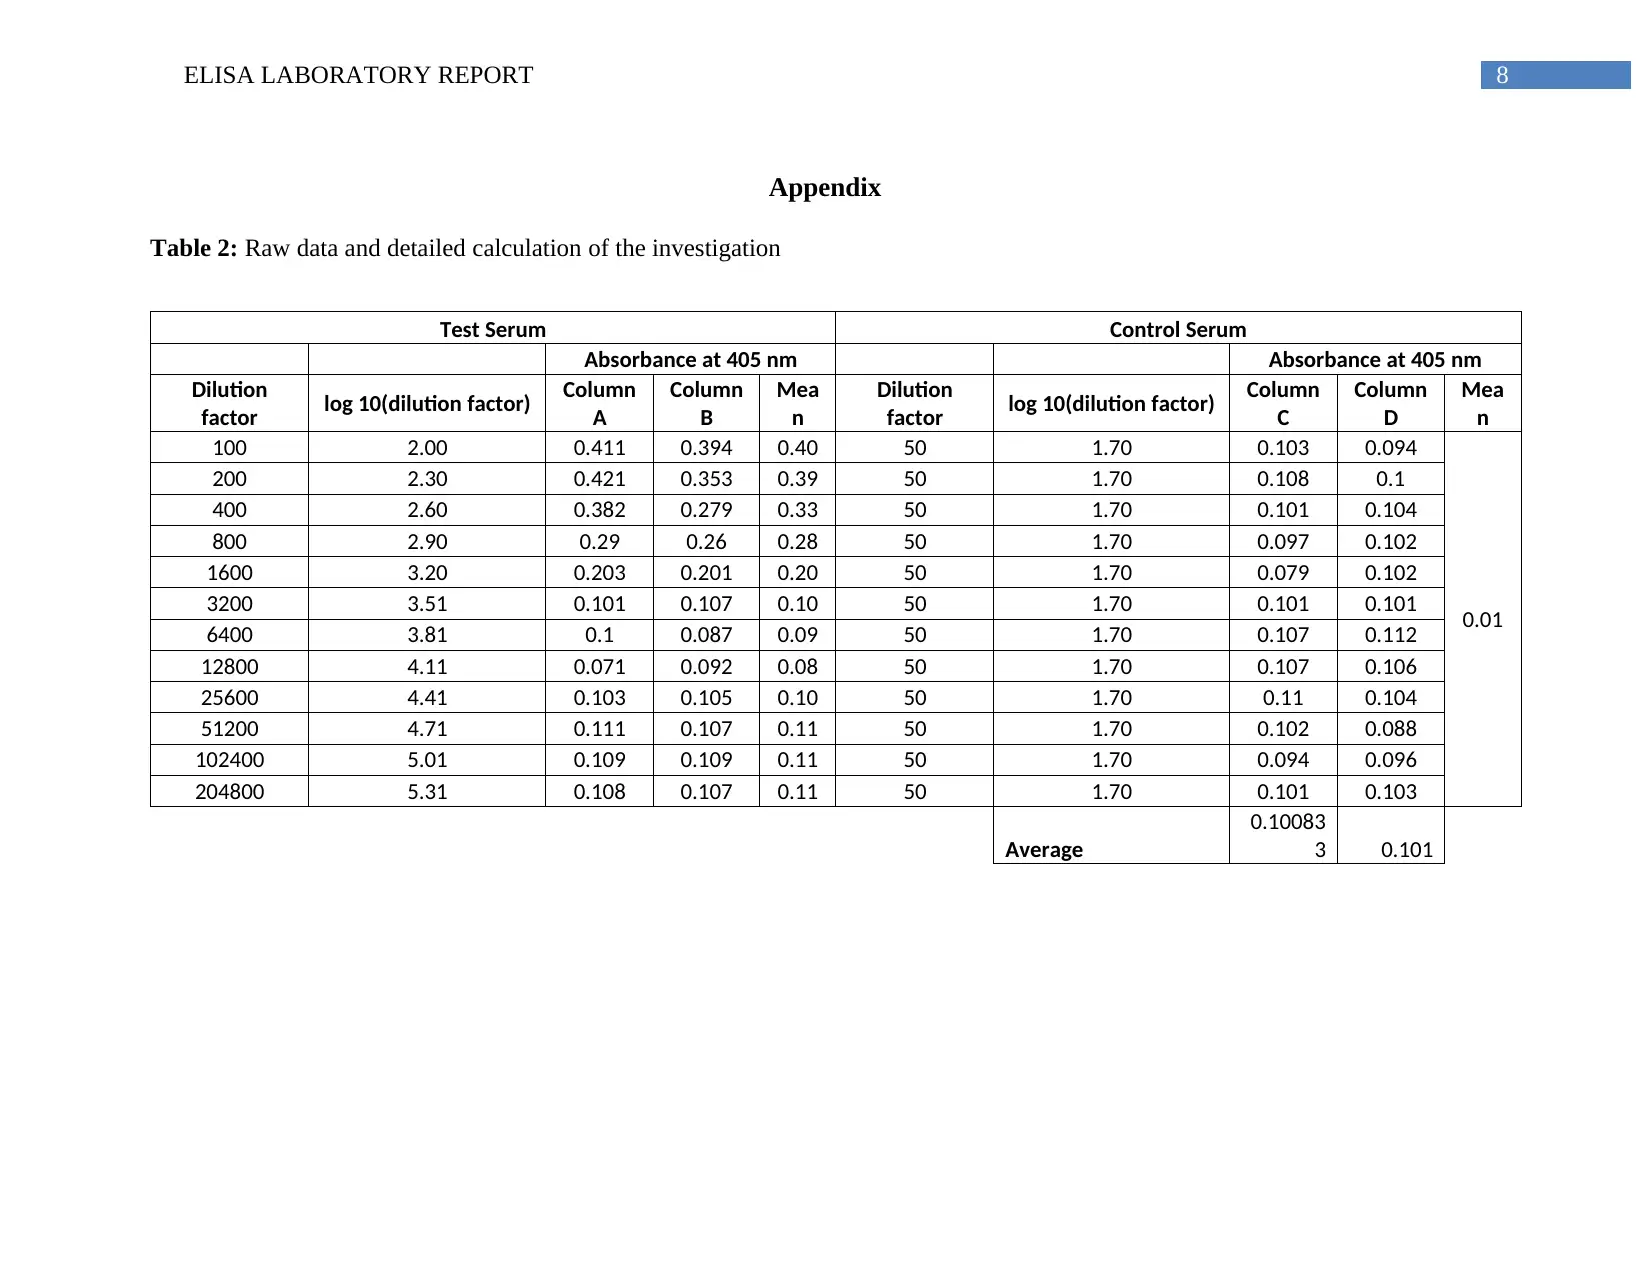
This ELISA laboratory report details the detection and assaying of antibodies in serum samples using the Enzyme-Linked Immunosorbent Assay (ELISA) technique. The study focuses on identifying anti-BSA antibodies in rabbit blood, comparing a test serum (immunized with BSA) against a control serum (non-immunized). Results indicate a maximum absorbance at 0.4 for anti-BSA antibodies at a 1/100 dilution factor, with a serum antibody titre of 1600. The report concludes that the ELISA technique is sensitive and specific, successfully detecting antibodies even at low concentrations, and includes a detailed discussion of the methodology, results, and their implications, along with raw data and calculations in the appendix.
Contribute Materials
Your contribution can guide someone’s learning journey. Share your
documents today.

Running head: ELISA LABORATORY REPORT
ELISA laboratory report
Name of the Student
Name of the University
Author’s note:
ELISA laboratory report
Name of the Student
Name of the University
Author’s note:
Secure Best Marks with AI Grader
Need help grading? Try our AI Grader for instant feedback on your assignments.

1ELISA LABORATORY REPORT
Abstract
The standard procedure for the detection and assaying of antibodies as well as presence
of antigens in the blood stream is ELISA or Enzyme- Linked Immunosorbent Assay. Some of the
major applications of this assaying technique can be witnessed in the case of detected of diseases
like Zika virus, HIV, carcinoma and other such infectious diseases. This study aims to highlight
the presence of the antibody that is present in the sample of the serum through the performance
of ELISA. From the rabbit blood the control as well as the test serum which needs to be used for
the assay. This blood was then immunized using BSA however for the control serum the
procedure was not followed. In most of the dilution factors having a maximum absorbance at 0.4
the anti-BSA antibodies were identified at an initial dilution (1/100) factor. The maximum
antibody serum titre for this test is at the dilution factor of 1600. The nature of the test was
sensitive.

2ELISA LABORATORY REPORT
Table of Contents
Introduction..................................................................................................................................3
Results..........................................................................................................................................4
Discussion and Conclusion..........................................................................................................6
References....................................................................................................................................7
Appendix......................................................................................................................................8

3ELISA LABORATORY REPORT
Introduction
The standard procedure for the detection and assaying of antibodies as well as presence
of antigens in the blood stream is ELISA or Enzyme- Linked Immunosorbent Assay which is an
extremely sensitive assay technique. Some of the major applications of this assaying technique
can be witnessed in the case of detected of diseases like Zika virus, HIV, carcinoma and other
such infectious diseases. In this technique, the reactants of ELISA became immobilised on the
microplate surface which in turn makes the process easier to separate the non- bound and bound
material during the assay. As a direct consequence, ELISA assay technique able to wash away
the non-specifically bound material. This makes ELISA a potent tool for assaying specific
analytes. An identification protein or other tag can be connected straightforwardly to the
essential counter acting agent or presented through an auxiliary immune response that perceives
the essential immunizer. It can likewise be connected to a protein, for example, streptavidin if the
essential counter acting agent is biotin marked. The most normally utilized protein marks are
horseradish peroxidase (HRP) and basic phosphatase (AP). Different proteins have been utilized
too, yet they have not increased across the board acknowledgment as a result of constrained
substrate choices. These incorporate acetylcholinesterase, catalase, and β-galactosidase. An
expansive choice of substrates is accessible for performing ELISA with an AP conjugate or
HRP. The decision of substrate relies on the required measure affectability and the
instrumentation accessible for flag location (fluorometer, luminometer, or spectrophotometer).
The primary objective of this study is to assess and identify the presence of the antibodies
in the sample of the serum which is providing the ELISA technique. The study also aims to
present the clinical accuracy of the conducted test. In the following study the method will
Secure Best Marks with AI Grader
Need help grading? Try our AI Grader for instant feedback on your assignments.

4ELISA LABORATORY REPORT
implement a non- competitive and indirect method which will be used to determine the serum
antibody in response to immunization.
Results
Out of the two samples provided, one was used as the test sample and the other was used
as control. The serum sample that was found from non- immunized rabbit was used as control
serum. The test sample was collected from the rabbit blood which was immunized twice. Both
the serum were supplied at 1/50 dilution. In the ELISA plate 24 wells were used for the control
serum and 24 wells were used for the test serum. Control serum was used at their supplied
dilution which is 1/50 and test serum samples were diluted from 1 in 100 dilution factor to 1 in
204800 dilution factor. After the interactions and change of color formation the absorbance of all
48 well measured at 405 nm. The dilution factor of the serum samples were converted in Log 10
reciprocal of serum dilution and a single control value were calculated by averaging the all 24
control value. Absorbance values of test serum and control serum against their Log10 reciprocal
of serum dilution is presented in the Table 1.
Table 1: Absorbance (A405) against Log10 reciprocal of serum dilution
Test Serum Control Serum
Log 10 (Dilution
Factor)
Absorbance at 405
nm
Log 10 (Dilution
Factor)
Mean Absorbance at 405
nm
2.00 0.40
1.7 0.1
2.30 0.39
2.60 0.33
2.90 0.28
3.20 0.20
3.51 0.10
3.81 0.09
4.11 0.08
4.41 0.10
4.71 0.11
5.01 0.11
5.31 0.11

5ELISA LABORATORY REPORT
From the Table 1 it can be seen that average value for the control serum is 0.1 at dilution factor
50. Absorbance was detected for the test serum in all the dilution factor and the highest
absorbance value (0.4) was detected at initial dilution factor which is 100. Absorbance value
gradually decreased with the increase in dilution factor. However, lowest absorbance value was
recorded at 12800 dilution factor instead of highest dilution factor. Accumulated data from the
Table 1 were plotted in a graph and the result is presented in Figure 1 below.
1.50 2.00 2.50 3.00 3.50 4.00 4.50 5.00 5.50 6.00
0.00
0.05
0.10
0.15
0.20
0.25
0.30
0.35
0.40
0.45
Absorbance (A405) against log10 reciprocal
serum dilution
Absorbance at 405 nm
Control Line
Log 10 reciprocal of serum dilution
Absorbance at 405 nm
Figure 1: Absorbance (A405) against Log10 reciprocal of serum dilution
In Figure 1, one curve line and one straight line has been represented. Curve line denotes the
absorbance value of test serum and the straight line denotes the average value of control serum.

6ELISA LABORATORY REPORT
From the figure, it is evident that absorbance value for the test serum gradually decreased with
increased dilution factor. A minor dip in value lower than the average control value can be seen
for the dilution factor 6400 and 12800.
Detailed calculation and raw data from ELISA plate of this experiment is provided in the
Appendix section as Table 2.
Discussion and Conclusion
From the data and the graph as provided above, it can be deduced that the assay
conducted successfully detects the anti-BSA antibodies. The results obtained show that the
absorbance values of these are higher and the value of the control in a significant manner where
the dilution factor is 100 to 3200. The antibodies were also detected from the given dilution
sample. The anti-BSA antibodies present in the low dilution factor of 204800 was additionally
identified. The results showed that the value of the absorbance in the above mentioned dilution
factor is similar to that of the value of the control sample. Therefore from this it can be
concluded that the nature of the ELISA technique is both specific and sensitive since it is able to
detect the anti-BSA antibodies successfully. Maximum absorbance value for this assay was
detected at the lowest dilution factor which is 1/100 dilution factor. The absorbance value for this
dilution factor is 0.4 which 4 times higher than the control vale calculated in this experiment.
The absorbance value (0.2) in 1600 dilution factor maximum serum dilution which significantly
higher than the average control value. Therefore, the serum antibody titre for this experiment is
1600.Minor dip the curve was noticed for the dilution factor 6400 and 12800 but the absorbance
value is not significantly lower than the control value. Hence, it can be said that antibodies were
detected in this dilution factor and lower value might detected due to the experimental errors.
Paraphrase This Document
Need a fresh take? Get an instant paraphrase of this document with our AI Paraphraser

7ELISA LABORATORY REPORT
References
Aydin, S., 2015. A short history, principles, and types of ELISA, and our laboratory experience
with peptide/protein analyses using ELISA. Peptides, 72, pp.4-15.
Hornbeck, P.V., 2015. Enzyme‐linked immunosorbent assays. Current protocols in
immunology, 110(1), pp.2-1.
Thiha, A. and Ibrahim, F., 2015. A colorimetric enzyme-linked immunosorbent assay (ELISA)
detection platform for a point-of-care dengue detection system on a lab-on-compact-
disc. Sensors, 15(5), pp.11431-11441.

8ELISA LABORATORY REPORT
Appendix
Table 2: Raw data and detailed calculation of the investigation
Test Serum Control Serum
Absorbance at 405 nm Absorbance at 405 nm
Dilution
factor log 10(dilution factor) Column
A
Column
B
Mea
n
Dilution
factor log 10(dilution factor) Column
C
Column
D
Mea
n
100 2.00 0.411 0.394 0.40 50 1.70 0.103 0.094
0.01
200 2.30 0.421 0.353 0.39 50 1.70 0.108 0.1
400 2.60 0.382 0.279 0.33 50 1.70 0.101 0.104
800 2.90 0.29 0.26 0.28 50 1.70 0.097 0.102
1600 3.20 0.203 0.201 0.20 50 1.70 0.079 0.102
3200 3.51 0.101 0.107 0.10 50 1.70 0.101 0.101
6400 3.81 0.1 0.087 0.09 50 1.70 0.107 0.112
12800 4.11 0.071 0.092 0.08 50 1.70 0.107 0.106
25600 4.41 0.103 0.105 0.10 50 1.70 0.11 0.104
51200 4.71 0.111 0.107 0.11 50 1.70 0.102 0.088
102400 5.01 0.109 0.109 0.11 50 1.70 0.094 0.096
204800 5.31 0.108 0.107 0.11 50 1.70 0.101 0.103
Average
0.10083
3 0.101
1 out of 9
Related Documents

Your All-in-One AI-Powered Toolkit for Academic Success.
+13062052269
info@desklib.com
Available 24*7 on WhatsApp / Email
Unlock your academic potential
© 2024 | Zucol Services PVT LTD | All rights reserved.