ELISA Laboratory Report: Antibody Detection, Biology Report

Verified

Added on  2021/12/20

|9
|1432
|335
Report
AI Summary
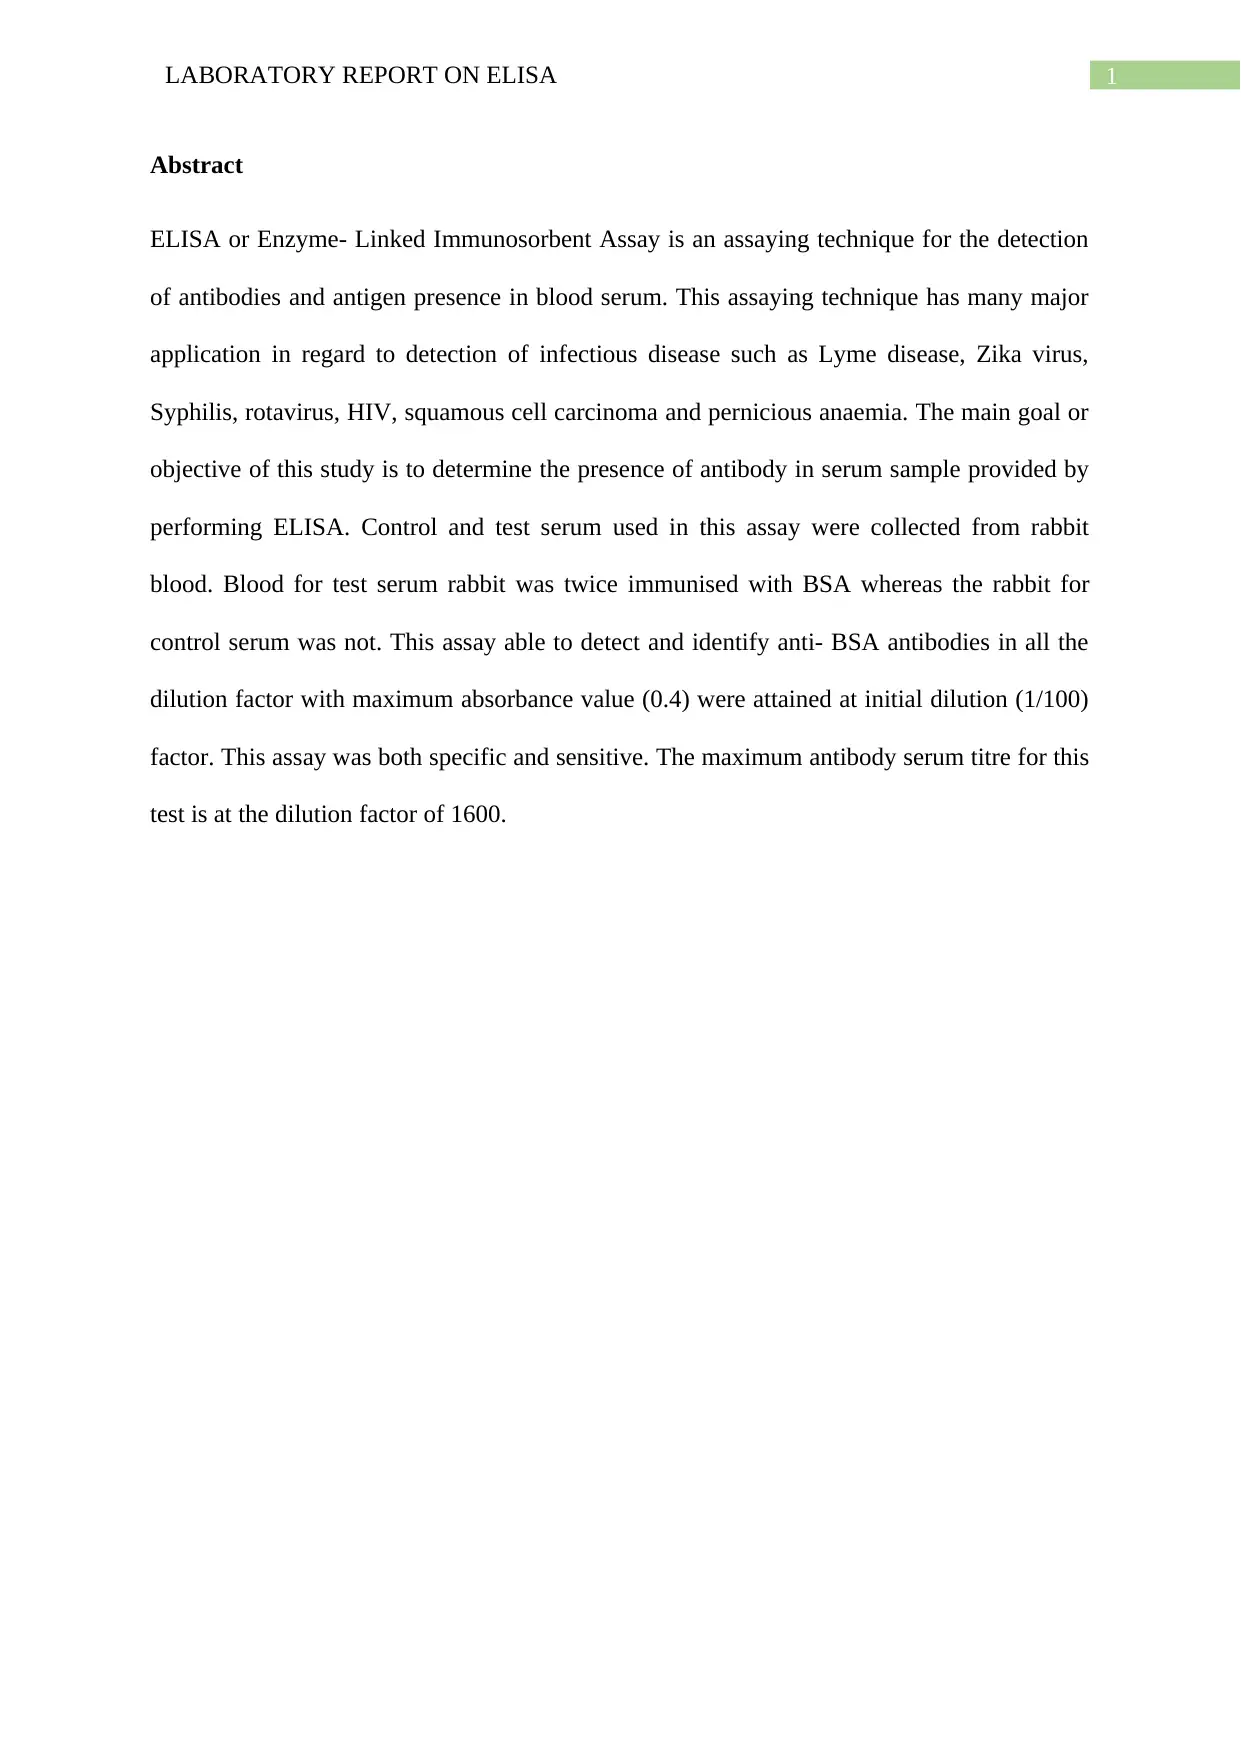
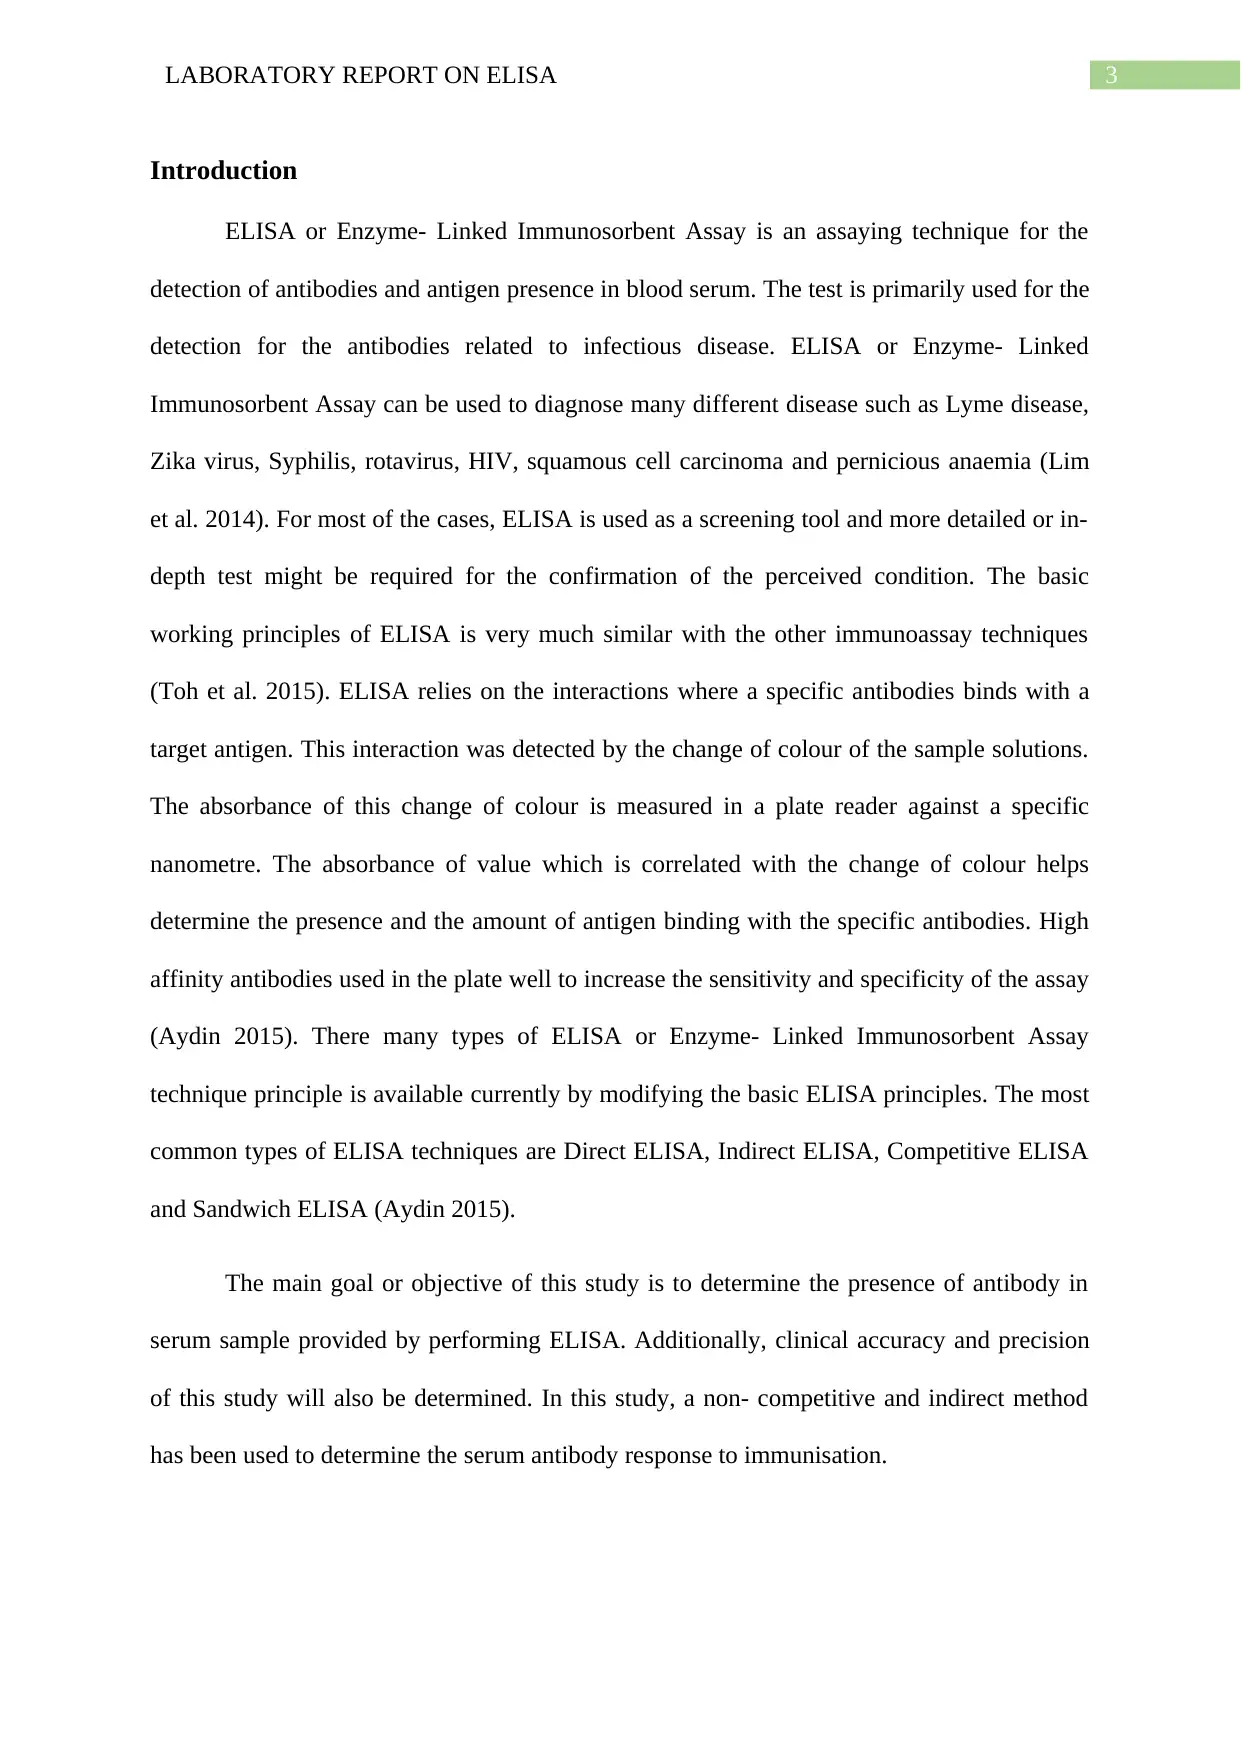
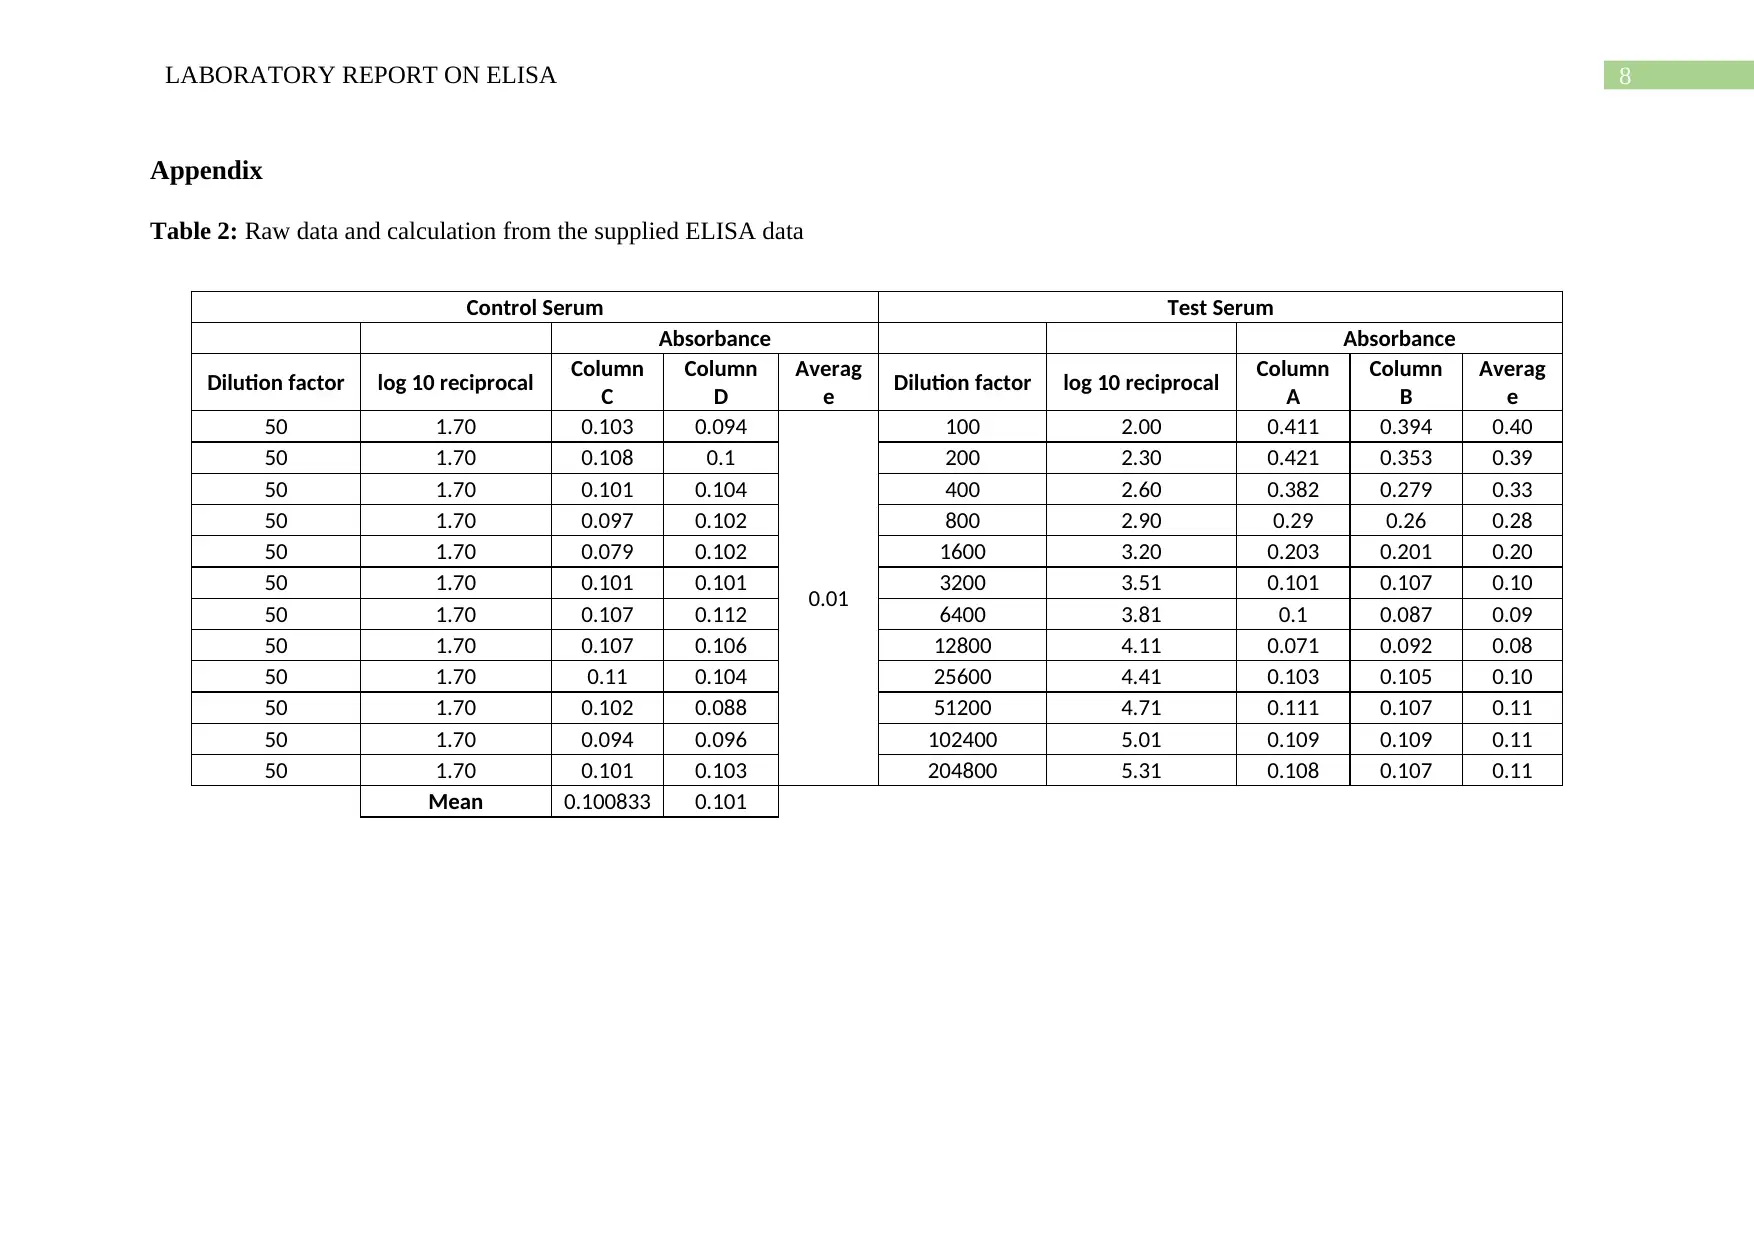
This laboratory report details an ELISA (Enzyme-Linked Immunosorbent Assay) experiment conducted to detect the presence of antibodies in serum samples. The study utilized serum from rabbits, with one sample immunized with BSA (Bovine Serum Albumin) and the other serving as a control. The report outlines the methodology, including the serial dilutions of the test serum and the measurement of absorbance at 450 nm. Results indicated successful detection of anti-BSA antibodies in the test serum across various dilution factors, with maximum absorbance observed at the initial dilution. The report includes a detailed analysis of the results, graphical representations, and a discussion of the specificity and sensitivity of the ELISA test. The study concluded that the ELISA test successfully identified anti-BSA antibodies and was both specific and sensitive, with the maximum antibody serum titre at a dilution factor of 1600. The report also includes raw data and calculations in the appendix.
Document Page
Running head: LABORATORY REPORT ON ELISA
Laboratory report on ELISA
Name of the Student
Name of the University
Author’s Note:
tabler-icon-diamond-filled.svg

Paraphrase This Document

Need a fresh take? Get an instant paraphrase of this document with our AI Paraphraser
Document Page
1LABORATORY REPORT ON ELISA
Abstract
ELISA or Enzyme- Linked Immunosorbent Assay is an assaying technique for the detection
of antibodies and antigen presence in blood serum. This assaying technique has many major
application in regard to detection of infectious disease such as Lyme disease, Zika virus,
Syphilis, rotavirus, HIV, squamous cell carcinoma and pernicious anaemia. The main goal or
objective of this study is to determine the presence of antibody in serum sample provided by
performing ELISA. Control and test serum used in this assay were collected from rabbit
blood. Blood for test serum rabbit was twice immunised with BSA whereas the rabbit for
control serum was not. This assay able to detect and identify anti- BSA antibodies in all the
dilution factor with maximum absorbance value (0.4) were attained at initial dilution (1/100)
factor. This assay was both specific and sensitive. The maximum antibody serum titre for this
test is at the dilution factor of 1600.
Document Page
2LABORATORY REPORT ON ELISA
Table of Contents
Introduction............................................................................................................................3
Results....................................................................................................................................4
Discussions.............................................................................................................................5
References..............................................................................................................................7
Appendix................................................................................................................................8
Document Page
3LABORATORY REPORT ON ELISA
Introduction
ELISA or Enzyme- Linked Immunosorbent Assay is an assaying technique for the
detection of antibodies and antigen presence in blood serum. The test is primarily used for the
detection for the antibodies related to infectious disease. ELISA or Enzyme- Linked
Immunosorbent Assay can be used to diagnose many different disease such as Lyme disease,
Zika virus, Syphilis, rotavirus, HIV, squamous cell carcinoma and pernicious anaemia (Lim
et al. 2014). For most of the cases, ELISA is used as a screening tool and more detailed or in-
depth test might be required for the confirmation of the perceived condition. The basic
working principles of ELISA is very much similar with the other immunoassay techniques
(Toh et al. 2015). ELISA relies on the interactions where a specific antibodies binds with a
target antigen. This interaction was detected by the change of colour of the sample solutions.
The absorbance of this change of colour is measured in a plate reader against a specific
nanometre. The absorbance of value which is correlated with the change of colour helps
determine the presence and the amount of antigen binding with the specific antibodies. High
affinity antibodies used in the plate well to increase the sensitivity and specificity of the assay
(Aydin 2015). There many types of ELISA or Enzyme- Linked Immunosorbent Assay
technique principle is available currently by modifying the basic ELISA principles. The most
common types of ELISA techniques are Direct ELISA, Indirect ELISA, Competitive ELISA
and Sandwich ELISA (Aydin 2015).
The main goal or objective of this study is to determine the presence of antibody in
serum sample provided by performing ELISA. Additionally, clinical accuracy and precision
of this study will also be determined. In this study, a non- competitive and indirect method
has been used to determine the serum antibody response to immunisation.
tabler-icon-diamond-filled.svg

Paraphrase This Document

Need a fresh take? Get an instant paraphrase of this document with our AI Paraphraser
Document Page
4LABORATORY REPORT ON ELISA
Results
To perform this study two serum samples were provided to perform the studies. One
of them was used for control and another for test sample. Serum of test sample was collected
from the rabbit blood immunised twice with BSA and serum for control was collected from
the blood of non- immunised rabbit. Control serum was applied in the 24 plate wells (Column
C and D) and test serum was applied in the other 24 wells (Column A and B). Control serums
were applied in the supplied 1/50 dilution factor and test serums were serially diluted from
the supplied dilution factor from 1/100 to 1/204800 dilution factor. Then the absorbance of
the change of colour were measured in a plate reader at 450 nm. As control serums were
supplied in same dilution factor in all the 24 plate wells, the mean value was calculated from
the 24 absorbance data. Dilution factor were converted into the Log 10 reciprocal and the
respective absorbance values were represented in the Table 1 for both control and test serum.
Table 1: Log 10 reciprocal value against absorbance for Control and Test serum
Control Serum Test Serum
Log 10 reciprocal Mean Absorbance Log 10 reciprocal Absorbance
1.7 0.1
2.00 0.40
2.30 0.39
2.60 0.33
2.90 0.28
3.20 0.20
3.51 0.10
3.81 0.09
4.11 0.08
4.41 0.10
4.71 0.11
5.01 0.11
5.31 0.11
From the Table 1, it can be seen that mean absorbance value for the control value at 1in 50
dilution factor is 0.1. Maximum absorbance for the test serum was noticed in the initial
Document Page
5LABORATORY REPORT ON ELISA
dilution which is 1 in 100 and values decreased gradually along the dilution. The data from
the Table 1 was plotted in a graph and result was presented in a Figure 1.
1.00 2.00 3.00 4.00 5.00 6.00 7.00 8.00
0.00
0.05
0.10
0.15
0.20
0.25
0.30
0.35
0.40
0.45
0.50
Absorbance (A405) plot against Serum dilution
Absorbance at 405 nm
Control Line
Log 10 reciprocal value
Absorbance value at 405 nm
Figure 1: Graph plot of Absorbance (A405) against Log 10 reciprocal value
Figure 1 represented the graphical representation of the data value gathered in the Table 1. A
control line have also been provided in the graph to show the control value against the test
sample.
Detailed calculation of the supplied raw data is provided in the Table 2 (See appendix).
Discussions
From the above data and graph it can be said that the test is able to specifically
identify the anti- BSA antibodies. The absorbance values are also significantly higher (twice
or higher than control value which is 0.1) than the control value for the dilution factor 100 to
Document Page
6LABORATORY REPORT ON ELISA
3200. Apart from that the test was able to identify the antibodies in all the dilution.
Furthermore, this test was able to identify anti-BSA antibodies in the very low dilution factor
of 204800. Not only that the absorbance values in this dilution factor is almost par with
absorbance value of the control serum. Hence, from the above discussion, it can be reasoned
that this ELISA test is both specific and sensitive to successfully detect the anti- BSA
antibodies. A minor anomaly in this experiment is that the absorbance value of test serum in
6400 and 12800 is lower compared to higher dilution factor. Although, the absorbance values
are not significantly lower, so it can be inferred that the anomaly happened due to
experimental or human error. The maximum antibody serum titre for this test is at the dilution
factor of 1600 as the absorbance value at this dilution is significantly higher than the average
control value.
tabler-icon-diamond-filled.svg

Paraphrase This Document

Need a fresh take? Get an instant paraphrase of this document with our AI Paraphraser
Document Page
7LABORATORY REPORT ON ELISA
References
Aydin, S., 2015. A short history, principles, and types of ELISA, and our laboratory
experience with peptide/protein analyses using ELISA. Peptides, 72, pp.4-15.
Lim, B.N., Tye, G.J., Choong, Y.S., Ong, E.B.B., Ismail, A. and Lim, T.S., 2014. Principles
and application of antibody libraries for infectious diseases. Biotechnology letters, 36(12),
pp.2381-2392.
Toh, S.Y., Citartan, M., Gopinath, S.C. and Tang, T.H., 2015. Aptamers as a replacement for
antibodies in enzyme-linked immunosorbent assay. Biosensors and bioelectronics, 64,
pp.392-403.
Document Page
8LABORATORY REPORT ON ELISA
Appendix
Table 2: Raw data and calculation from the supplied ELISA data
Control Serum Test Serum
Absorbance Absorbance
Dilution factor log 10 reciprocal Column
C
Column
D
Averag
e Dilution factor log 10 reciprocal Column
A
Column
B
Averag
e
50 1.70 0.103 0.094
0.01
100 2.00 0.411 0.394 0.40
50 1.70 0.108 0.1 200 2.30 0.421 0.353 0.39
50 1.70 0.101 0.104 400 2.60 0.382 0.279 0.33
50 1.70 0.097 0.102 800 2.90 0.29 0.26 0.28
50 1.70 0.079 0.102 1600 3.20 0.203 0.201 0.20
50 1.70 0.101 0.101 3200 3.51 0.101 0.107 0.10
50 1.70 0.107 0.112 6400 3.81 0.1 0.087 0.09
50 1.70 0.107 0.106 12800 4.11 0.071 0.092 0.08
50 1.70 0.11 0.104 25600 4.41 0.103 0.105 0.10
50 1.70 0.102 0.088 51200 4.71 0.111 0.107 0.11
50 1.70 0.094 0.096 102400 5.01 0.109 0.109 0.11
50 1.70 0.101 0.103 204800 5.31 0.108 0.107 0.11
Mean 0.100833 0.101
chevron_up_icon
1 out of 9
circle_padding
hide_on_mobile
zoom_out_icon
[object Object]