Financial Decision-Making: Elton Plc's Performance Analysis Report
VerifiedAdded on 2020/01/15
|21
|5668
|262
Report
AI Summary
This report provides a comprehensive financial analysis of Elton Plc, focusing on its performance in 2015 and comparing it to the previous year. The analysis includes an examination of the company's income statement, balance sheet, and cash flow statement. Key areas of focus include profitability ratios (Gross Profit Ratio, Operating Profit Ratio, Net Profit Ratio, and Times Interest Ratio), liquidity ratios (Current Ratio and Quick Ratio), and solvency ratios (Debt Equity Ratio). The report also assesses the company's investment appraisal for its expansion strategy, utilizing techniques like Payback Period, Accounting Rate of Return, and Net Present Value. Furthermore, the report discusses the limitations of financial statements, analyzes non-financial factors, and explores sources of internal finance. The financial statements reveal that Elton Plc experienced significant revenue growth, particularly from new product lines, but also faced challenges such as decreased liquidity and increased debt. The investment appraisal techniques suggest the expansion project is profitable, offering valuable insights into the company's financial health and strategic decisions.

Financial decision-making
Paraphrase This Document
Need a fresh take? Get an instant paraphrase of this document with our AI Paraphraser
Executive summary
Every organisation need to have some finanacial information about it which would aid
in taking long term decisions. These decisions being irreversible have to be made after due
analysis of its financial statements. The analysis part involves a deep study of the
organisation's balance sheet, income statements and cash flow statement to evaluate its
current position. In this project Elton Plc has planned an expansion strategy in which it will
be setting up its market in Africa, Asia, Middle East and South America. For this reason, it
will be needing funds but prior to that it wants to assess the current financial position i.e. of
2015 and compare it with the previous year as in how much increase in sales has been
recorded. The results show that the year 2015 has been a profitable year for the company.
Also, various ratios have been calculated to know about its liquidity and solvency positions.
The company's overall financial performance has improved in about all the aspects. Apart
from all this, the new project in which the company wants to invest has been appraised using
techniques like: Payback Period, Accounting Rate of Return and Net Present Value and the
values show that the company should undertake the project as it is a profitable venture.
Table of Contents
PART 1 BUSINESS PERORMANCE ANALYSIS..................................................................4
Interpretation of Profit and Loss.......................................................................................4
Statement of Financial Position .......................................................................................5
Statement of Cash Flows..................................................................................................6
Limitations of Financial Statements ................................................................................9
Part 2 .........................................................................................................................................9
Investment Appraisal........................................................................................................9
Non-Financial Factors.....................................................................................................12
Sources of Internal Finance............................................................................................13
REFERENCES.........................................................................................................................15
APPENDIX..............................................................................................................................17
⊘ This is a preview!⊘
Do you want full access?
Subscribe today to unlock all pages.
Trusted by 1+ million students worldwide
PART 1 BUSINESS PERORMANCE ANALYSIS
Interpretation of Profit and Loss
The Profit and Loss Statement which is also known as Income Statement shows profit figures
when the income earned is in excess of the expenses incurred. The profit amount is used in
calculating various Profitability Ratios which help in comparing current year's performance
with that of previous year (Zimmermann, 2012). from year 2014 to 2015
It is evident from the income statement of Elton Plc that it has successfully met the phase one
expansion strategy earning revenue of £2630m in 2015 thereby showing an increase in
amount which is approximately twice the profit earned in previous year i.e. 2014. The sale of
newly introduced products laptop and wearable technology alone has been able to generate
revenue of £419m for the year 2015 contributing to around 15.9% of the entire revenue.
The Gross Profit Ratio provides information regarding the profit earned from sales of
company's products. The said ratio of Elton has fallen down from 25.57 to 21.75 in
the year 2015. Although the profit has increased over a period of one year but the
proportionate increase in sales is 30.06% which is less than the increment in cost of
sales i.e. 36.74%. So in order to increase the ratio the cost of sales associated with the
sale of laptop and wearable technology need to be reduced which are newly brought
to the market.
The Operating Profit Ratio refers to that percentage of revenues which are made up of
operating income. The ratio of Elton for the year 2015 has come out to be 9.70 which
is higher than previous year i.e. 7.40. An increase in ratio is due to two reasons : the
extra gross profit of £55m earned in 2015 due to sale of newly introduced products in
African, Asian, Middle Eastern and South American markets plus an operating
income of £80 which is negligible for the year 2014. So, the increase in operating
income from 0 to £80m has been a huge factor in increasing the ratio.
The Net Profit Ratio is of utmost importance to the company. It measures the overall
profitability. A higher ratio indicates that the affairs of business are very well
managed. The ratio of Elton for the year 2015 is 6.08 which is more than 4.06
pertaining to year 2014. Higher ratio indicates that more profits have been earned by
the company i.e. £162m for the year 2015 and £82m for 2014 which is clearly on
account of increased sales. Expanding the business to new markets have contributed
to increase in revenues which is around 15.9% of the total revenues earned.
Paraphrase This Document
Need a fresh take? Get an instant paraphrase of this document with our AI Paraphraser
The Times Interest Ratio defines the firm's ability to meet the interest expenses with
its income or profits. The said ratio of Elton for the year 2015 is 6.04 which is less
than 13.67, the ratio pertaining to year 2014. The reason behind fall in ratio is due to
high interest expenses in year 2015 amounting to £25 which is more than that of 2014
i.e. £6m. An increase in interest expenses may be due to additional borrowings or
higher interest rate. From the figures shown in financial statements, the borrowings
have increased from £100m to £150m.
So as per the phase one expansion strategy of Elton it has been able to market its new
products very well. The sale of hybrid product and wearable technology has been able to
contribute to a sales of around £419 which has eventually helped it improve its market share
and its financial position by earning more profits.
Statement of Financial Position
For understanding the financial position of any organisation, various ratios need to be
calculated. Actual ratio calculations are then compared with the ideal ratios which helps in
evaluating the organisation's ability to meet its financial requirements (Aspara, Chakravarti
and Hoffmann, 2015).
To understand the financial position of Elton Plc some ratios have been calculated.
Liquidity Ratios are calculated for getting the estimate figures regarding its ability to meet
short term financial obligations. It is mostly used to compare the liquidity position of present
year with that of previous year (Doumpos, Zopounidis and Pardalos, 2010).
Current Ratio gives us an idea about firm's ability to pay back all its liabilities with its assets.
The ideal current ratio is considered to be 2:1. For the year 2015, current ratio of Elton Plc is
calculated to be 2.50 which is a good ratio figure as compared to previous year i.e. 3.67. The
ratio has moved closer to the ideal state than before and this improvement indicates increase
in assets value from £507m to £758m which shows an increase of about 49.50% from year
2014 to 2015. The increased figure is on account of inventory, trade and other recievables
which have also increased by 141.67% and 84.98% respectively. But the cash position has
fallen down from £134m in 2014 to 0 in 2015 which may pose a threat to company in
meeting its daily costs.
Quick Ratio which is also known as liquidity ratio or acid test ratio. How easily assets
can be converted into cash defines its liquidity. So, Elton's liquidity ratio would help
in knowing about its ability to meet short term financial requirements as and when
the need arises. The ideal quick ratio is considered to be 1:1. For the year 2015, the
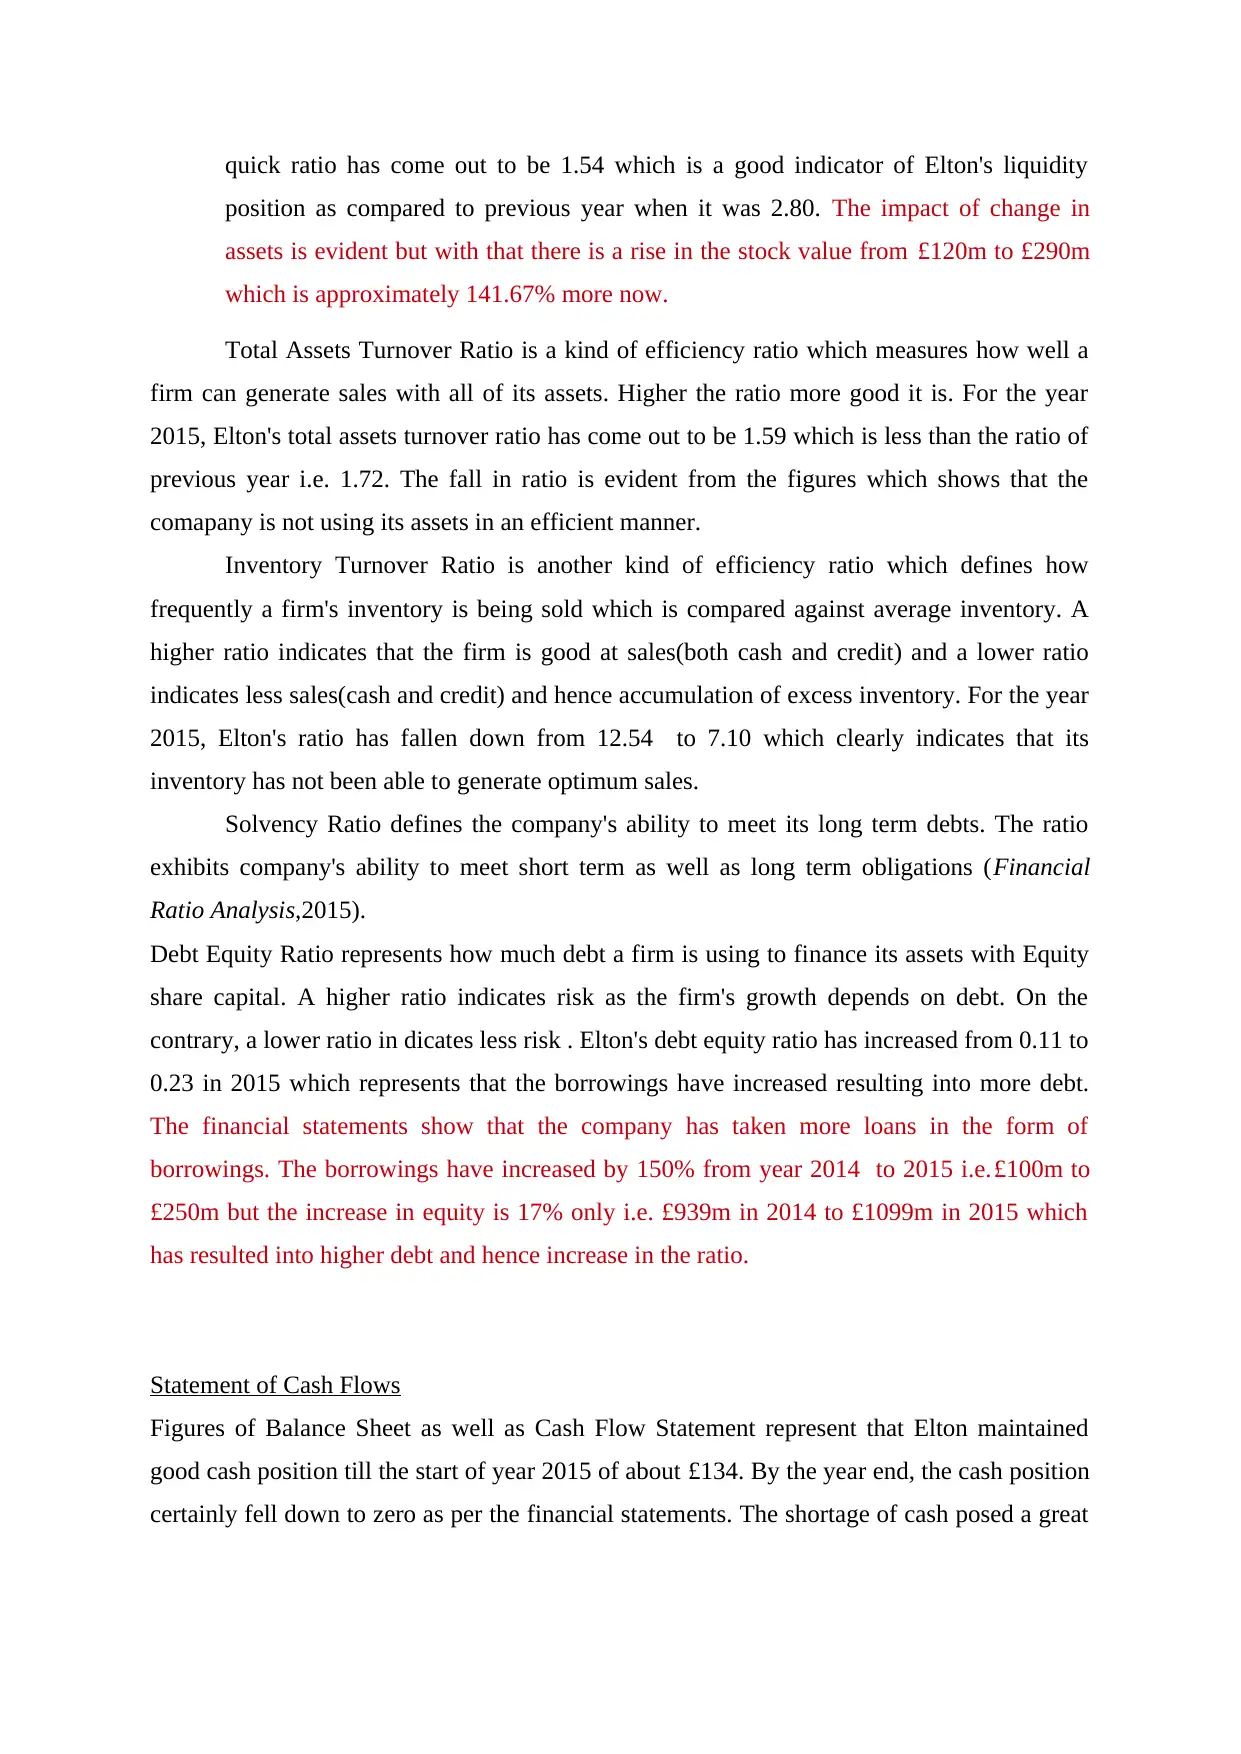
quick ratio has come out to be 1.54 which is a good indicator of Elton's liquidity
position as compared to previous year when it was 2.80. The impact of change in
assets is evident but with that there is a rise in the stock value from £120m to £290m
which is approximately 141.67% more now.
Total Assets Turnover Ratio is a kind of efficiency ratio which measures how well a
firm can generate sales with all of its assets. Higher the ratio more good it is. For the year
2015, Elton's total assets turnover ratio has come out to be 1.59 which is less than the ratio of
previous year i.e. 1.72. The fall in ratio is evident from the figures which shows that the
comapany is not using its assets in an efficient manner.
Inventory Turnover Ratio is another kind of efficiency ratio which defines how
frequently a firm's inventory is being sold which is compared against average inventory. A
higher ratio indicates that the firm is good at sales(both cash and credit) and a lower ratio
indicates less sales(cash and credit) and hence accumulation of excess inventory. For the year
2015, Elton's ratio has fallen down from 12.54 to 7.10 which clearly indicates that its
inventory has not been able to generate optimum sales.
Solvency Ratio defines the company's ability to meet its long term debts. The ratio
exhibits company's ability to meet short term as well as long term obligations (Financial
Ratio Analysis,2015).
Debt Equity Ratio represents how much debt a firm is using to finance its assets with Equity
share capital. A higher ratio indicates risk as the firm's growth depends on debt. On the
contrary, a lower ratio in dicates less risk . Elton's debt equity ratio has increased from 0.11 to
0.23 in 2015 which represents that the borrowings have increased resulting into more debt.
The financial statements show that the company has taken more loans in the form of
borrowings. The borrowings have increased by 150% from year 2014 to 2015 i.e.£100m to
£250m but the increase in equity is 17% only i.e. £939m in 2014 to £1099m in 2015 which
has resulted into higher debt and hence increase in the ratio.
Statement of Cash Flows
Figures of Balance Sheet as well as Cash Flow Statement represent that Elton maintained
good cash position till the start of year 2015 of about £134. By the year end, the cash position
certainly fell down to zero as per the financial statements. The shortage of cash posed a great
⊘ This is a preview!⊘
Do you want full access?
Subscribe today to unlock all pages.
Trusted by 1+ million students worldwide
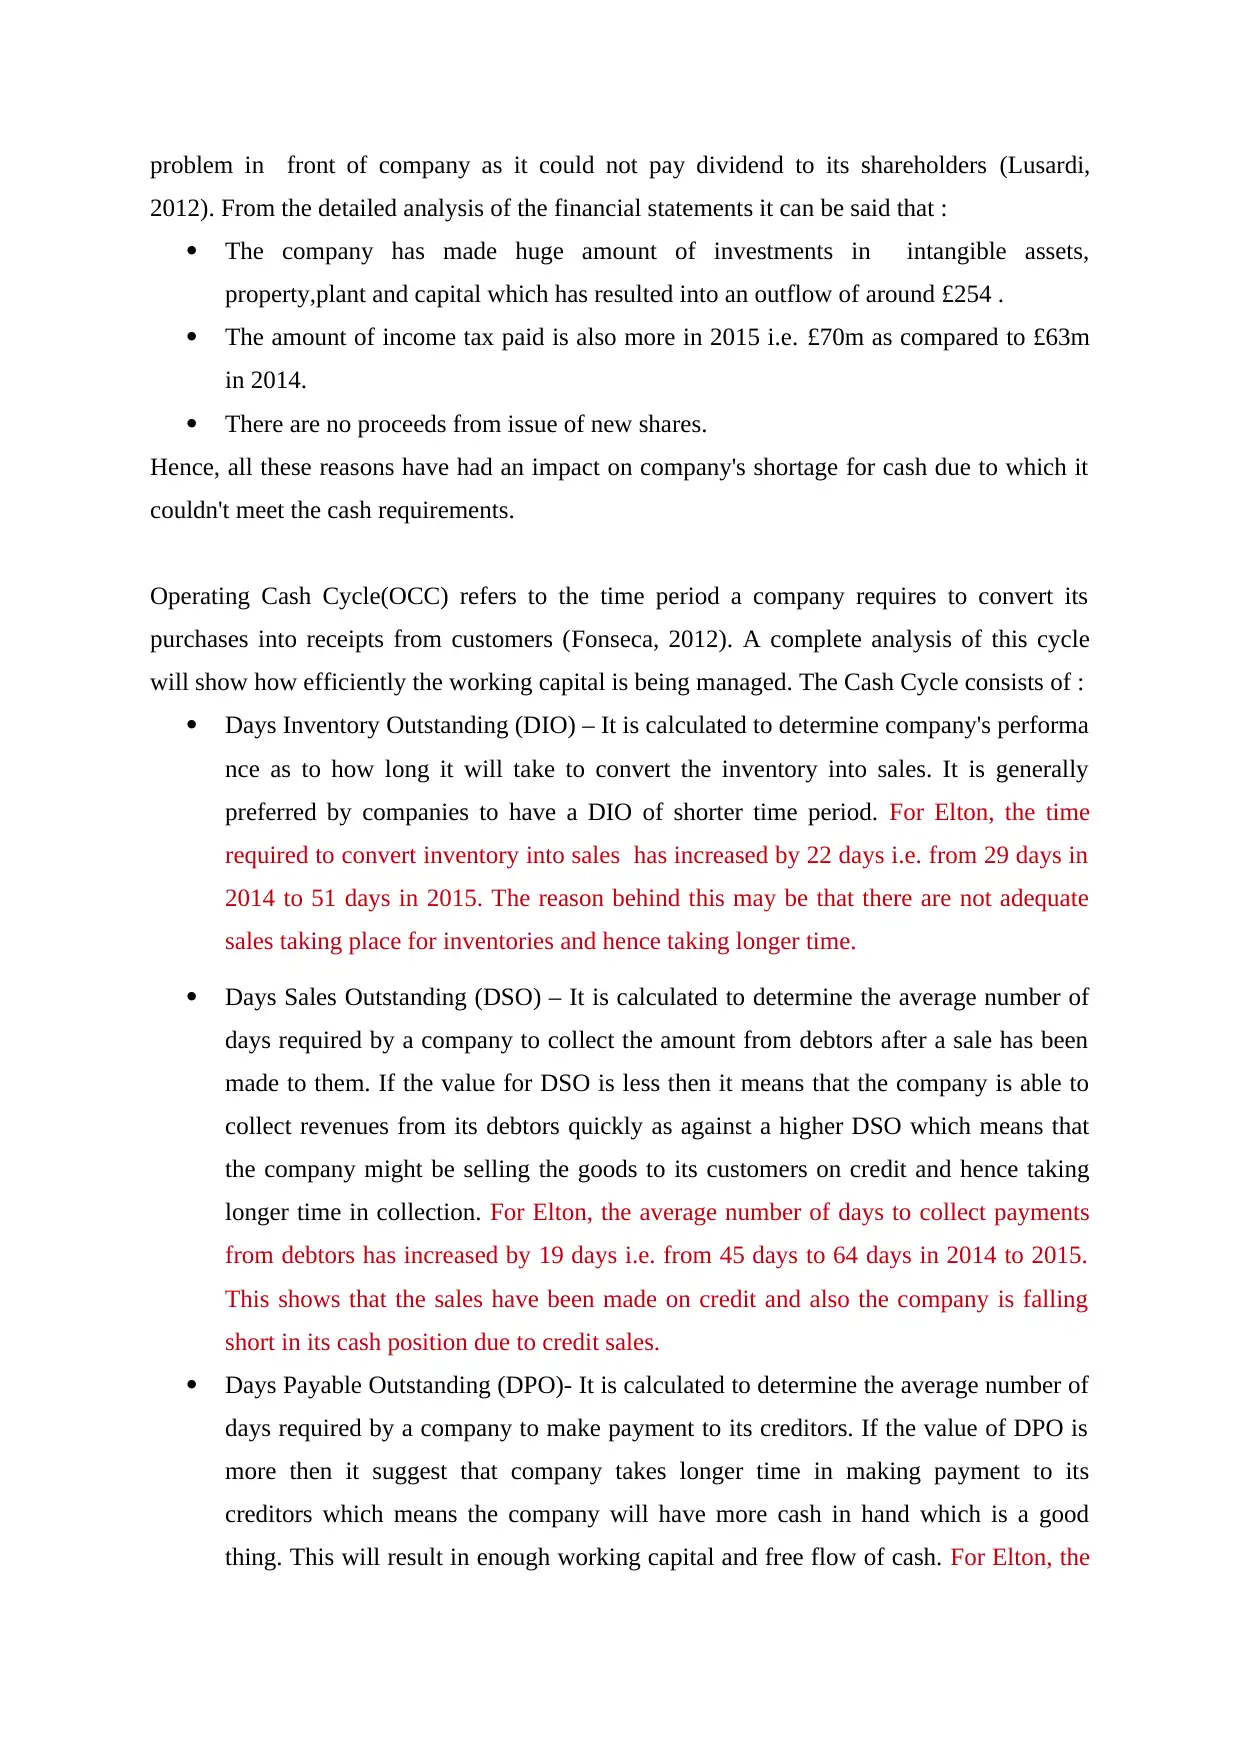
problem in front of company as it could not pay dividend to its shareholders (Lusardi,
2012). From the detailed analysis of the financial statements it can be said that :
The company has made huge amount of investments in intangible assets,
property,plant and capital which has resulted into an outflow of around £254 .
The amount of income tax paid is also more in 2015 i.e. £70m as compared to £63m
in 2014.
There are no proceeds from issue of new shares.
Hence, all these reasons have had an impact on company's shortage for cash due to which it
couldn't meet the cash requirements.
Operating Cash Cycle(OCC) refers to the time period a company requires to convert its
purchases into receipts from customers (Fonseca, 2012). A complete analysis of this cycle
will show how efficiently the working capital is being managed. The Cash Cycle consists of :
Days Inventory Outstanding (DIO) – It is calculated to determine company's performa
nce as to how long it will take to convert the inventory into sales. It is generally
preferred by companies to have a DIO of shorter time period. For Elton, the time
required to convert inventory into sales has increased by 22 days i.e. from 29 days in
2014 to 51 days in 2015. The reason behind this may be that there are not adequate
sales taking place for inventories and hence taking longer time.
Days Sales Outstanding (DSO) – It is calculated to determine the average number of
days required by a company to collect the amount from debtors after a sale has been
made to them. If the value for DSO is less then it means that the company is able to
collect revenues from its debtors quickly as against a higher DSO which means that
the company might be selling the goods to its customers on credit and hence taking
longer time in collection. For Elton, the average number of days to collect payments
from debtors has increased by 19 days i.e. from 45 days to 64 days in 2014 to 2015.
This shows that the sales have been made on credit and also the company is falling
short in its cash position due to credit sales.
Days Payable Outstanding (DPO)- It is calculated to determine the average number of
days required by a company to make payment to its creditors. If the value of DPO is
more then it suggest that company takes longer time in making payment to its
creditors which means the company will have more cash in hand which is a good
thing. This will result in enough working capital and free flow of cash. For Elton, the
Paraphrase This Document
Need a fresh take? Get an instant paraphrase of this document with our AI Paraphraser
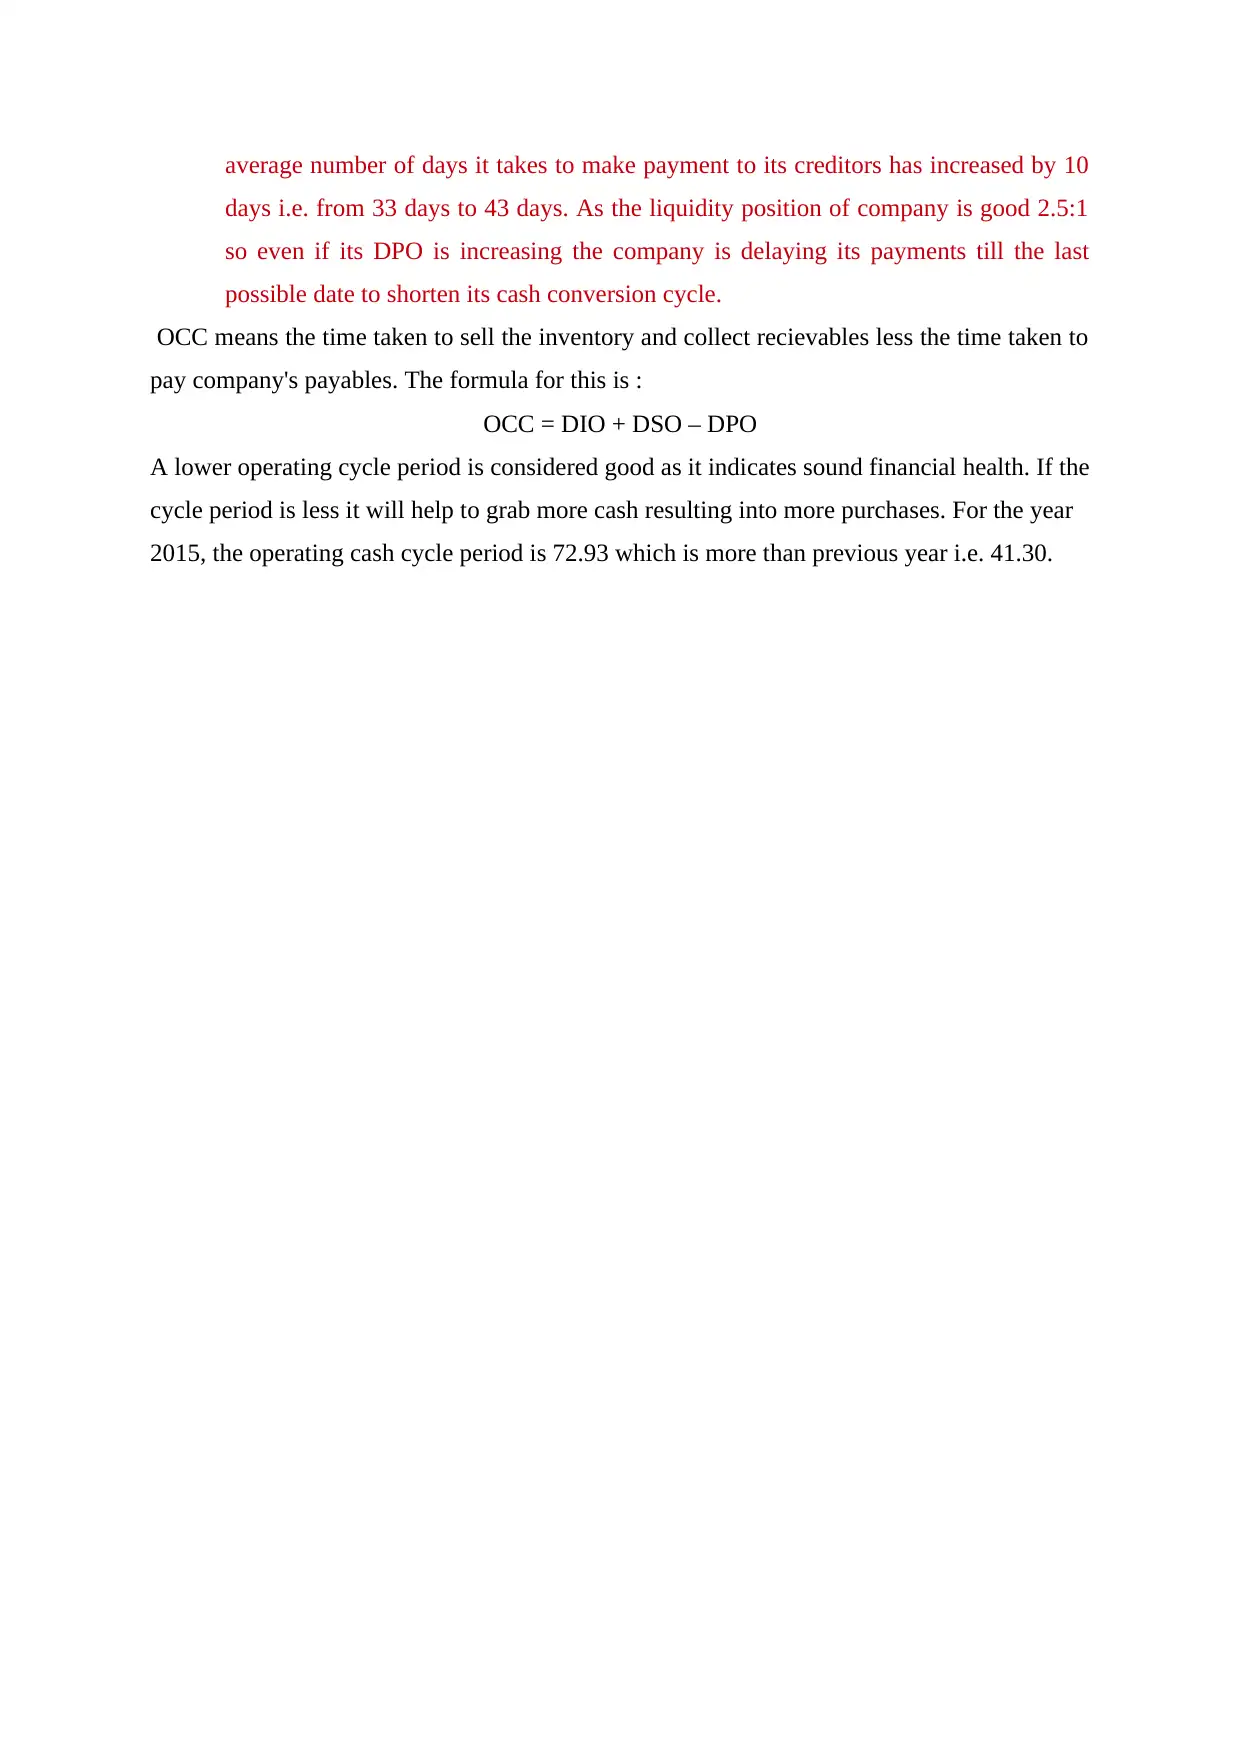
average number of days it takes to make payment to its creditors has increased by 10
days i.e. from 33 days to 43 days. As the liquidity position of company is good 2.5:1
so even if its DPO is increasing the company is delaying its payments till the last
possible date to shorten its cash conversion cycle.
OCC means the time taken to sell the inventory and collect recievables less the time taken to
pay company's payables. The formula for this is :
OCC = DIO + DSO – DPO
A lower operating cycle period is considered good as it indicates sound financial health. If the
cycle period is less it will help to grab more cash resulting into more purchases. For the year
2015, the operating cash cycle period is 72.93 which is more than previous year i.e. 41.30.
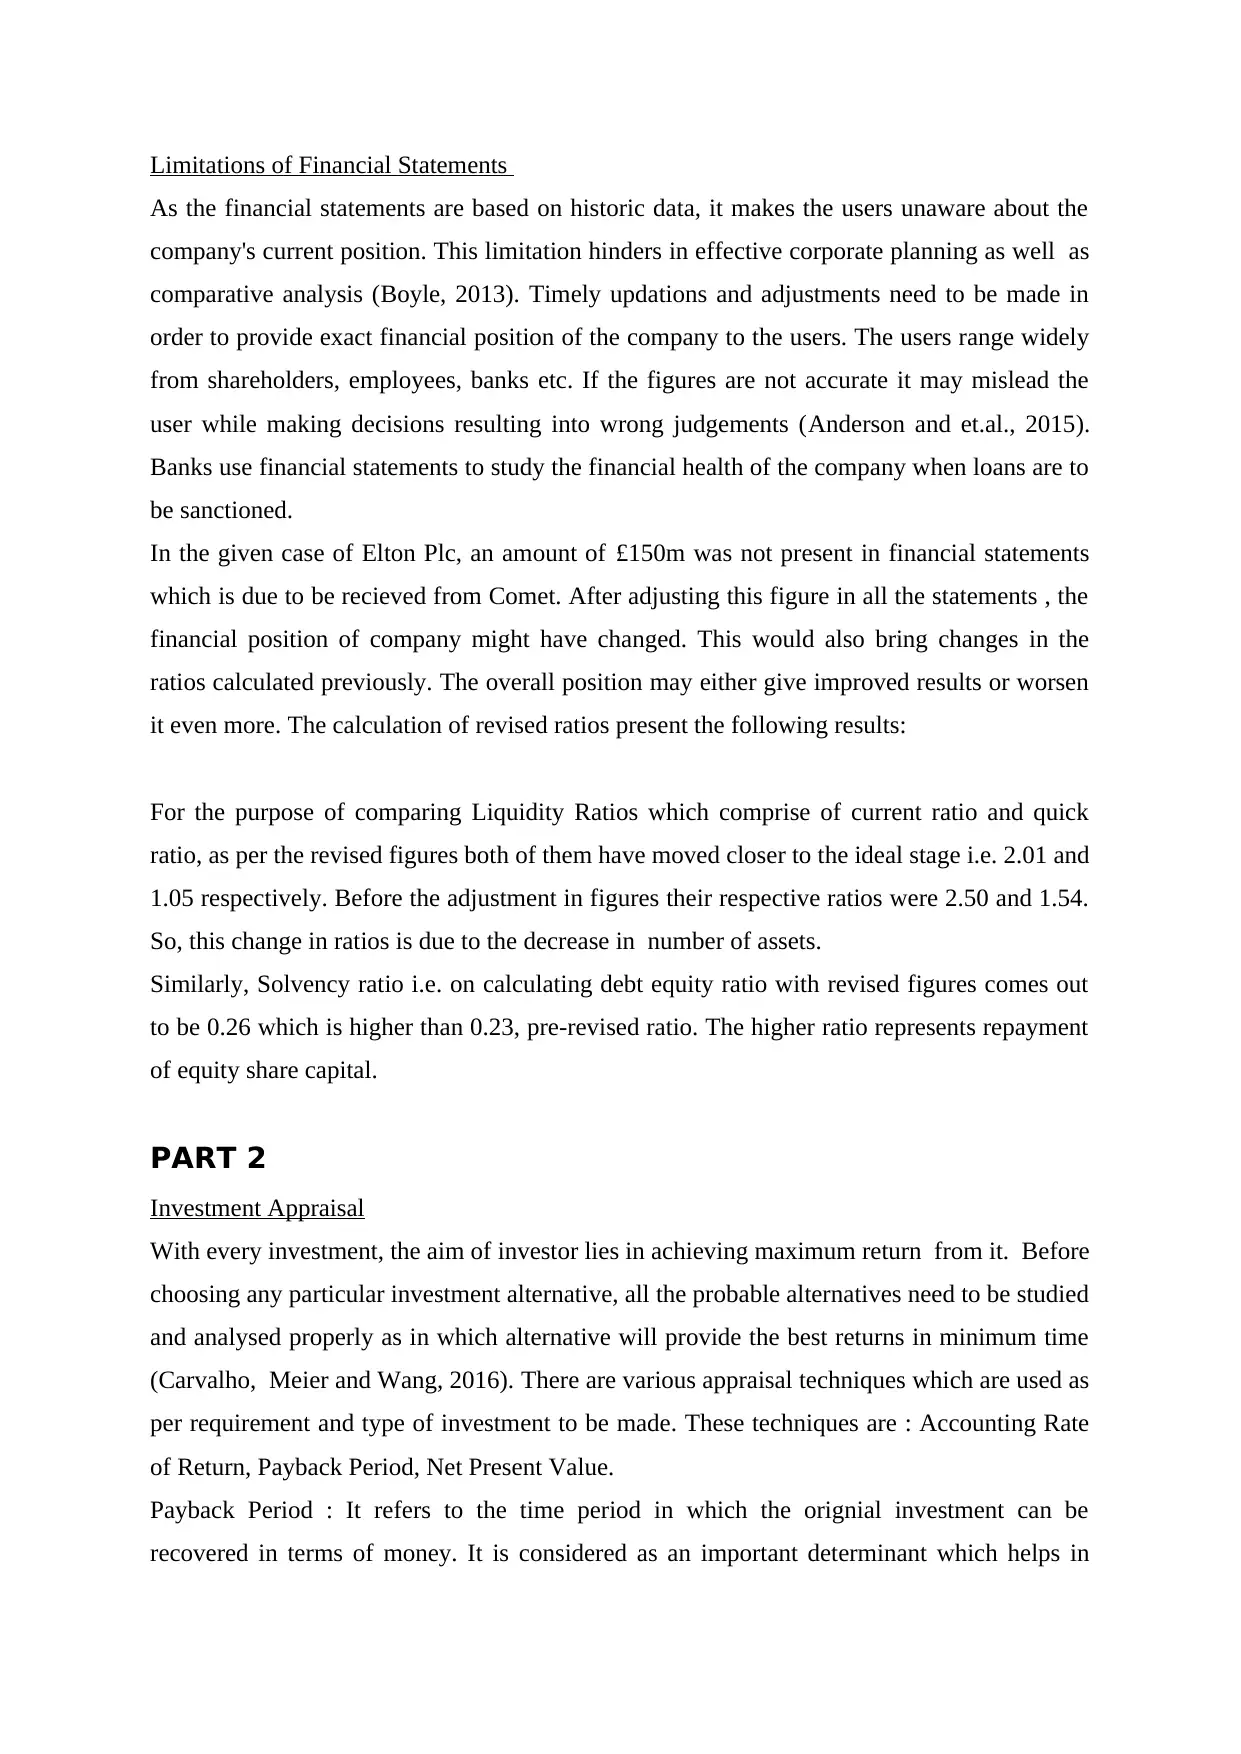
Limitations of Financial Statements
As the financial statements are based on historic data, it makes the users unaware about the
company's current position. This limitation hinders in effective corporate planning as well as
comparative analysis (Boyle, 2013). Timely updations and adjustments need to be made in
order to provide exact financial position of the company to the users. The users range widely
from shareholders, employees, banks etc. If the figures are not accurate it may mislead the
user while making decisions resulting into wrong judgements (Anderson and et.al., 2015).
Banks use financial statements to study the financial health of the company when loans are to
be sanctioned.
In the given case of Elton Plc, an amount of £150m was not present in financial statements
which is due to be recieved from Comet. After adjusting this figure in all the statements , the
financial position of company might have changed. This would also bring changes in the
ratios calculated previously. The overall position may either give improved results or worsen
it even more. The calculation of revised ratios present the following results:
For the purpose of comparing Liquidity Ratios which comprise of current ratio and quick
ratio, as per the revised figures both of them have moved closer to the ideal stage i.e. 2.01 and
1.05 respectively. Before the adjustment in figures their respective ratios were 2.50 and 1.54.
So, this change in ratios is due to the decrease in number of assets.
Similarly, Solvency ratio i.e. on calculating debt equity ratio with revised figures comes out
to be 0.26 which is higher than 0.23, pre-revised ratio. The higher ratio represents repayment
of equity share capital.
PART 2
Investment Appraisal
With every investment, the aim of investor lies in achieving maximum return from it. Before
choosing any particular investment alternative, all the probable alternatives need to be studied
and analysed properly as in which alternative will provide the best returns in minimum time
(Carvalho, Meier and Wang, 2016). There are various appraisal techniques which are used as
per requirement and type of investment to be made. These techniques are : Accounting Rate
of Return, Payback Period, Net Present Value.
Payback Period : It refers to the time period in which the orignial investment can be
recovered in terms of money. It is considered as an important determinant which helps in
⊘ This is a preview!⊘
Do you want full access?
Subscribe today to unlock all pages.
Trusted by 1+ million students worldwide
deciding whether a particular investment should be made or not based on the number of
years it takes to pay back the invested amount. It is always preferred to select a project which
can repay the invested amount in a shorter time period (Xu, 2015).
Benefits of Using Payback Period as an Investment Appraisal Technique:
Its calculation is very simple and easy to understand.
It is considered as a valid way to determine the level of risk in an investment. It is
more often used for appraisal when there is liquidity issue associated with any project.
It deals with risk as in the project having lower payback period is considered to be
less risky.
It is the best method to be used for appraising projects involving small amount of
investments.
Disadvantages of using Payback Period Technique:
It lays more emphasis on liquidity and diregards profitability.
It does not consider the time value factor while doing computation.
Cash Flows after payback period are not taken into account.
From the given case of Elton Plc, the initial investment of company is £500m and the
calculation part shows that the investment amount can be recovered in a period of 4 years.
Although the useful life of project is 5 years and the investment recovery is made before 5
years but still the recovery period is longer. In such a situation it is advised not to rely fully
on this appraisal technique.
Accounting Rate of Return : It is the amount of return or profit which an investor expects on
the investment he has made. It can be calculated by dividing the average accounting profit by
the investment made. The formula can be written as
ARR=Average Accounting profit/ Average Investment
The term Accounting Rate of Return is also known as Simple Rate of Return.
A project is generally accepted if its accounting rate of return is equal to or greater than the
required rate of return i.e. ARR> Required Return. (Van den Bos, Homberg and de Visser,
2013).If there are two mutually exclusive projects, then the project with higher ARR is
selected as a profitable venture.
Benefits of using Accounting Rate of Return as an Investment Appraisal Technique:
The calculation process is easy and not a lengthy task.
Its computation depends on accounting profit which also gives an idea about how
much profitablity the investment has generated.
Paraphrase This Document
Need a fresh take? Get an instant paraphrase of this document with our AI Paraphraser
Disadvantages of using Accounting Rate of Return Technique:
It ignores the concept of time value of money.
It does not assess the terminal value of project.
It does not consider cash flow rather takes accounting income for the purpose of
calculation.
For the given case of Elton Plc, the total cash flows over the life of project is £724m with an
initial investment of £500m. The average annual profit of £44.8m and average asset value
£250m when mathematically put into formula, the accounting rate of return comes out to be
18% which is more than 10% , the required rate of return. So based on the results , the project
proposal can be accepted if we evaluate it solely from the ARR technique.
Net Present Value: It is one of the most commonly used appraisal techniques which is used
for appraisal of projects involving large amount of investment (Hall, 2013). It helps in
determining the probable return on investment from the proposed project alternatives
(Guastello, 2016).It is widely used to evaluate whether a particular project is actually worth
the investment required.
Mathematically, it is difference between present value of cash inflows and cash outflows.
When two or more project alternatives are compared, the one providing a positive value in
terms of money is chosen to be the best project proposal. If all the projects are resulting into
positive NPV then the project with higher NPV is ranked one. A value greater than zero
suggests that the project will be a profitable venture for the company (Levy, 2015). If a
project's NPV value is negative or less than zero then it is rejected meaning it would be a loss
for the company if it undertakes that project (Spann, 2009)..
Advantages of using Net Present Value as an Investment Appraisal Technique:
It considers the concept of time value of money for the purpose of calculation.
Project's risk as well as profitability both are considered as high priority factors.
For the purpose of computation, all the cash flows generated over the time span of
project are considered.
It helps in maximising the overall value of the firm.
Disadvantages of using Net Present Value :
It is not suitable to use when the amount of investment involved in two mutually
exclusive projects is unequal. There can a possibility of wrong decisions due to the
complexities in the analysis and computation part.
It may fail to provide required decision making figures when the projects are of
unequal life.
The calculation of discounting rate is a difficult task.
From the given case of Elton Plc, it had initially made an investment of £500m and on
discounting the cash flows of 5 years at the rate of 5%,the Net Present Value shows a positive
figure of £110 which means that the project can be accepted for the purpose of investment.
The positive NPV is an indication that the project will result into profits and it is beneficial to
invest money in it.
Non-Financial Factors
Generally investors are interested in determing the financial factors that can assist them in
decision making process as it involves amount in monetary terms which is of huge
importance to them (Patel, 2012).But there are some other factors also which need to be
considered while making investments. These form part of non-financial factors. An equal
weightage to non-financial factors is also essential for the purpose of decision making when
the investment amount is so large. As Elton Plc is planning to expand its business in some
other countries like Africa, Asia, Middle East and South America it need to study some
⊘ This is a preview!⊘
Do you want full access?
Subscribe today to unlock all pages.
Trusted by 1+ million students worldwide
1 out of 21
Related Documents


Your All-in-One AI-Powered Toolkit for Academic Success.
+13062052269
info@desklib.com
Available 24*7 on WhatsApp / Email
![[object Object]](/_next/static/media/star-bottom.7253800d.svg)
Unlock your academic potential
Copyright © 2020–2026 A2Z Services. All Rights Reserved. Developed and managed by ZUCOL.