Prince Sultan University EM 345 Supply Chain Engineering Project
VerifiedAdded on 2022/08/28
|12
|1714
|27
Project
AI Summary
This project is a comprehensive analysis of supply chain management, focusing on production planning and control. Part 1 explores aggregate planning strategies, including level and chase plans, considering workforce variations, inventory, and backorders. It involves detailed computations of production rates, workforce needs, and cost calculations for different scenarios. Part 2 delves into time series forecasting, using historical sales data to predict future sales through regression analysis. Part 3 provides a literature review on demand forecasting, covering various techniques and their evolution. Part 4 examines the history of supply chain engineering and its evolution. Part 5 analyzes price relationships and profit margins. Part 6 builds on the analysis of price and cost relationships. Part 7 applies the northwest corner rule for transportation cost optimization. The project provides a detailed analysis of supply chain management and optimization techniques.
Running head: Supply Chain Management Engineering Plan.
Supply chain management engineering
Students’ name
Institutional affiliation
Date
Supply chain management engineering
Students’ name
Institutional affiliation
Date
Paraphrase This Document
Need a fresh take? Get an instant paraphrase of this document with our AI Paraphraser
Supply chain management engineering plan 2
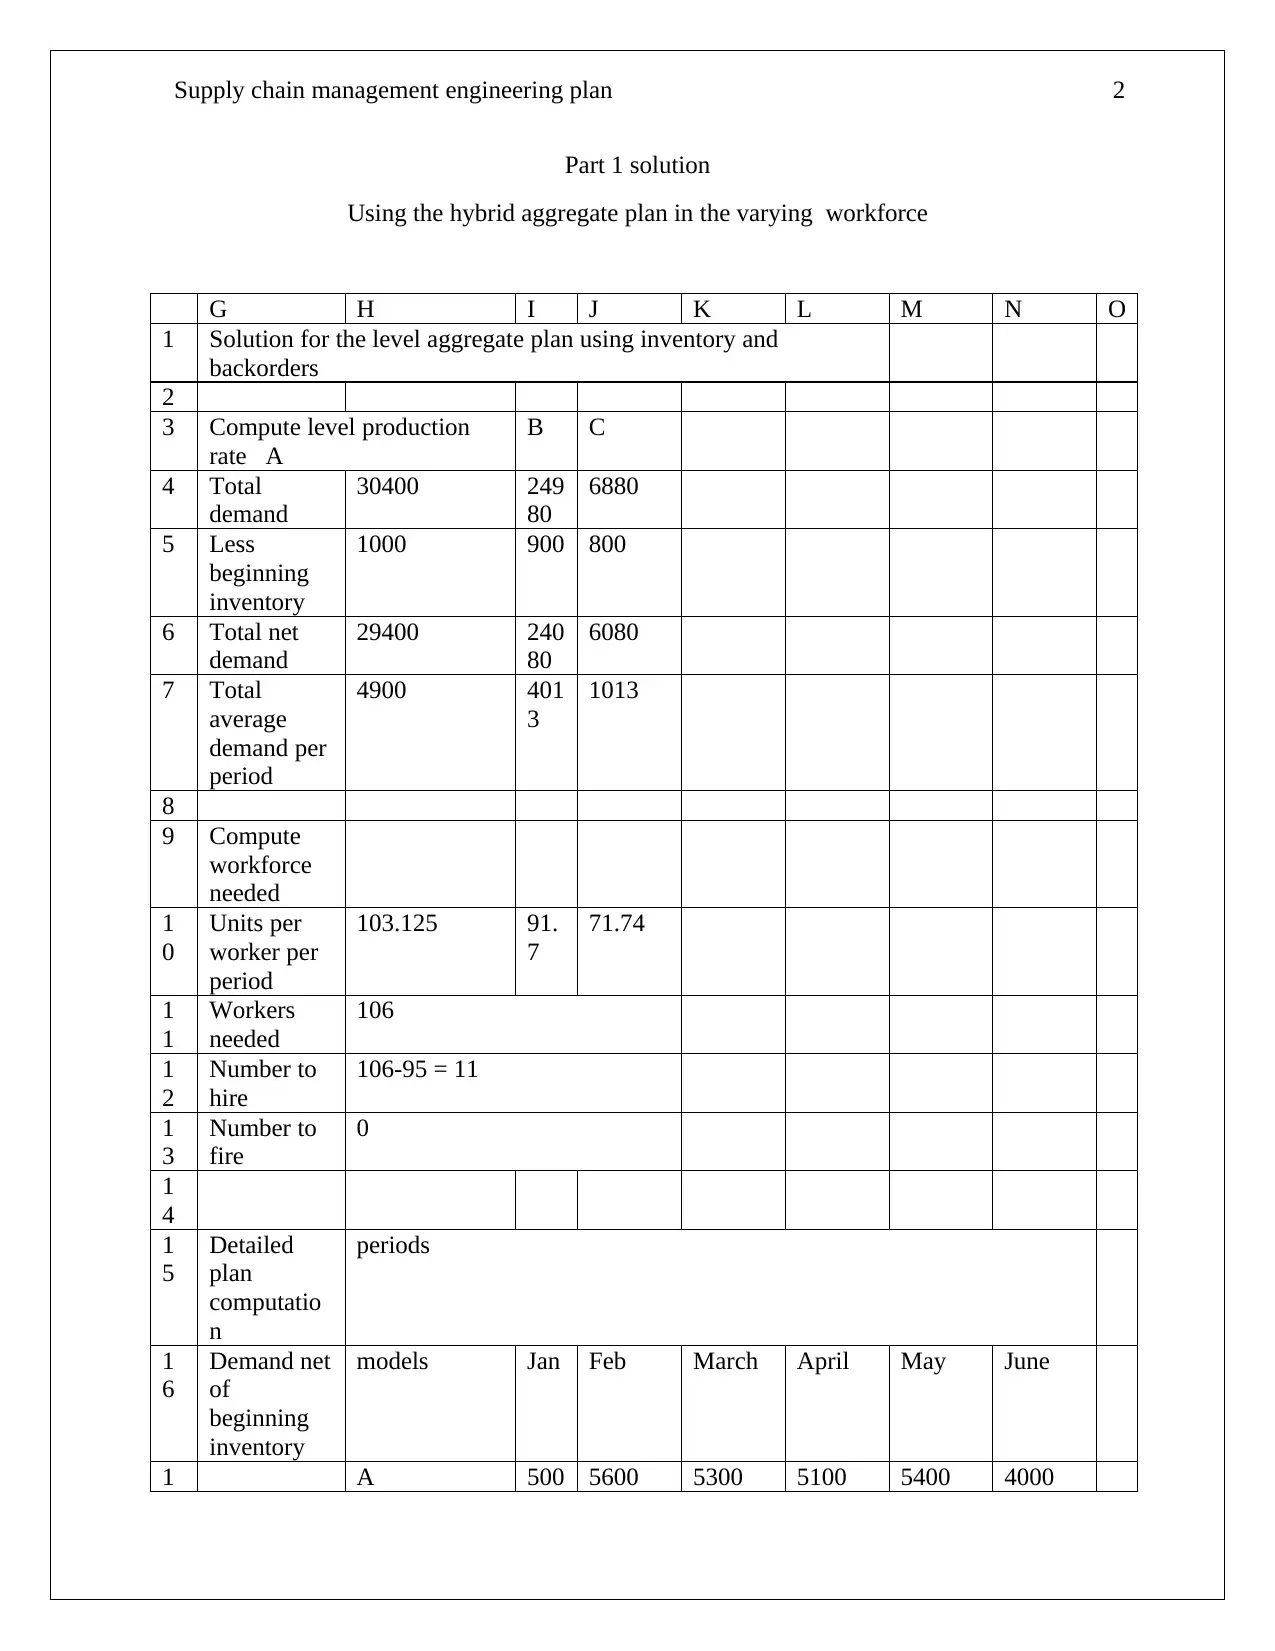
Part 1 solution
Using the hybrid aggregate plan in the varying workforce
G H I J K L M N O
1 Solution for the level aggregate plan using inventory and
backorders
2
3 Compute level production
rate A
B C
4 Total
demand
30400 249
80
6880
5 Less
beginning
inventory
1000 900 800
6 Total net
demand
29400 240
80
6080
7 Total
average
demand per
period
4900 401
3
1013
8
9 Compute
workforce
needed
1
0
Units per
worker per
period
103.125 91.
7
71.74
1
1
Workers
needed
106
1
2
Number to
hire
106-95 = 11
1
3
Number to
fire
0
1
4
1
5
Detailed
plan
computatio
n
periods
1
6
Demand net
of
beginning
inventory
models Jan Feb March April May June
1 A 500 5600 5300 5100 5400 4000
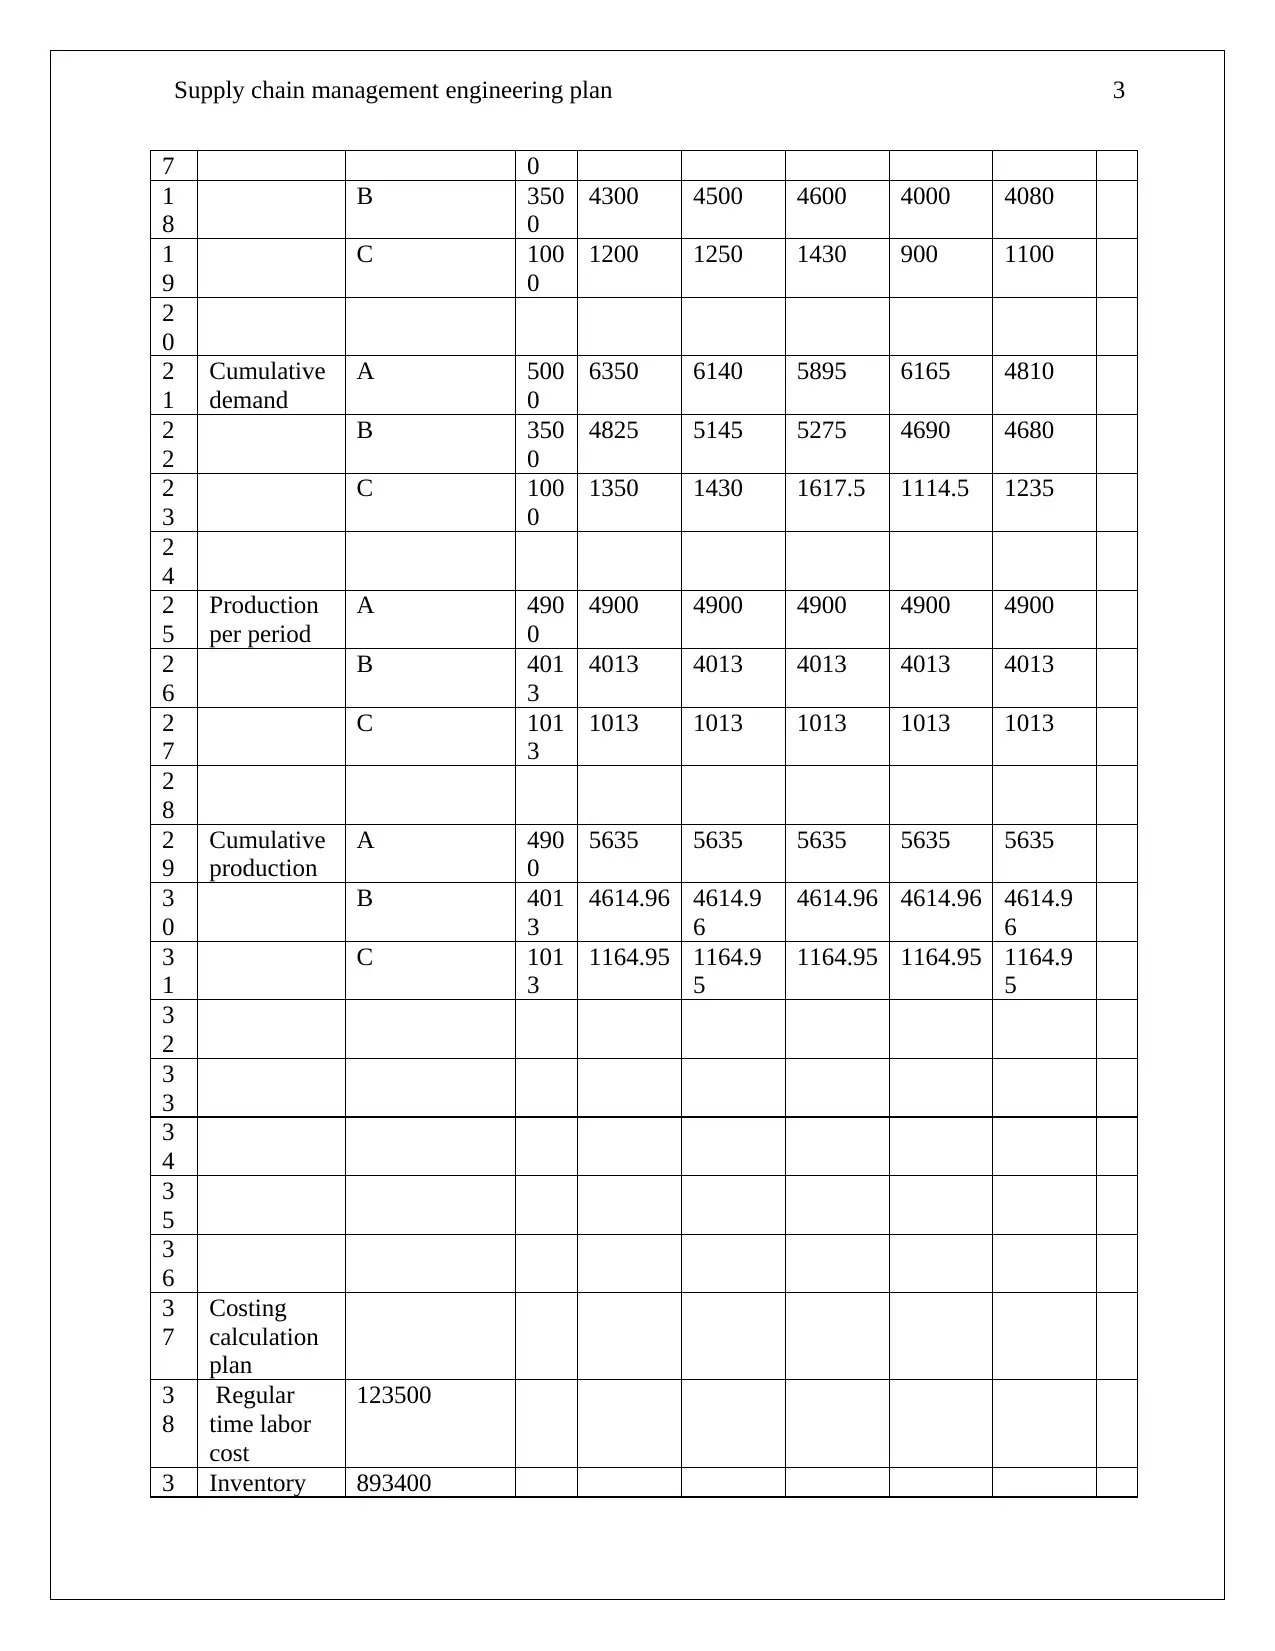
Supply chain management engineering plan 3
7 0
1
8
B 350
0
4300 4500 4600 4000 4080
1
9
C 100
0
1200 1250 1430 900 1100
2
0
2
1
Cumulative
demand
A 500
0
6350 6140 5895 6165 4810
2
2
B 350
0
4825 5145 5275 4690 4680
2
3
C 100
0
1350 1430 1617.5 1114.5 1235
2
4
2
5
Production
per period
A 490
0
4900 4900 4900 4900 4900
2
6
B 401
3
4013 4013 4013 4013 4013
2
7
C 101
3
1013 1013 1013 1013 1013
2
8
2
9
Cumulative
production
A 490
0
5635 5635 5635 5635 5635
3
0
B 401
3
4614.96 4614.9
6
4614.96 4614.96 4614.9
6
3
1
C 101
3
1164.95 1164.9
5
1164.95 1164.95 1164.9
5
3
2
3
3
3
4
3
5
3
6
3
7
Costing
calculation
plan
3
8
Regular
time labor
cost
123500
3 Inventory 893400
⊘ This is a preview!⊘
Do you want full access?
Subscribe today to unlock all pages.
Trusted by 1+ million students worldwide
Supply chain management engineering plan 4
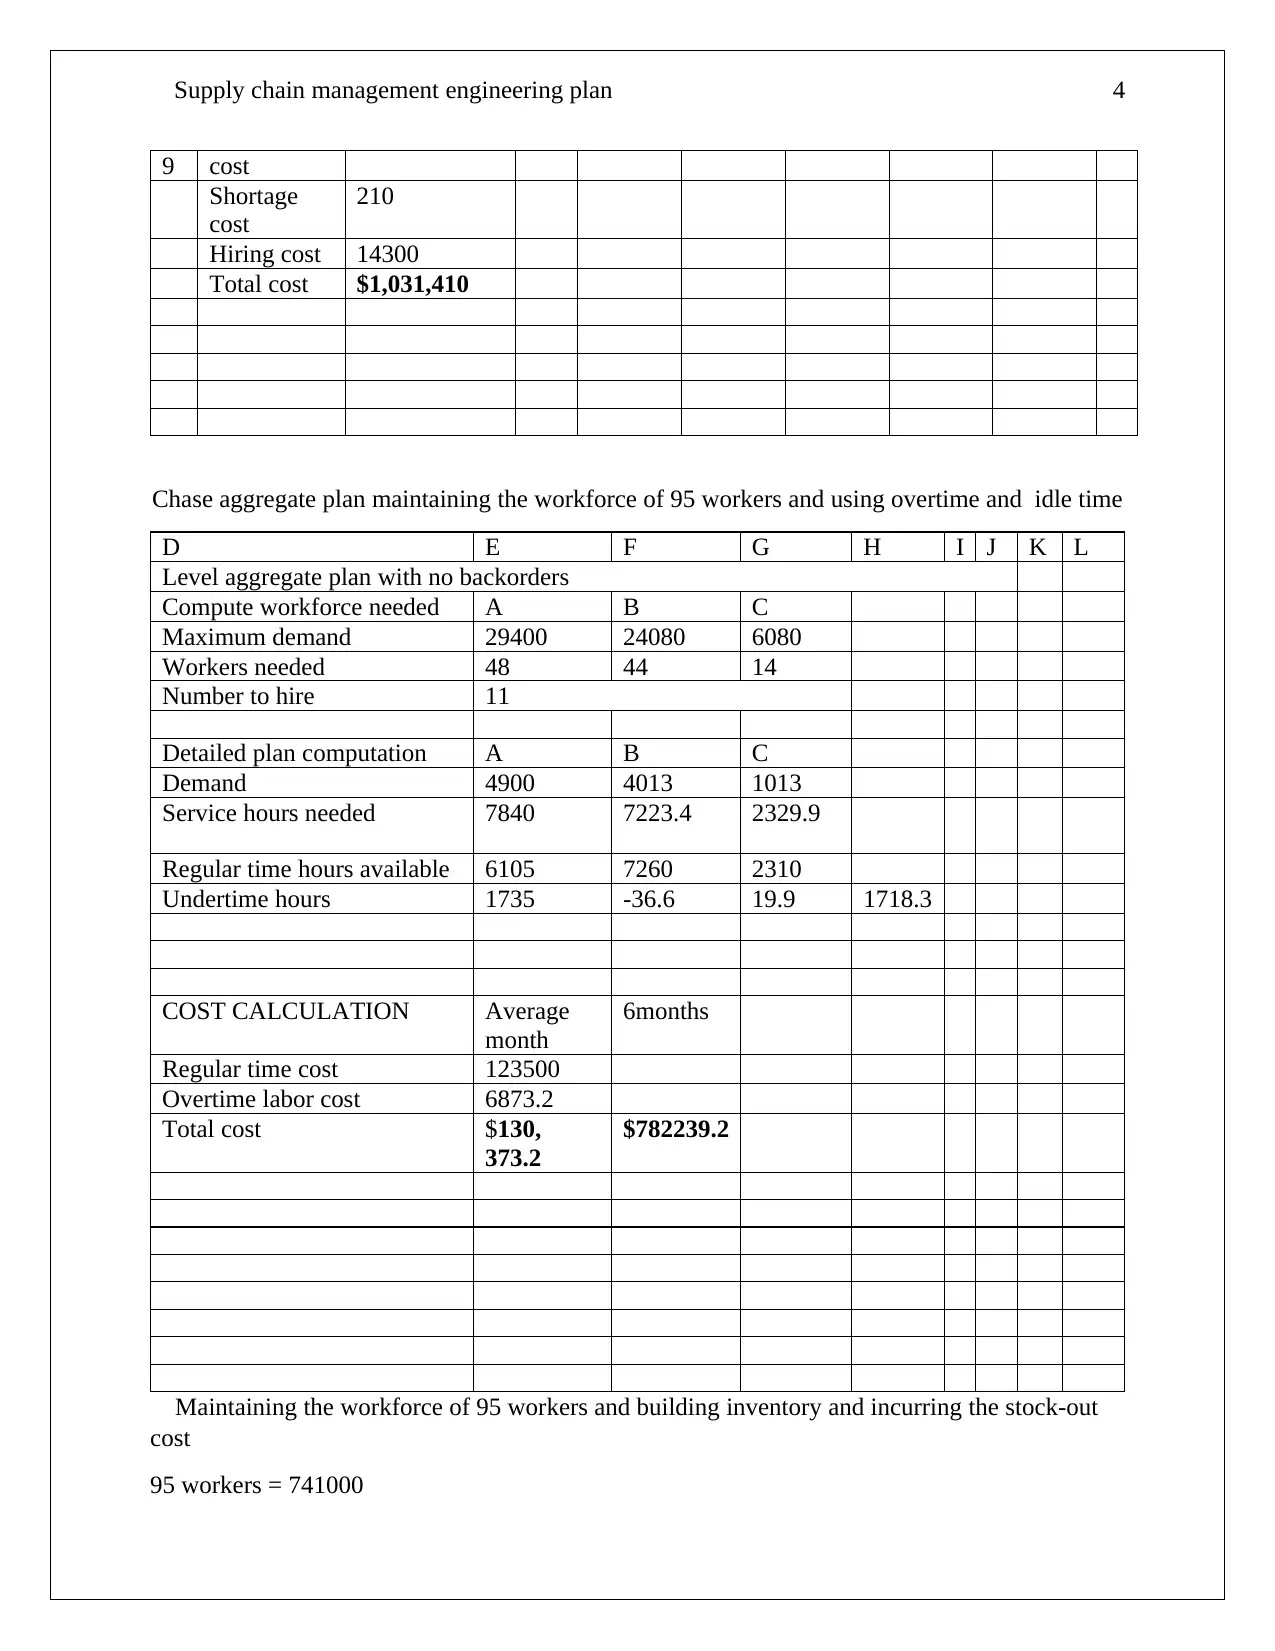
9 cost
Shortage
cost
210
Hiring cost 14300
Total cost $1,031,410
Chase aggregate plan maintaining the workforce of 95 workers and using overtime and idle time
D E F G H I J K L
Level aggregate plan with no backorders
Compute workforce needed A B C
Maximum demand 29400 24080 6080
Workers needed 48 44 14
Number to hire 11
Detailed plan computation A B C
Demand 4900 4013 1013
Service hours needed 7840 7223.4 2329.9
Regular time hours available 6105 7260 2310
Undertime hours 1735 -36.6 19.9 1718.3
COST CALCULATION Average
month
6months
Regular time cost 123500
Overtime labor cost 6873.2
Total cost $130,
373.2
$782239.2
Maintaining the workforce of 95 workers and building inventory and incurring the stock-out
cost
95 workers = 741000
Paraphrase This Document
Need a fresh take? Get an instant paraphrase of this document with our AI Paraphraser
Supply chain management engineering plan 5
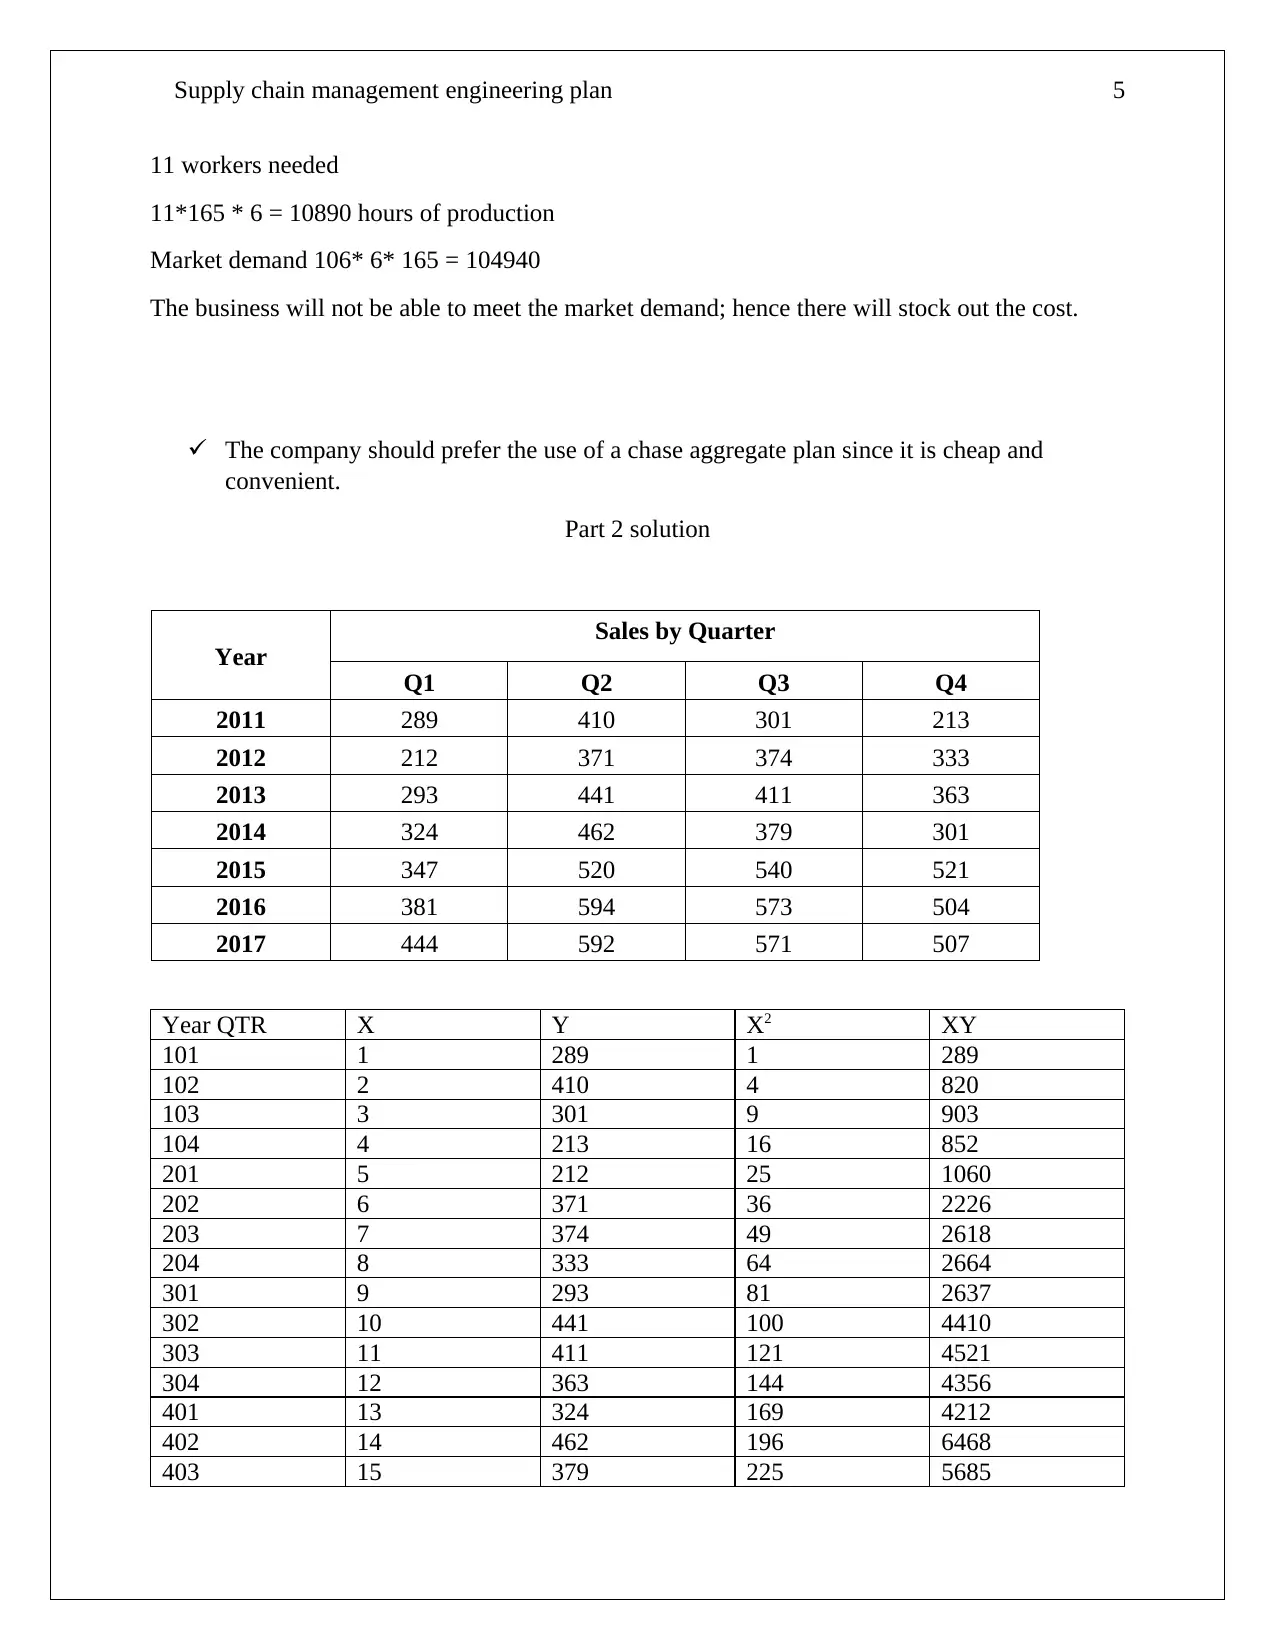
11 workers needed
11*165 * 6 = 10890 hours of production
Market demand 106* 6* 165 = 104940
The business will not be able to meet the market demand; hence there will stock out the cost.
The company should prefer the use of a chase aggregate plan since it is cheap and
convenient.
Part 2 solution
Year
Sales by Quarter
Q1 Q2 Q3 Q4
2011 289 410 301 213
2012 212 371 374 333
2013 293 441 411 363
2014 324 462 379 301
2015 347 520 540 521
2016 381 594 573 504
2017 444 592 571 507
Year QTR X Y X2 XY
101 1 289 1 289
102 2 410 4 820
103 3 301 9 903
104 4 213 16 852
201 5 212 25 1060
202 6 371 36 2226
203 7 374 49 2618
204 8 333 64 2664
301 9 293 81 2637
302 10 441 100 4410
303 11 411 121 4521
304 12 363 144 4356
401 13 324 169 4212
402 14 462 196 6468
403 15 379 225 5685
Supply chain management engineering plan 6
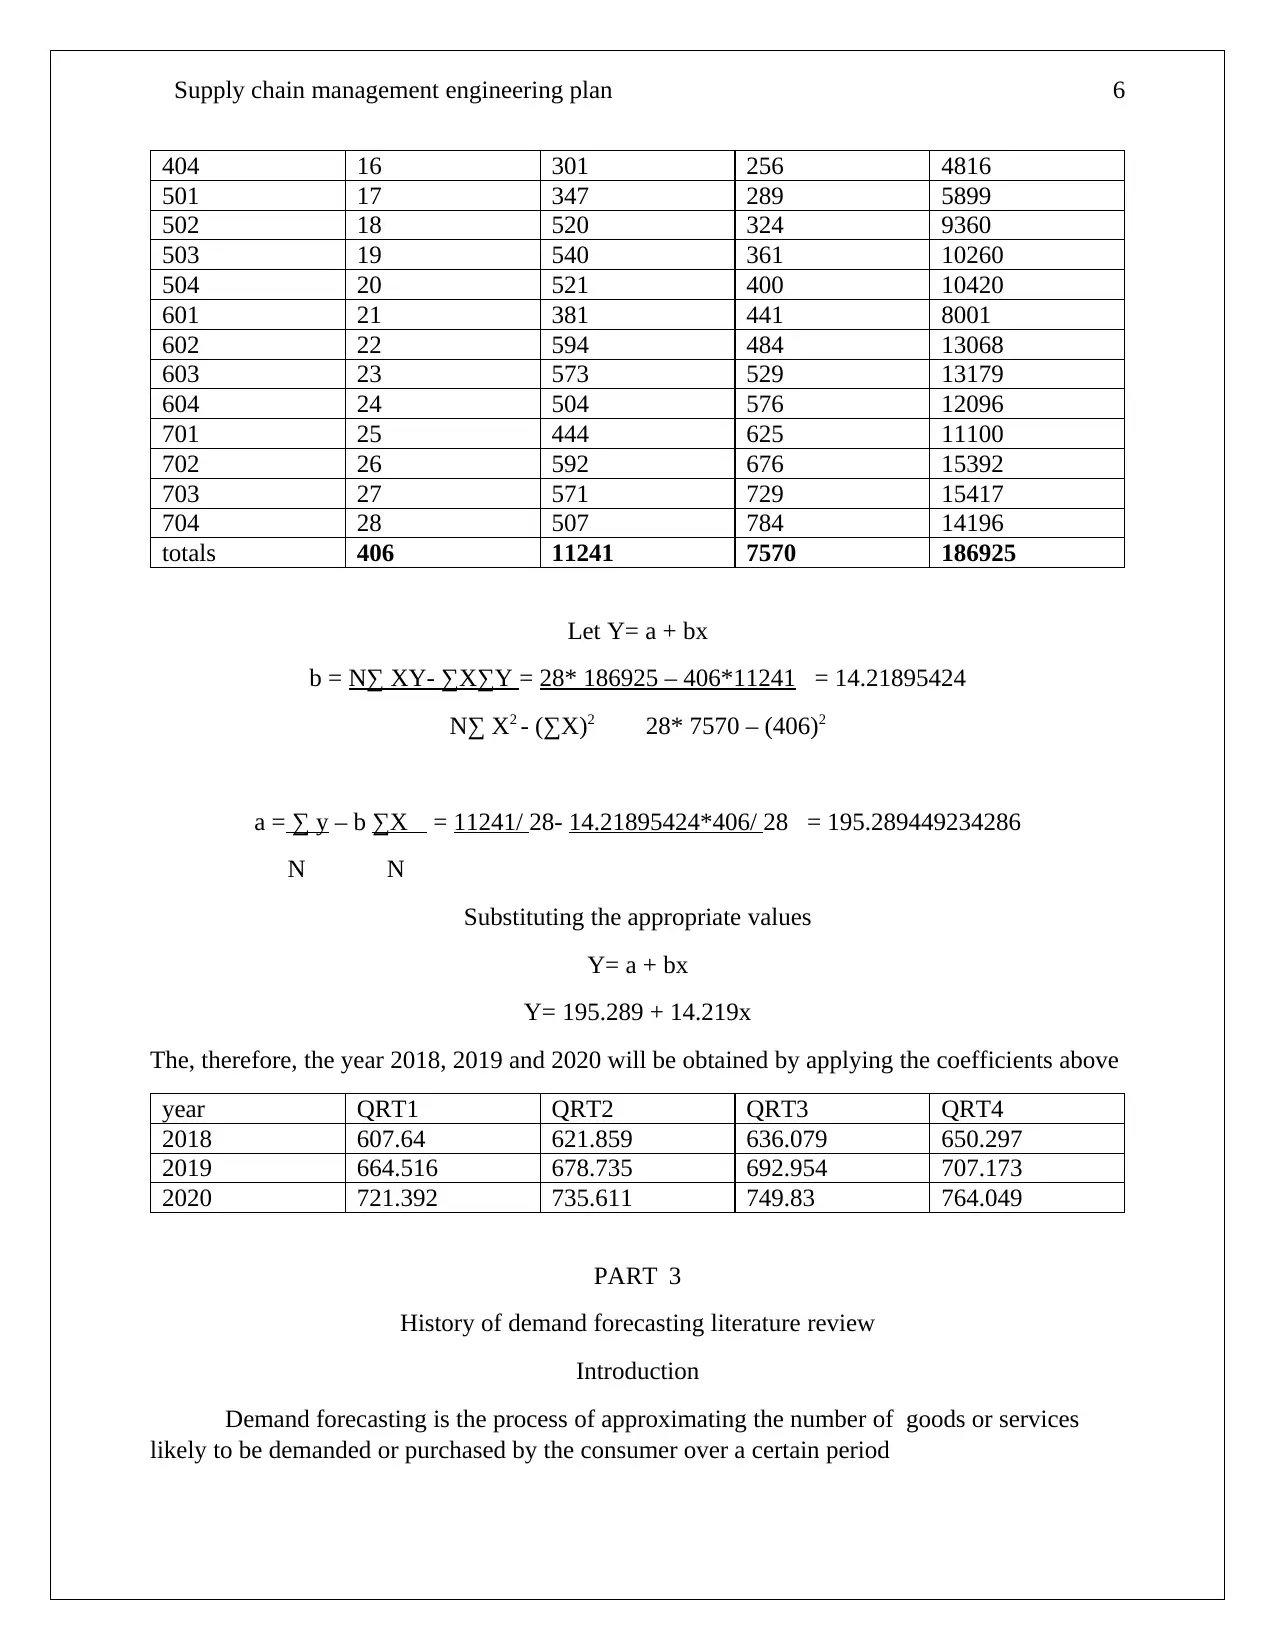
404 16 301 256 4816
501 17 347 289 5899
502 18 520 324 9360
503 19 540 361 10260
504 20 521 400 10420
601 21 381 441 8001
602 22 594 484 13068
603 23 573 529 13179
604 24 504 576 12096
701 25 444 625 11100
702 26 592 676 15392
703 27 571 729 15417
704 28 507 784 14196
totals 406 11241 7570 186925
Let Y= a + bx
b = N∑ XY- ∑X∑Y = 28* 186925 – 406*11241 = 14.21895424
N∑ X2 - (∑X)2 28* 7570 – (406)2
a = ∑ y – b ∑X = 11241/ 28- 14.21895424*406/ 28 = 195.289449234286
N N
Substituting the appropriate values
Y= a + bx
Y= 195.289 + 14.219x
The, therefore, the year 2018, 2019 and 2020 will be obtained by applying the coefficients above
year QRT1 QRT2 QRT3 QRT4
2018 607.64 621.859 636.079 650.297
2019 664.516 678.735 692.954 707.173
2020 721.392 735.611 749.83 764.049
PART 3
History of demand forecasting literature review
Introduction
Demand forecasting is the process of approximating the number of goods or services
likely to be demanded or purchased by the consumer over a certain period
⊘ This is a preview!⊘
Do you want full access?
Subscribe today to unlock all pages.
Trusted by 1+ million students worldwide
Supply chain management engineering plan 7
Covering the supply chain management
Researches have conceptualized supply chain integration to be in close relationship with
the quantity demanded (Van der Auweraer, Boute, & Syntetos, 2019). The supply of a particular
community is indirectly proportional to the demand. Due to dissatisfaction with human wants
and the scarce resources available, the market is viewed to be high than supply. The effective
supply chain will always be of satisfaction to the customers.
Demand forecasting techniques
It is the ability to predict the future demand of a commodity.
There are several techniques used to determine future demand as they include; exponential
smoothing
Discussion
It is inferred that various researches and improvements are in progress that will enable
accuracy in demand forecasting and effectiveness(Ren, Chan, & Siqin, 2019). There is a need to
fathom the present and the past scenarios even before predicting.
Conclusion
Demand and supply forecasting are triggered by the available or present and past
scenarios; however, it might be possible in the future that the scientists might come up with more
accurate methodologies that will enable effectiveness in predicting future data.
PART 4
History of supply chain engineering
Supply chain management is the management of the materials, people, money, and
information for consumer satisfaction.
Evolution of the supply chain management
In the years the 1950s and 1960s, most producers embarked on the use of mass
production to minimize the cost of production (Tse, Chung, & Pawar, 2020). Material
requirement planning is very crucial during production. It is a way to ensure there is continuous
supply in the market by carrying out a planned production, which determines first the demand
and, therefore, the production estimation.
Paraphrase This Document
Need a fresh take? Get an instant paraphrase of this document with our AI Paraphraser
Supply chain management engineering plan 8
In the year 1990s, the evolution of supply chain management continued(Romero-Silva &
Marsillac, 2019). It was, therefore, linked with the emergence of the network organization. The
ability to understand the environmental supply pressures is very crucial and hence enables the
supply management to plan effectively. The suppliers have to consider knowledge management,
information, and technology management for them to plan effectively.
Significance of performance evaluation
The performance evaluation is one of the most important tools as it comes up with a
strategy to achieve the objectives. Initially, the performance evaluation criterion is selected and
effected with maximum consideration of all supply requirements. The planned production
determines the supply. And the effectiveness of the available resources among other parts of the
chain.
PART 5
Price relationship
D1 = 50000 – 25pi
D2= 80000-50p2
Price 1
25p1 = 50,000
P1= 2000
Cost of production 500
Profit =2000-500= 1500
Price 2
50p2 = 80000
P2 = 1600
Cost of production = 500
Profit =1600-500 = 1100
Profit increment
1500 – 1100 = 400
Profit increment of $ 400
Supply chain management engineering plan 9
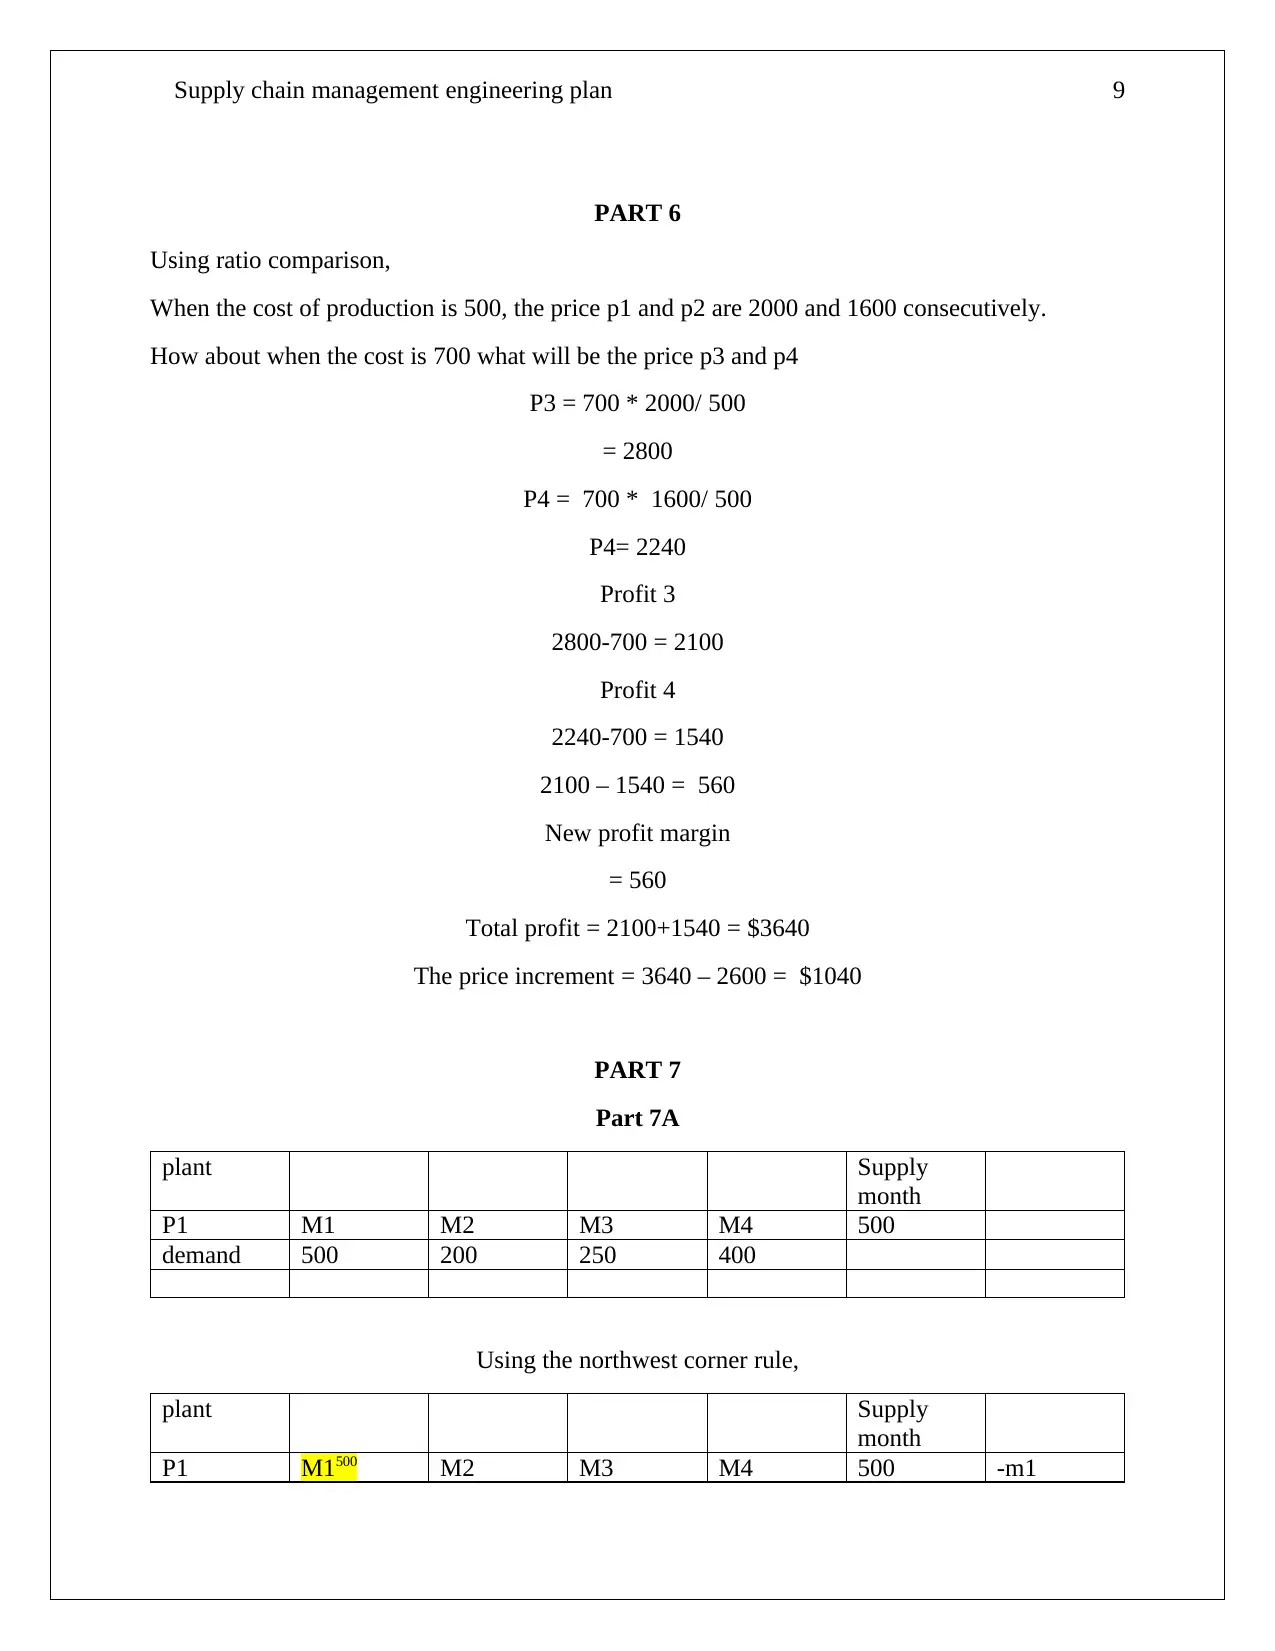
PART 6
Using ratio comparison,
When the cost of production is 500, the price p1 and p2 are 2000 and 1600 consecutively.
How about when the cost is 700 what will be the price p3 and p4
P3 = 700 * 2000/ 500
= 2800
P4 = 700 * 1600/ 500
P4= 2240
Profit 3
2800-700 = 2100
Profit 4
2240-700 = 1540
2100 – 1540 = 560
New profit margin
= 560
Total profit = 2100+1540 = $3640
The price increment = 3640 – 2600 = $1040
PART 7
Part 7A
plant Supply
month
P1 M1 M2 M3 M4 500
demand 500 200 250 400
Using the northwest corner rule,
plant Supply
month
P1 M1500 M2 M3 M4 500 -m1
⊘ This is a preview!⊘
Do you want full access?
Subscribe today to unlock all pages.
Trusted by 1+ million students worldwide
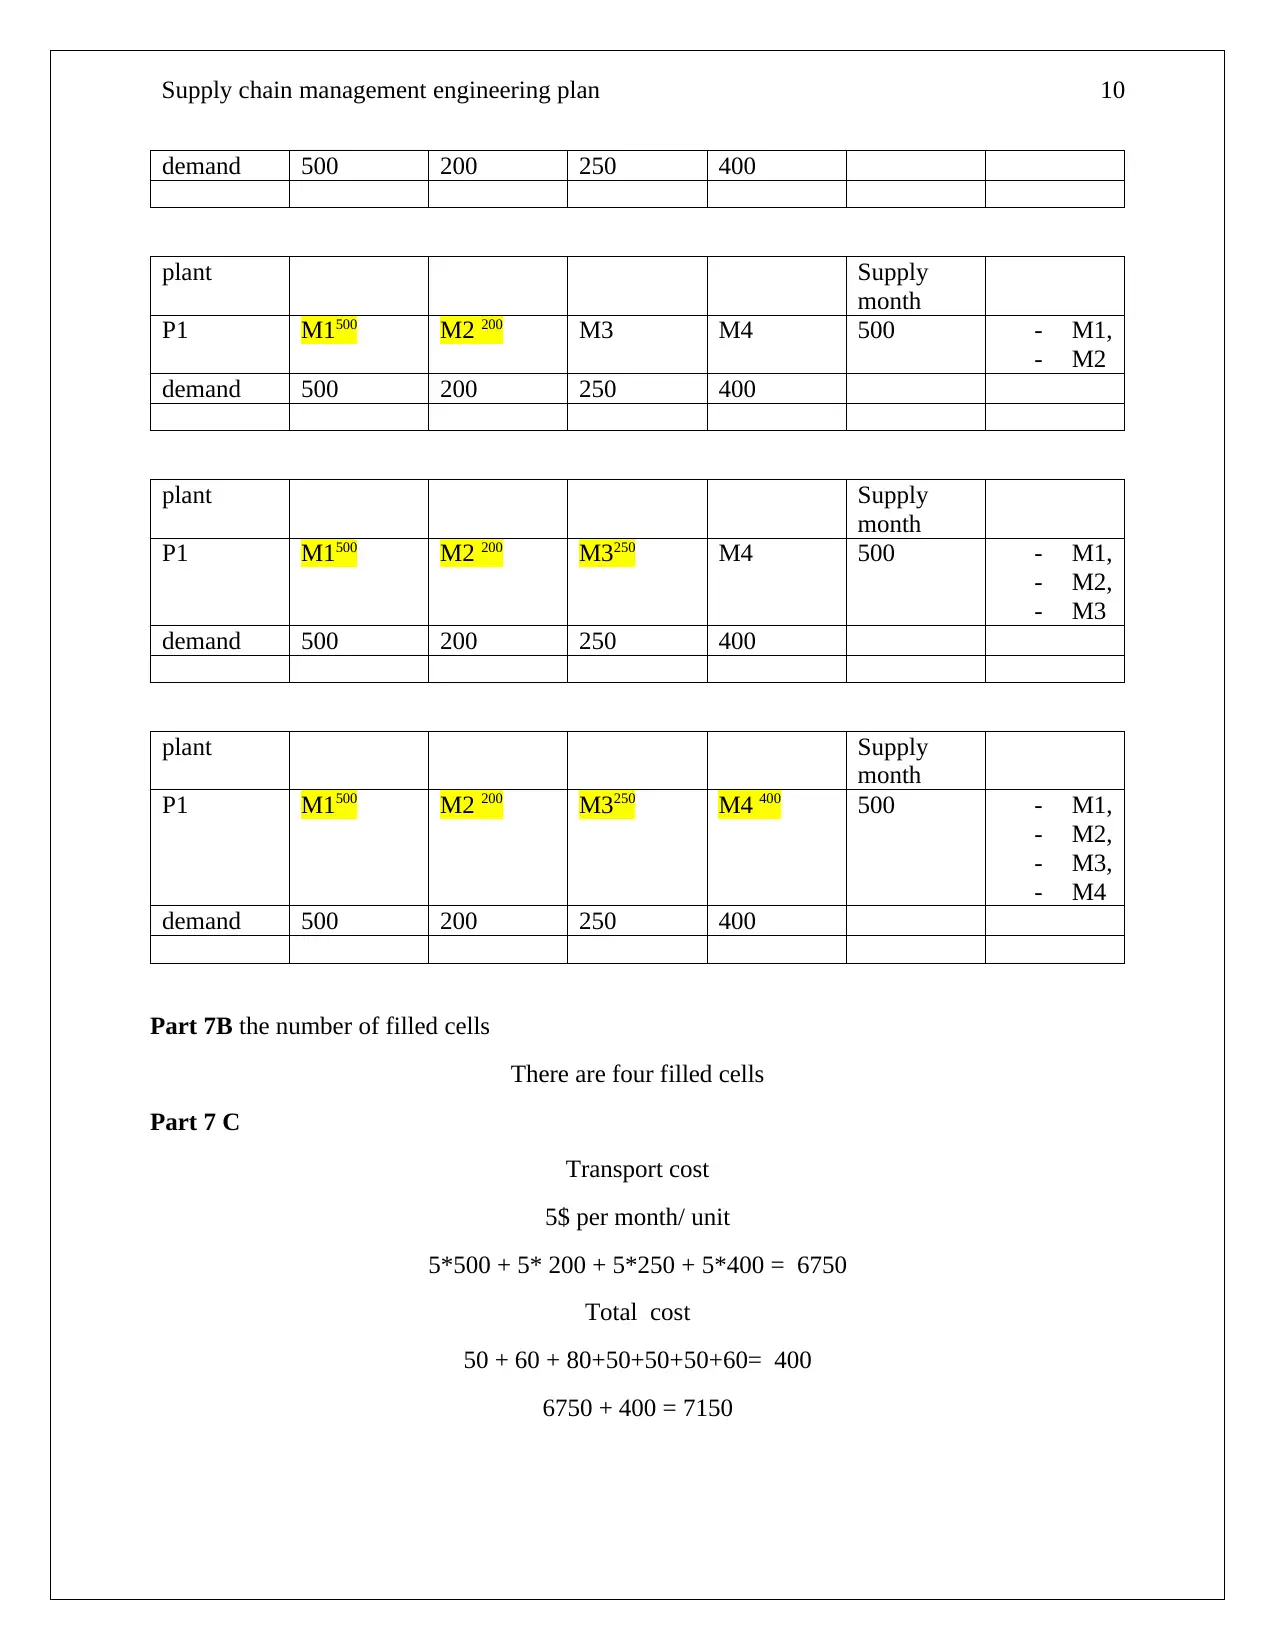
Supply chain management engineering plan 10
demand 500 200 250 400
plant Supply
month
P1 M1500 M2 200 M3 M4 500 - M1,
- M2
demand 500 200 250 400
plant Supply
month
P1 M1500 M2 200 M3250 M4 500 - M1,
- M2,
- M3
demand 500 200 250 400
plant Supply
month
P1 M1500 M2 200 M3250 M4 400 500 - M1,
- M2,
- M3,
- M4
demand 500 200 250 400
Part 7B the number of filled cells
There are four filled cells
Part 7 C
Transport cost
5$ per month/ unit
5*500 + 5* 200 + 5*250 + 5*400 = 6750
Total cost
50 + 60 + 80+50+50+50+60= 400
6750 + 400 = 7150
demand 500 200 250 400
plant Supply
month
P1 M1500 M2 200 M3 M4 500 - M1,
- M2
demand 500 200 250 400
plant Supply
month
P1 M1500 M2 200 M3250 M4 500 - M1,
- M2,
- M3
demand 500 200 250 400
plant Supply
month
P1 M1500 M2 200 M3250 M4 400 500 - M1,
- M2,
- M3,
- M4
demand 500 200 250 400
Part 7B the number of filled cells
There are four filled cells
Part 7 C
Transport cost
5$ per month/ unit
5*500 + 5* 200 + 5*250 + 5*400 = 6750
Total cost
50 + 60 + 80+50+50+50+60= 400
6750 + 400 = 7150
Paraphrase This Document
Need a fresh take? Get an instant paraphrase of this document with our AI Paraphraser
Supply chain management engineering plan 11
References
Ren, S., Chan, H.-L., & Siqin, T. (2019). Demand forecasting in retail operations for fashionable
products: methods, practices, and real case study. Annals of Operations Research, 1-17.
Romero-Silva, R., & Marsillac, E. (2019). Trends and topics in IJPR from 1961 to 2017: a
statistical history. International Journal of Production Research, 57(15-16), 4692-4718.
Tse, Y. K., Chung, S., & Pawar, K. S. (2020). Risk perception and decision making in the supply
chain: theory and practice. Industrial Management & Data Systems, 118(7).
Van der Auweraer, S., Boute, R. N., & Syntetos, A. A. (2019). Forecasting spare part demand
with installed base information: A review. International Journal of Forecasting, 35(1),
181-196.

Supply chain management engineering plan 12
⊘ This is a preview!⊘
Do you want full access?
Subscribe today to unlock all pages.
Trusted by 1+ million students worldwide
1 out of 12
Your All-in-One AI-Powered Toolkit for Academic Success.
+13062052269
info@desklib.com
Available 24*7 on WhatsApp / Email
![[object Object]](/_next/static/media/star-bottom.7253800d.svg)
Unlock your academic potential
Copyright © 2020–2026 A2Z Services. All Rights Reserved. Developed and managed by ZUCOL.