Comprehensive Financial Analysis of EMAAR Properties PJSC (2014-2018)
VerifiedAdded on 2022/12/01
|16
|3054
|306
Report
AI Summary
This report presents a comprehensive financial analysis of EMAAR Properties PJSC from 2014 to 2018. It begins with an overview of EMAAR's operations, including its revenue streams from shopping malls, hospitality, property development, and financial services. The analysis delves into the company's consolidated income statements and balance sheets for the specified period, highlighting key trends such as revenue growth, gross profit changes, and the impact of impairments and taxes on profitability. The report also examines the balance sheet, focusing on changes in assets, liabilities, and equity, including cash and bank balances, trade receivables, development properties, and investment properties. Furthermore, the study includes an in-depth analysis of various financial ratios, including liquidity, turnover, profitability, and financial risk ratios, providing a holistic view of EMAAR's financial performance and stability over the five-year period. The analysis reveals key insights into the company's efficiency, profitability, and financial risk management, supported by detailed tables and calculations.
1
BANKING AND FINANCE
BANKING AND FINANCE
Paraphrase This Document
Need a fresh take? Get an instant paraphrase of this document with our AI Paraphraser
2
Table of Contents
Introduction......................................................................................................................................3
ANALYSIS OF INCOME STATEMENT AND BALANCE SHEET...........................................3
Analyzing of financial ratios.........................................................................................................11
CONCLUSIONS AND RECOMMENDATIONS........................................................................15
References......................................................................................................................................17
3
Introduction
EMAAR was founded in the year 1997 on the 23rd of July but the operations were started
was on July 29, 1997. EMAAR is a joint stock public company and are listed in the financial
market of DUBAI. The main activities of the company from where the company earns its
revenue are shopping malls, hospitality, property development, and investment, property
management, retailing, and utility services. The company also provides financial services to its
client. The head office of the company is situated at EMAAR business park, DUBAI, UAE. The
company was listed in the financial market of Dubai in the year 2000, 26th of March. In this
paper the financial analysis has been done for the year 2014-2018 and also the financial
performance has been measured accordingly with the help of the important financial ratios for
the five years. The company falls in the sector of Real estate and construction.
ANALYSIS OF INCOME STATEMENT AND BALANCE SHEET
Income statement for the year 2014-2018
EMAAR Properties PJSC
CONSOLIDATED INCOME STATEMENT
Particulars Amount in AED'000
2018 2017 2016 2015 2014
Revenue
25,
694,324
18,8
12,044
15,5
39,704
13,6
60,536
9,8
93,205
Cost of Revenue
(12,
811,621)
(9,2
66,460)
(7,43
9,780)
(6,39
7,612)
(3,98
9,316)
GROSS PROFIT
12,
882,703
9,5
45,584
8,0
99,924
7,2
62,924
5,9
03,889
⊘ This is a preview!⊘
Do you want full access?
Subscribe today to unlock all pages.
Trusted by 1+ million students worldwide
4
Other Operating Income 433,281 354,36
3
3
24,720
3
20,595
3
02,757
Other Operating Expenses (196,101)
(1
68,173)
(15
7,040)
(16
0,560)
(17
0,787)
Finance Income 835,872 639,00
1
6
40,534
4
32,319
4
78,392
Finance Costs
(1,
057,015)
(7
33,851)
(59
8,668)
(47
7,563)
(50
8,908)
Other Income 489,336 476,92
6
4
37,292
1
48,672
4
20,013
Selling, Administrative Expenses and
general expenses
(4,
386,199)
(3,3
96,685)
(2,96
5,881)
(2,87
8,562)
(2,58
6,613)
Share of Results of Associates & Joint
Ventures 49,678 134,79
8
1
13,950
1
88,790
(
87,497
)
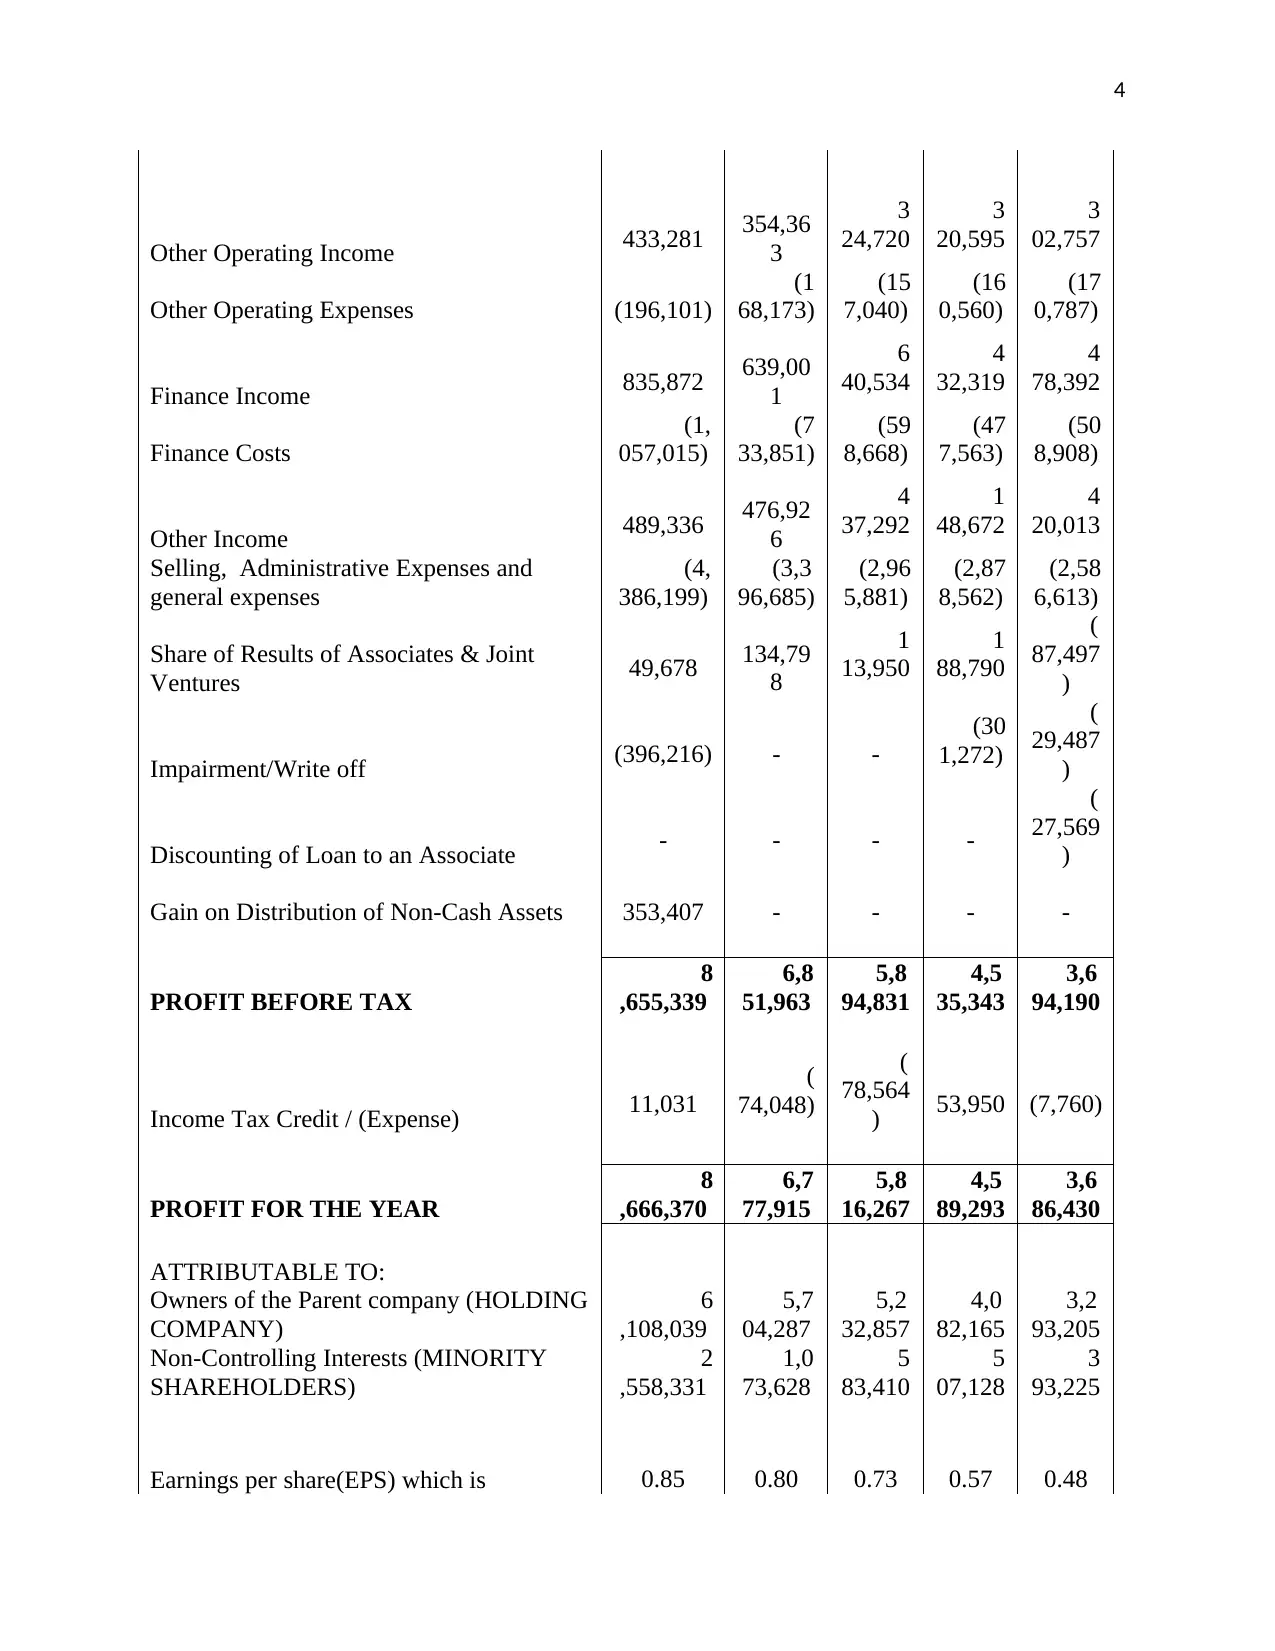
Impairment/Write off (396,216) - -
(30
1,272)
(
29,487
)
Discounting of Loan to an Associate - - - -
(
27,569
)
Gain on Distribution of Non-Cash Assets 353,407 - - - -
PROFIT BEFORE TAX
8
,655,339
6,8
51,963
5,8
94,831
4,5
35,343
3,6
94,190
Income Tax Credit / (Expense) 11,031
(
74,048)
(
78,564
) 53,950 (7,760)
PROFIT FOR THE YEAR
8
,666,370
6,7
77,915
5,8
16,267
4,5
89,293
3,6
86,430
ATTRIBUTABLE TO:
Owners of the Parent company (HOLDING
COMPANY)
6
,108,039
5,7
04,287
5,2
32,857
4,0
82,165
3,2
93,205
Non-Controlling Interests (MINORITY
SHAREHOLDERS)
2
,558,331
1,0
73,628
5
83,410
5
07,128
3
93,225
Earnings per share(EPS) which is 0.85 0.80 0.73 0.57 0.48
Other Operating Income 433,281 354,36
3
3
24,720
3
20,595
3
02,757
Other Operating Expenses (196,101)
(1
68,173)
(15
7,040)
(16
0,560)
(17
0,787)
Finance Income 835,872 639,00
1
6
40,534
4
32,319
4
78,392
Finance Costs
(1,
057,015)
(7
33,851)
(59
8,668)
(47
7,563)
(50
8,908)
Other Income 489,336 476,92
6
4
37,292
1
48,672
4
20,013
Selling, Administrative Expenses and
general expenses
(4,
386,199)
(3,3
96,685)
(2,96
5,881)
(2,87
8,562)
(2,58
6,613)
Share of Results of Associates & Joint
Ventures 49,678 134,79
8
1
13,950
1
88,790
(
87,497
)
Impairment/Write off (396,216) - -
(30
1,272)
(
29,487
)
Discounting of Loan to an Associate - - - -
(
27,569
)
Gain on Distribution of Non-Cash Assets 353,407 - - - -
PROFIT BEFORE TAX
8
,655,339
6,8
51,963
5,8
94,831
4,5
35,343
3,6
94,190
Income Tax Credit / (Expense) 11,031
(
74,048)
(
78,564
) 53,950 (7,760)
PROFIT FOR THE YEAR
8
,666,370
6,7
77,915
5,8
16,267
4,5
89,293
3,6
86,430
ATTRIBUTABLE TO:
Owners of the Parent company (HOLDING
COMPANY)
6
,108,039
5,7
04,287
5,2
32,857
4,0
82,165
3,2
93,205
Non-Controlling Interests (MINORITY
SHAREHOLDERS)
2
,558,331
1,0
73,628
5
83,410
5
07,128
3
93,225
Earnings per share(EPS) which is 0.85 0.80 0.73 0.57 0.48
Paraphrase This Document
Need a fresh take? Get an instant paraphrase of this document with our AI Paraphraser
5
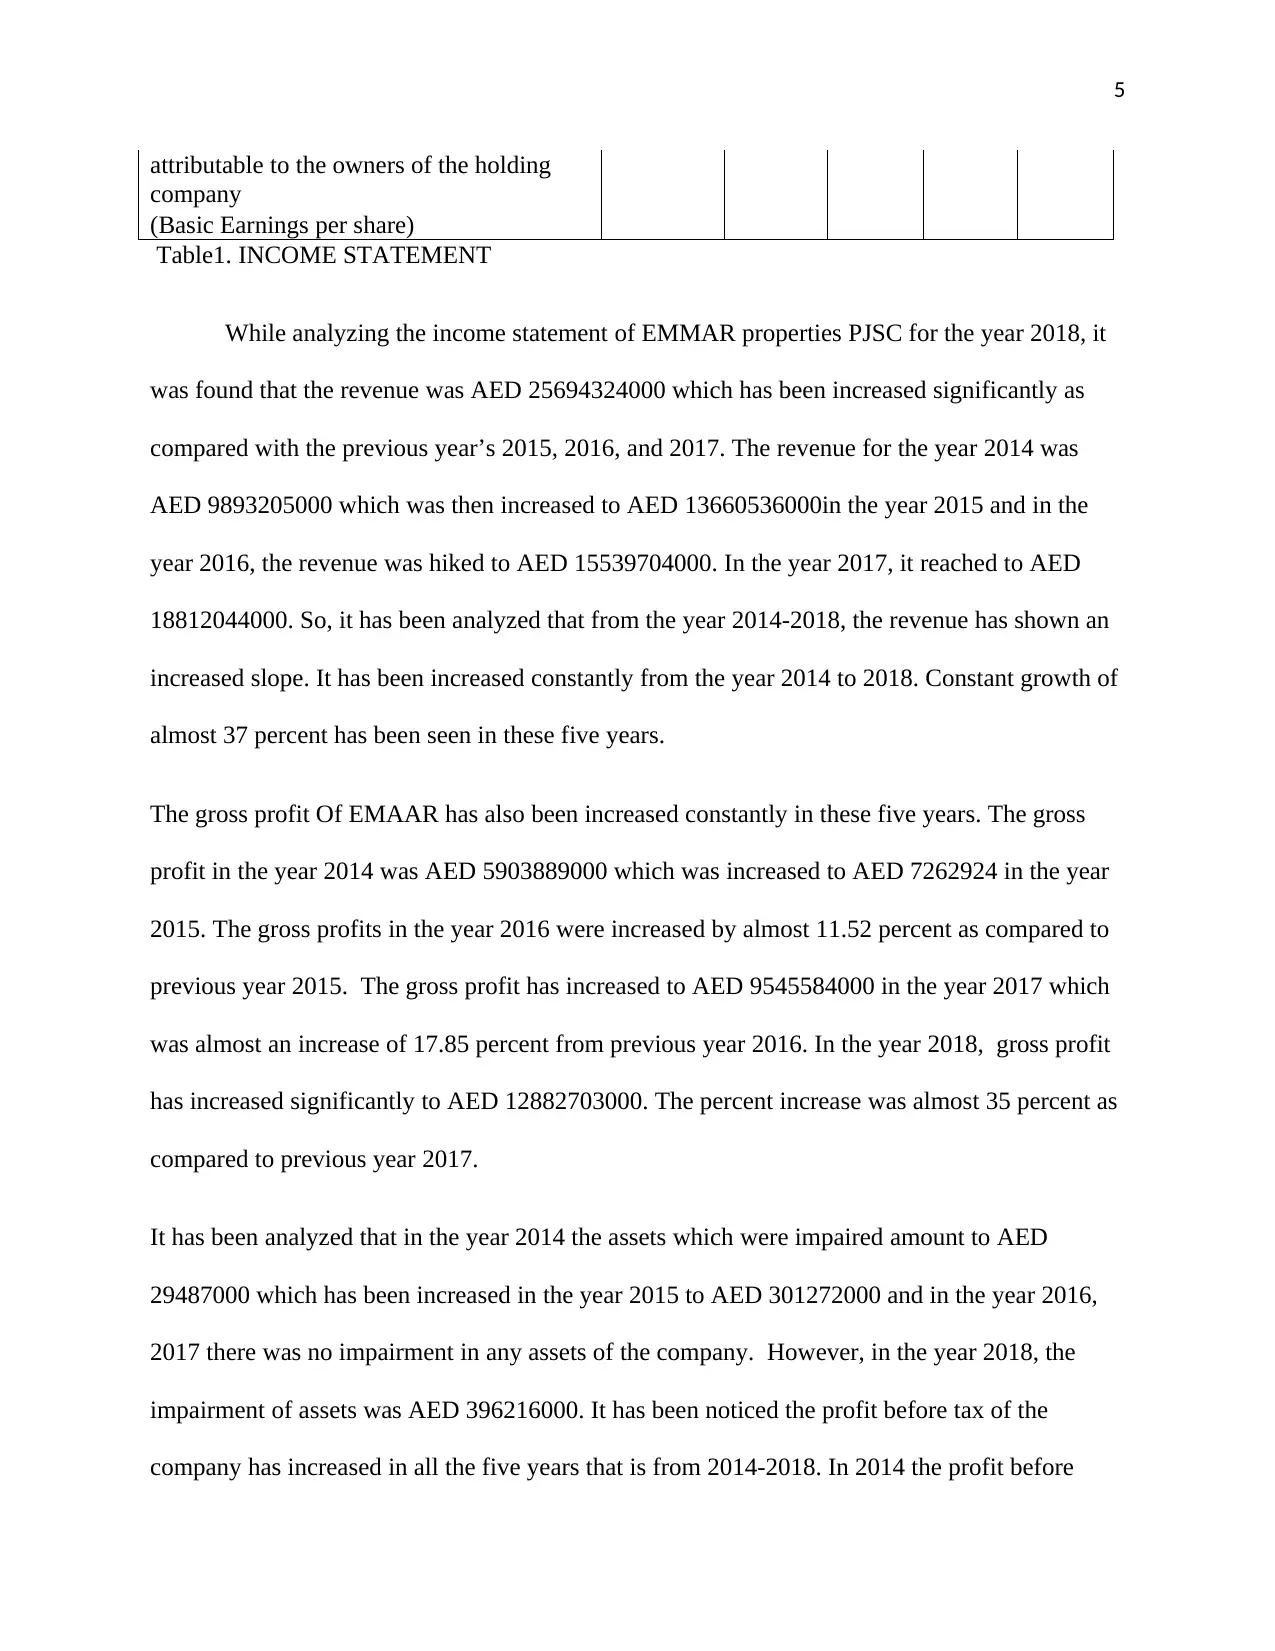
attributable to the owners of the holding
company
(Basic Earnings per share)
Table1. INCOME STATEMENT
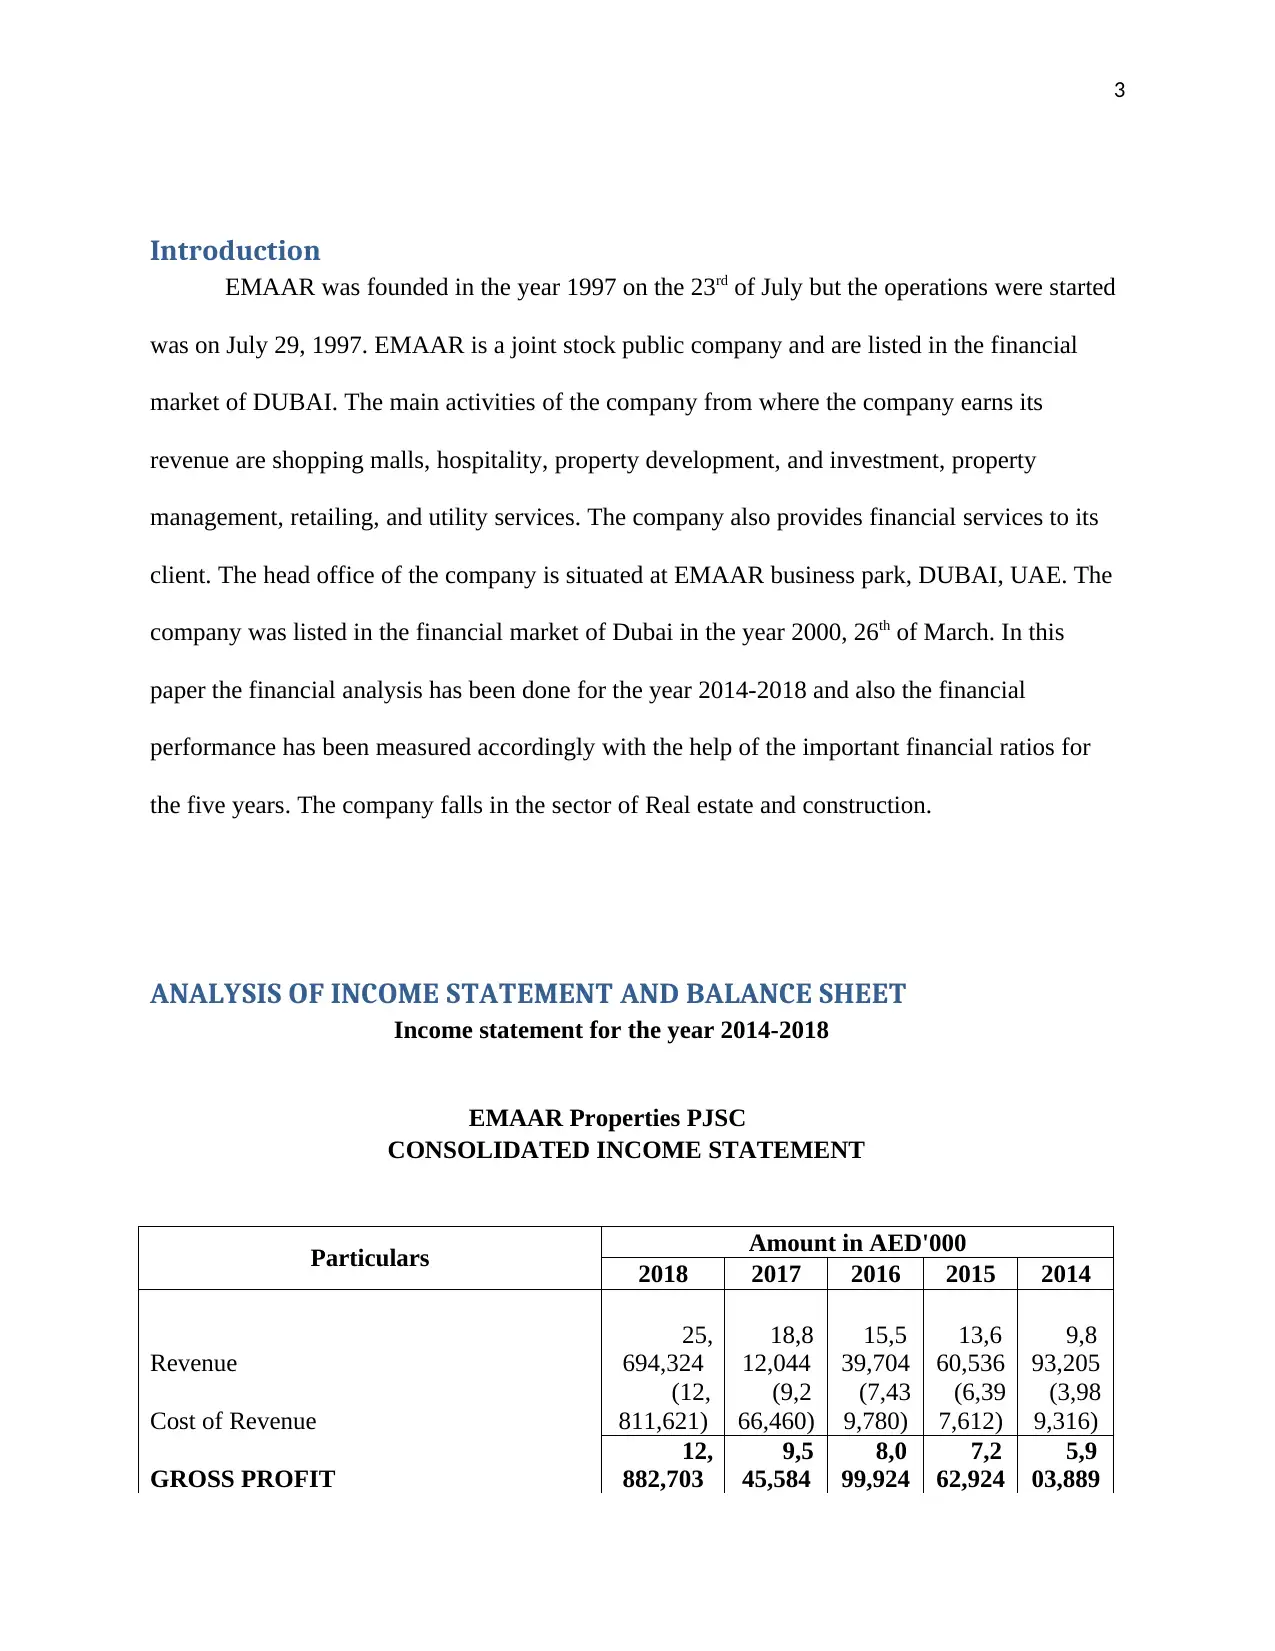
While analyzing the income statement of EMMAR properties PJSC for the year 2018, it
was found that the revenue was AED 25694324000 which has been increased significantly as
compared with the previous year’s 2015, 2016, and 2017. The revenue for the year 2014 was
AED 9893205000 which was then increased to AED 13660536000in the year 2015 and in the
year 2016, the revenue was hiked to AED 15539704000. In the year 2017, it reached to AED
18812044000. So, it has been analyzed that from the year 2014-2018, the revenue has shown an
increased slope. It has been increased constantly from the year 2014 to 2018. Constant growth of
almost 37 percent has been seen in these five years.
The gross profit Of EMAAR has also been increased constantly in these five years. The gross
profit in the year 2014 was AED 5903889000 which was increased to AED 7262924 in the year
2015. The gross profits in the year 2016 were increased by almost 11.52 percent as compared to
previous year 2015. The gross profit has increased to AED 9545584000 in the year 2017 which
was almost an increase of 17.85 percent from previous year 2016. In the year 2018, gross profit
has increased significantly to AED 12882703000. The percent increase was almost 35 percent as
compared to previous year 2017.
It has been analyzed that in the year 2014 the assets which were impaired amount to AED
29487000 which has been increased in the year 2015 to AED 301272000 and in the year 2016,
2017 there was no impairment in any assets of the company. However, in the year 2018, the
impairment of assets was AED 396216000. It has been noticed the profit before tax of the
company has increased in all the five years that is from 2014-2018. In 2014 the profit before
attributable to the owners of the holding
company
(Basic Earnings per share)
Table1. INCOME STATEMENT
While analyzing the income statement of EMMAR properties PJSC for the year 2018, it
was found that the revenue was AED 25694324000 which has been increased significantly as
compared with the previous year’s 2015, 2016, and 2017. The revenue for the year 2014 was
AED 9893205000 which was then increased to AED 13660536000in the year 2015 and in the
year 2016, the revenue was hiked to AED 15539704000. In the year 2017, it reached to AED
18812044000. So, it has been analyzed that from the year 2014-2018, the revenue has shown an
increased slope. It has been increased constantly from the year 2014 to 2018. Constant growth of
almost 37 percent has been seen in these five years.
The gross profit Of EMAAR has also been increased constantly in these five years. The gross
profit in the year 2014 was AED 5903889000 which was increased to AED 7262924 in the year
2015. The gross profits in the year 2016 were increased by almost 11.52 percent as compared to
previous year 2015. The gross profit has increased to AED 9545584000 in the year 2017 which
was almost an increase of 17.85 percent from previous year 2016. In the year 2018, gross profit
has increased significantly to AED 12882703000. The percent increase was almost 35 percent as
compared to previous year 2017.
It has been analyzed that in the year 2014 the assets which were impaired amount to AED
29487000 which has been increased in the year 2015 to AED 301272000 and in the year 2016,
2017 there was no impairment in any assets of the company. However, in the year 2018, the
impairment of assets was AED 396216000. It has been noticed the profit before tax of the
company has increased in all the five years that is from 2014-2018. In 2014 the profit before
6
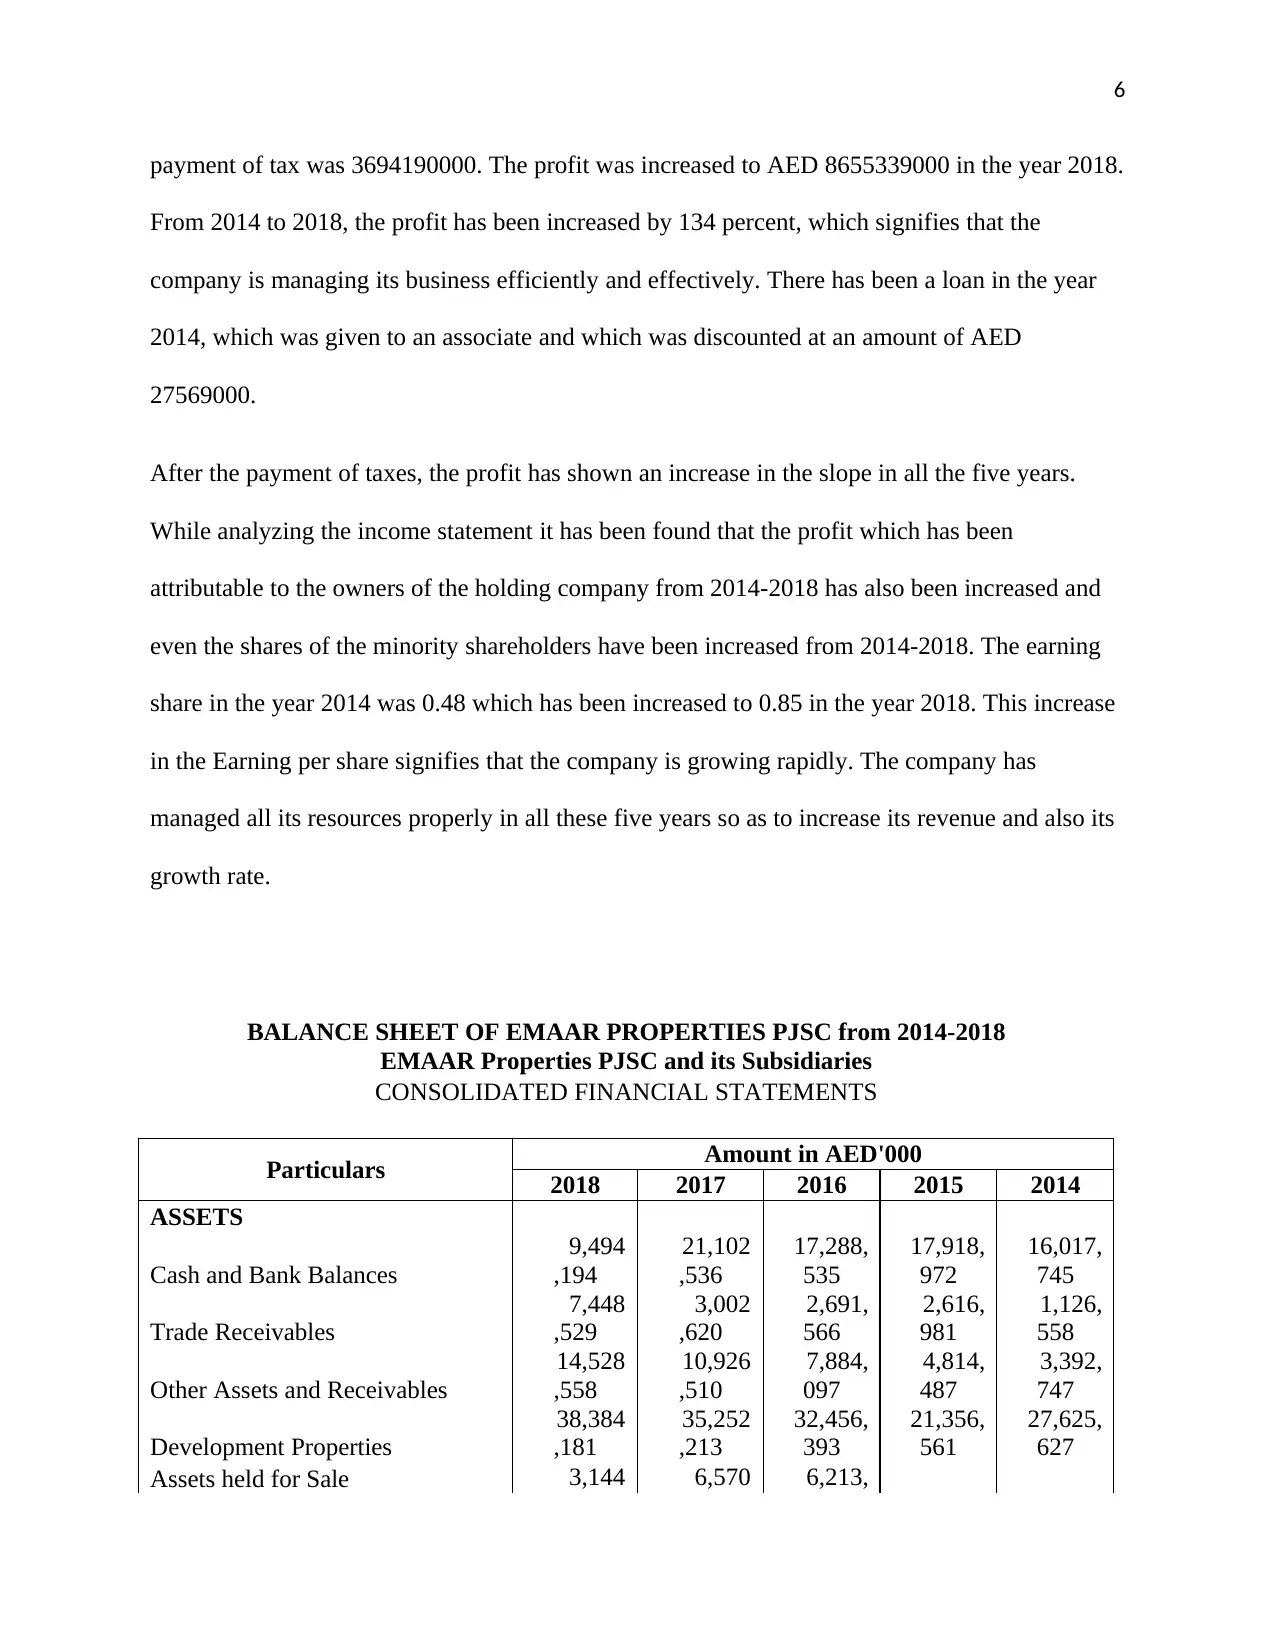
payment of tax was 3694190000. The profit was increased to AED 8655339000 in the year 2018.
From 2014 to 2018, the profit has been increased by 134 percent, which signifies that the
company is managing its business efficiently and effectively. There has been a loan in the year
2014, which was given to an associate and which was discounted at an amount of AED
27569000.
After the payment of taxes, the profit has shown an increase in the slope in all the five years.
While analyzing the income statement it has been found that the profit which has been
attributable to the owners of the holding company from 2014-2018 has also been increased and
even the shares of the minority shareholders have been increased from 2014-2018. The earning
share in the year 2014 was 0.48 which has been increased to 0.85 in the year 2018. This increase
in the Earning per share signifies that the company is growing rapidly. The company has
managed all its resources properly in all these five years so as to increase its revenue and also its
growth rate.
BALANCE SHEET OF EMAAR PROPERTIES PJSC from 2014-2018
EMAAR Properties PJSC and its Subsidiaries
CONSOLIDATED FINANCIAL STATEMENTS
Particulars Amount in AED'000
2018 2017 2016 2015 2014
ASSETS
Cash and Bank Balances
9,494
,194
21,102
,536
17,288,
535
17,918,
972
16,017,
745
Trade Receivables
7,448
,529
3,002
,620
2,691,
566
2,616,
981
1,126,
558
Other Assets and Receivables
14,528
,558
10,926
,510
7,884,
097
4,814,
487
3,392,
747
Development Properties
38,384
,181
35,252
,213
32,456,
393
21,356,
561
27,625,
627
Assets held for Sale 3,144 6,570 6,213,
⊘ This is a preview!⊘
Do you want full access?
Subscribe today to unlock all pages.
Trusted by 1+ million students worldwide
7
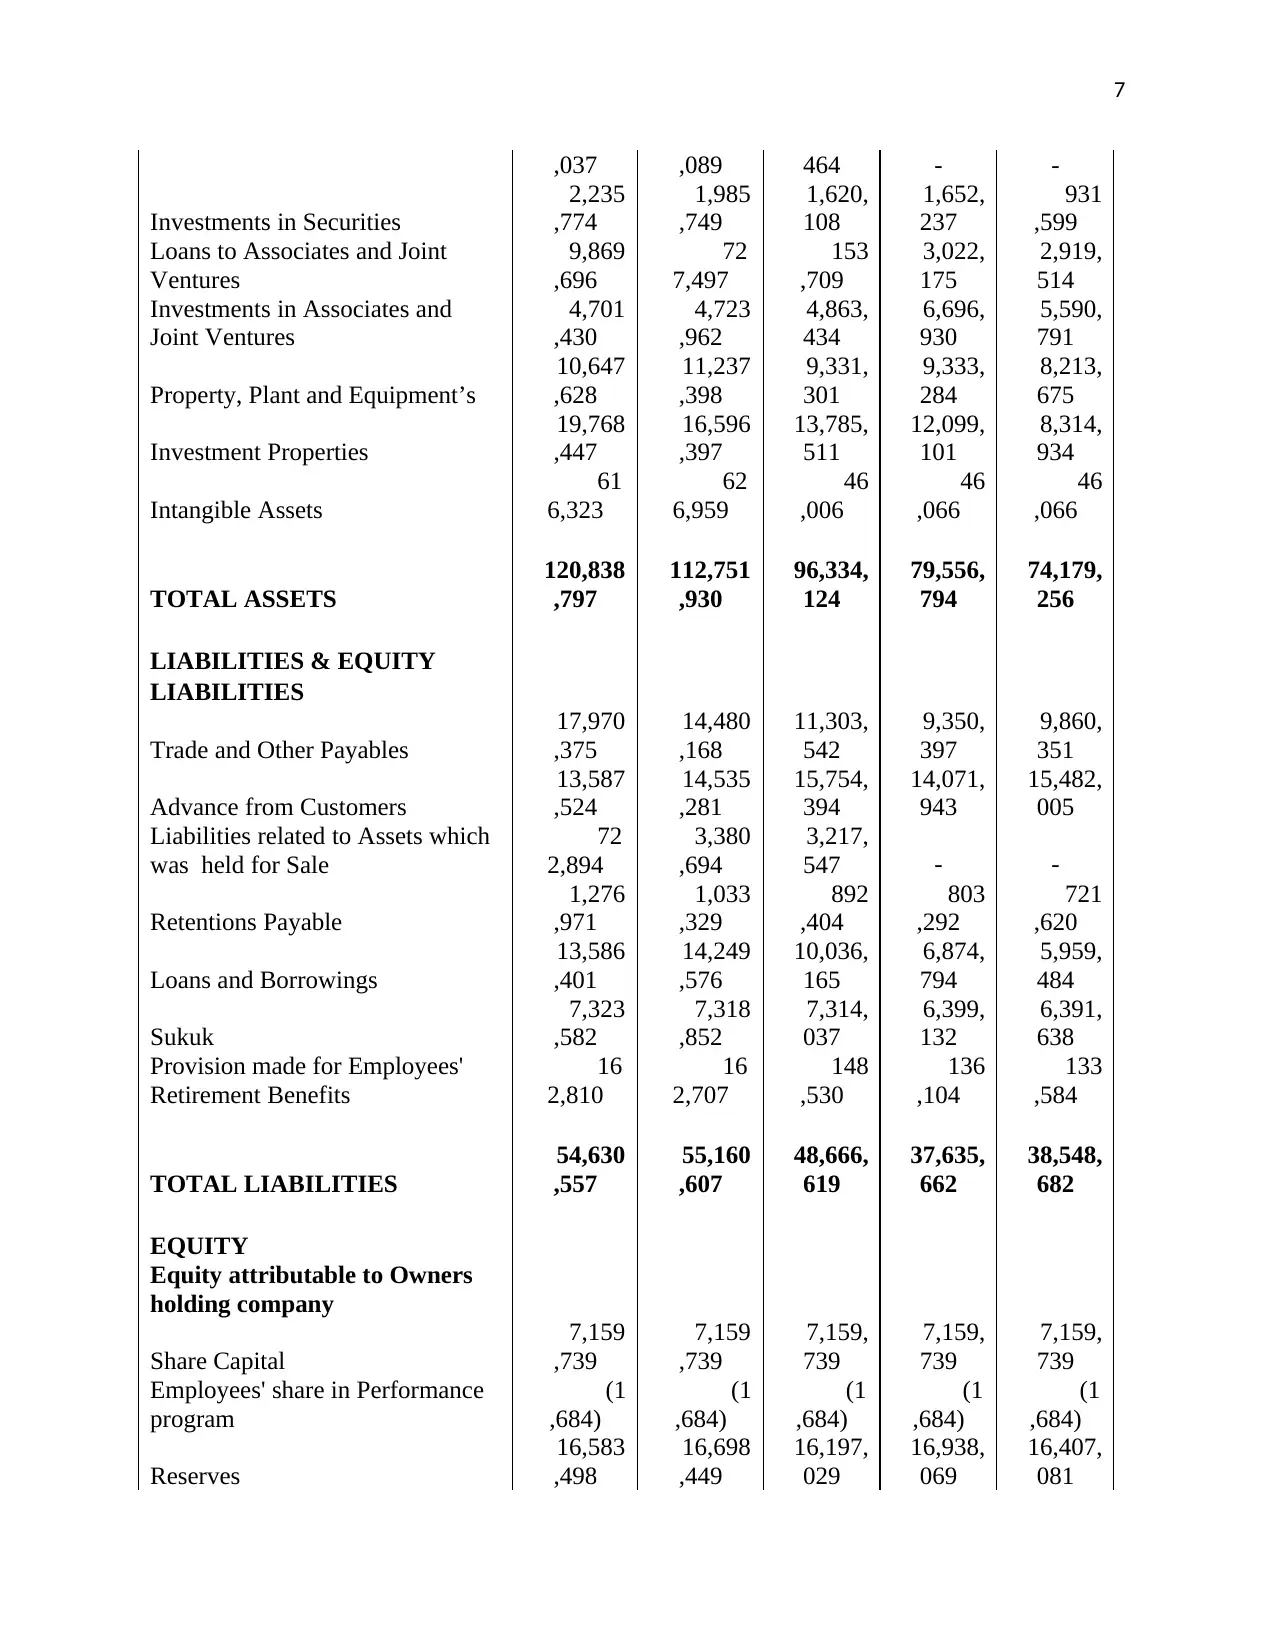
,037 ,089 464 - -
Investments in Securities
2,235
,774
1,985
,749
1,620,
108
1,652,
237
931
,599
Loans to Associates and Joint
Ventures
9,869
,696
72
7,497
153
,709
3,022,
175
2,919,
514
Investments in Associates and
Joint Ventures
4,701
,430
4,723
,962
4,863,
434
6,696,
930
5,590,
791
Property, Plant and Equipment’s
10,647
,628
11,237
,398
9,331,
301
9,333,
284
8,213,
675
Investment Properties
19,768
,447
16,596
,397
13,785,
511
12,099,
101
8,314,
934
Intangible Assets
61
6,323
62
6,959
46
,006
46
,066
46
,066
TOTAL ASSETS
120,838
,797
112,751
,930
96,334,
124
79,556,
794
74,179,
256
LIABILITIES & EQUITY
LIABILITIES
Trade and Other Payables
17,970
,375
14,480
,168
11,303,
542
9,350,
397
9,860,
351
Advance from Customers
13,587
,524
14,535
,281
15,754,
394
14,071,
943
15,482,
005
Liabilities related to Assets which
was held for Sale
72
2,894
3,380
,694
3,217,
547 - -
Retentions Payable
1,276
,971
1,033
,329
892
,404
803
,292
721
,620
Loans and Borrowings
13,586
,401
14,249
,576
10,036,
165
6,874,
794
5,959,
484
Sukuk
7,323
,582
7,318
,852
7,314,
037
6,399,
132
6,391,
638
Provision made for Employees'
Retirement Benefits
16
2,810
16
2,707
148
,530
136
,104
133
,584
TOTAL LIABILITIES
54,630
,557
55,160
,607
48,666,
619
37,635,
662
38,548,
682
EQUITY
Equity attributable to Owners
holding company
Share Capital
7,159
,739
7,159
,739
7,159,
739
7,159,
739
7,159,
739
Employees' share in Performance
program
(1
,684)
(1
,684)
(1
,684)
(1
,684)
(1
,684)
Reserves
16,583
,498
16,698
,449
16,197,
029
16,938,
069
16,407,
081
Paraphrase This Document
Need a fresh take? Get an instant paraphrase of this document with our AI Paraphraser
8
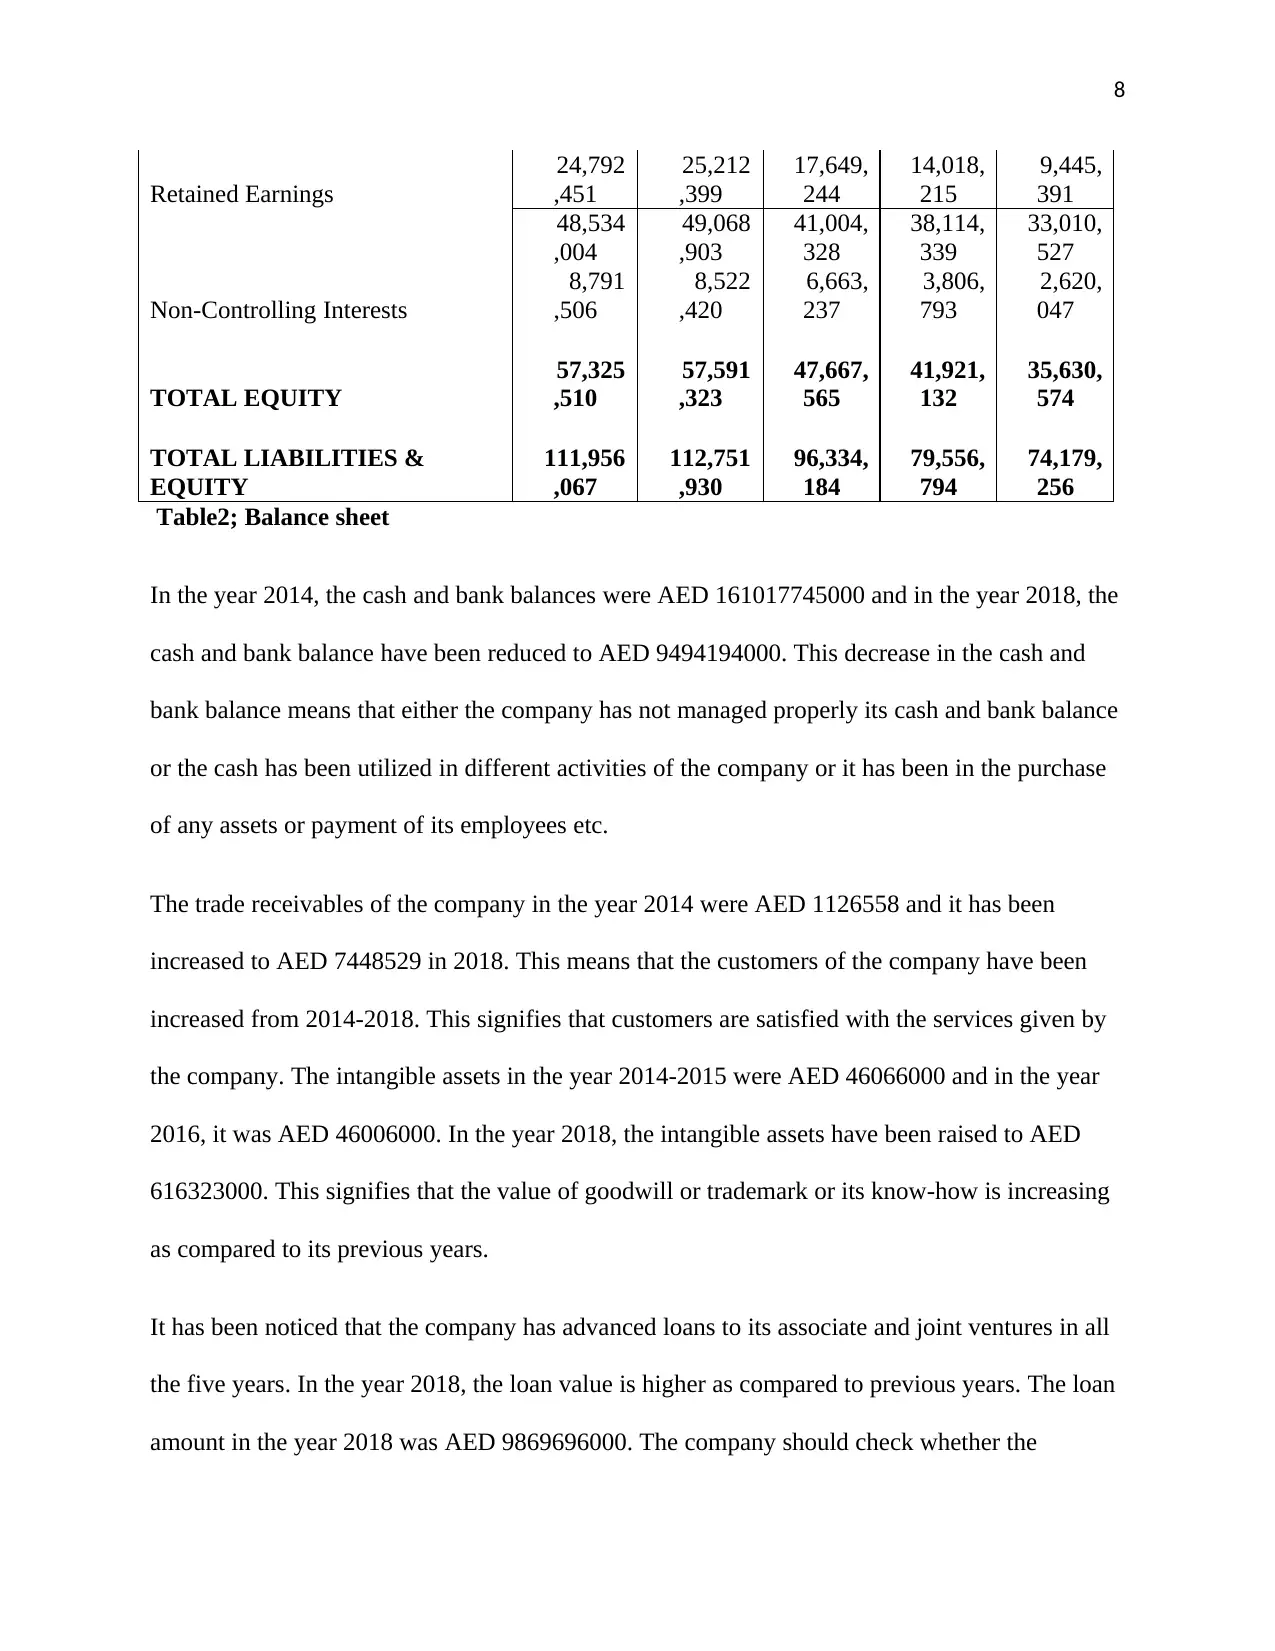
Retained Earnings
24,792
,451
25,212
,399
17,649,
244
14,018,
215
9,445,
391
48,534
,004
49,068
,903
41,004,
328
38,114,
339
33,010,
527
Non-Controlling Interests
8,791
,506
8,522
,420
6,663,
237
3,806,
793
2,620,
047
TOTAL EQUITY
57,325
,510
57,591
,323
47,667,
565
41,921,
132
35,630,
574
TOTAL LIABILITIES &
EQUITY
111,956
,067
112,751
,930
96,334,
184
79,556,
794
74,179,
256
Table2; Balance sheet
In the year 2014, the cash and bank balances were AED 161017745000 and in the year 2018, the
cash and bank balance have been reduced to AED 9494194000. This decrease in the cash and
bank balance means that either the company has not managed properly its cash and bank balance
or the cash has been utilized in different activities of the company or it has been in the purchase
of any assets or payment of its employees etc.
The trade receivables of the company in the year 2014 were AED 1126558 and it has been
increased to AED 7448529 in 2018. This means that the customers of the company have been
increased from 2014-2018. This signifies that customers are satisfied with the services given by
the company. The intangible assets in the year 2014-2015 were AED 46066000 and in the year
2016, it was AED 46006000. In the year 2018, the intangible assets have been raised to AED
616323000. This signifies that the value of goodwill or trademark or its know-how is increasing
as compared to its previous years.
It has been noticed that the company has advanced loans to its associate and joint ventures in all
the five years. In the year 2018, the loan value is higher as compared to previous years. The loan
amount in the year 2018 was AED 9869696000. The company should check whether the
9
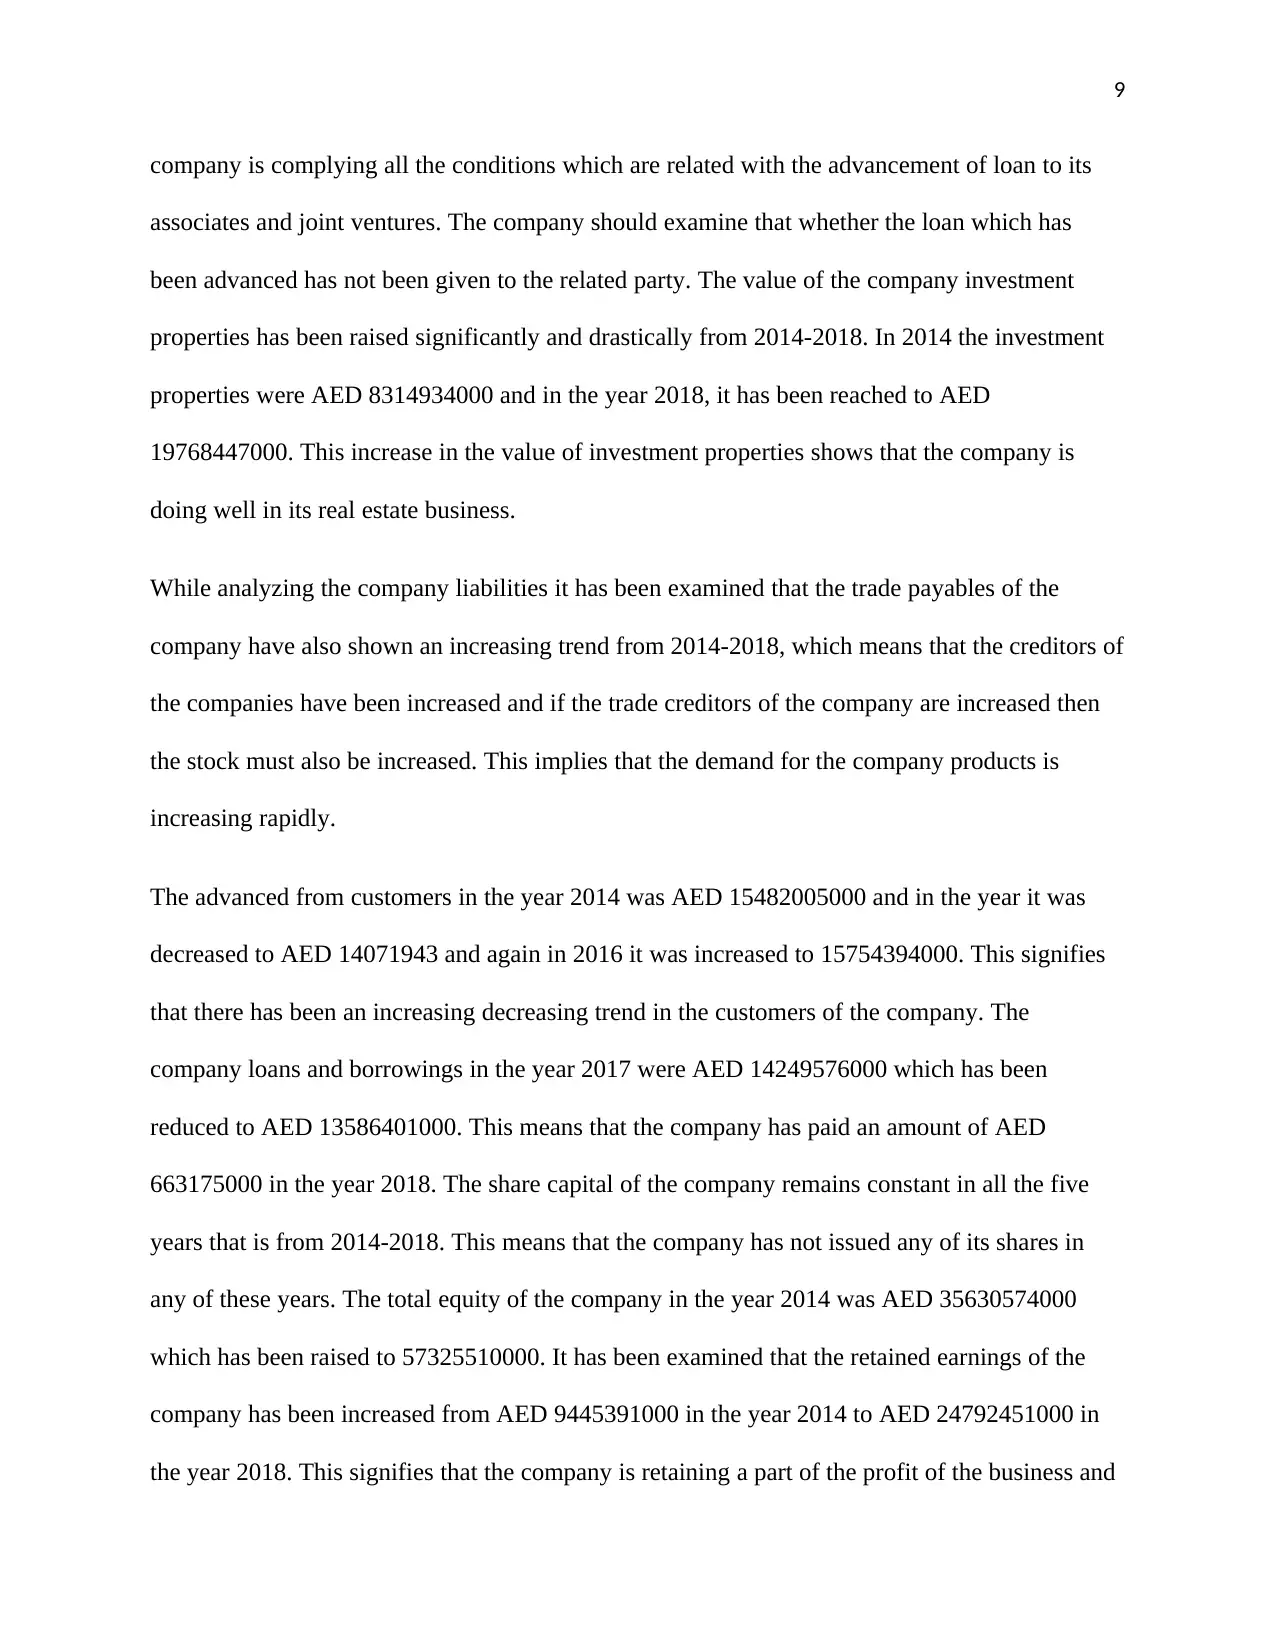
company is complying all the conditions which are related with the advancement of loan to its
associates and joint ventures. The company should examine that whether the loan which has
been advanced has not been given to the related party. The value of the company investment
properties has been raised significantly and drastically from 2014-2018. In 2014 the investment
properties were AED 8314934000 and in the year 2018, it has been reached to AED
19768447000. This increase in the value of investment properties shows that the company is
doing well in its real estate business.
While analyzing the company liabilities it has been examined that the trade payables of the
company have also shown an increasing trend from 2014-2018, which means that the creditors of
the companies have been increased and if the trade creditors of the company are increased then
the stock must also be increased. This implies that the demand for the company products is
increasing rapidly.
The advanced from customers in the year 2014 was AED 15482005000 and in the year it was
decreased to AED 14071943 and again in 2016 it was increased to 15754394000. This signifies
that there has been an increasing decreasing trend in the customers of the company. The
company loans and borrowings in the year 2017 were AED 14249576000 which has been
reduced to AED 13586401000. This means that the company has paid an amount of AED
663175000 in the year 2018. The share capital of the company remains constant in all the five
years that is from 2014-2018. This means that the company has not issued any of its shares in
any of these years. The total equity of the company in the year 2014 was AED 35630574000
which has been raised to 57325510000. It has been examined that the retained earnings of the
company has been increased from AED 9445391000 in the year 2014 to AED 24792451000 in
the year 2018. This signifies that the company is retaining a part of the profit of the business and
⊘ This is a preview!⊘
Do you want full access?
Subscribe today to unlock all pages.
Trusted by 1+ million students worldwide
10
deploying it in the business so that it expands its business and also to increase the revenue for the
company which is good policy adopted by the company. The liability or obligations which arise
from sukuk in the year 2014 was AED 6391638000 and it has been increased to AED
7323582000. This increasing trend implies that the share of investor in the company is increasing
year by year.
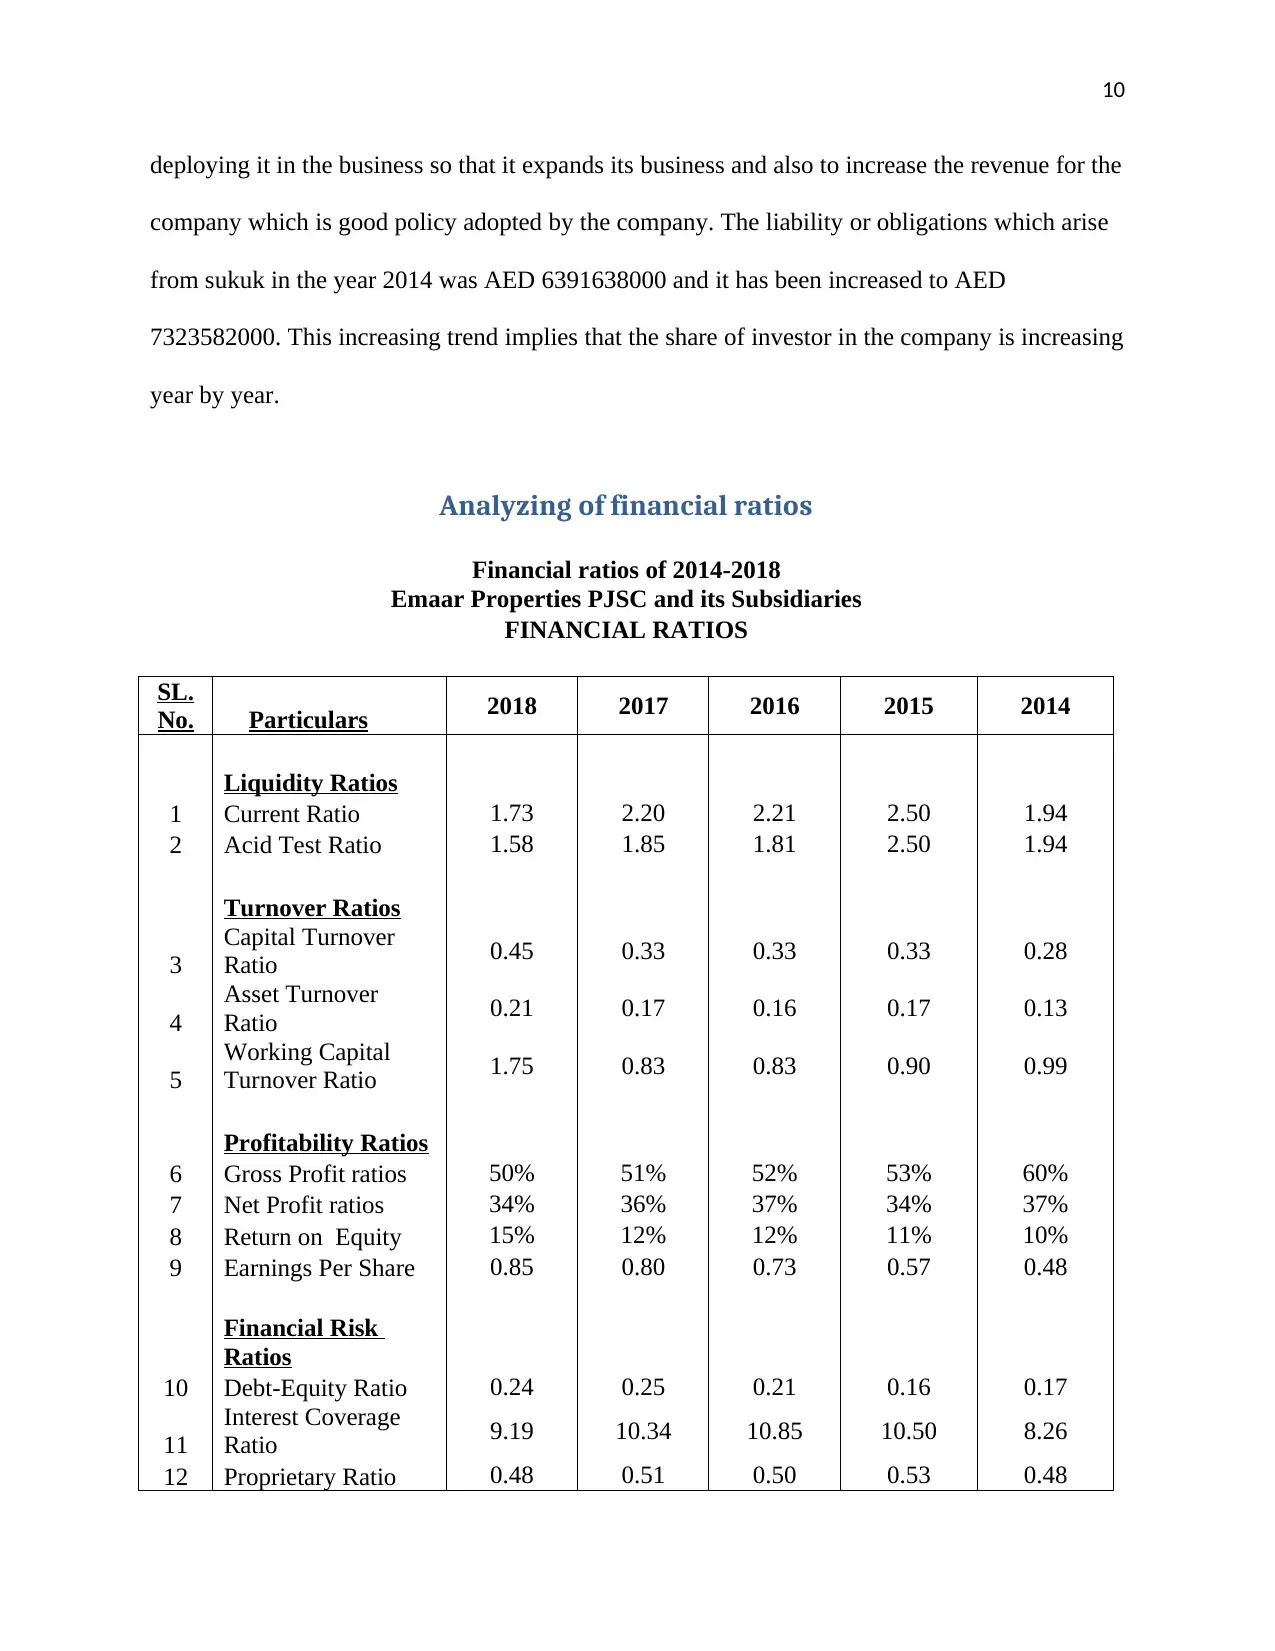
Analyzing of financial ratios
Financial ratios of 2014-2018
Emaar Properties PJSC and its Subsidiaries
FINANCIAL RATIOS
SL.
No. Particulars 2018 2017 2016 2015 2014
Liquidity Ratios
1 Current Ratio 1.73 2.20 2.21 2.50 1.94
2 Acid Test Ratio 1.58 1.85 1.81 2.50 1.94
Turnover Ratios
3
Capital Turnover
Ratio 0.45 0.33 0.33 0.33 0.28
4
Asset Turnover
Ratio 0.21 0.17 0.16 0.17 0.13
5
Working Capital
Turnover Ratio 1.75 0.83 0.83 0.90 0.99
Profitability Ratios
6 Gross Profit ratios 50% 51% 52% 53% 60%
7 Net Profit ratios 34% 36% 37% 34% 37%
8 Return on Equity 15% 12% 12% 11% 10%
9 Earnings Per Share 0.85 0.80 0.73 0.57 0.48
Financial Risk
Ratios
10 Debt-Equity Ratio 0.24 0.25 0.21 0.16 0.17
11
Interest Coverage
Ratio 9.19 10.34 10.85 10.50 8.26
12 Proprietary Ratio 0.48 0.51 0.50 0.53 0.48
deploying it in the business so that it expands its business and also to increase the revenue for the
company which is good policy adopted by the company. The liability or obligations which arise
from sukuk in the year 2014 was AED 6391638000 and it has been increased to AED
7323582000. This increasing trend implies that the share of investor in the company is increasing
year by year.
Analyzing of financial ratios
Financial ratios of 2014-2018
Emaar Properties PJSC and its Subsidiaries
FINANCIAL RATIOS
SL.
No. Particulars 2018 2017 2016 2015 2014
Liquidity Ratios
1 Current Ratio 1.73 2.20 2.21 2.50 1.94
2 Acid Test Ratio 1.58 1.85 1.81 2.50 1.94
Turnover Ratios
3
Capital Turnover
Ratio 0.45 0.33 0.33 0.33 0.28
4
Asset Turnover
Ratio 0.21 0.17 0.16 0.17 0.13
5
Working Capital
Turnover Ratio 1.75 0.83 0.83 0.90 0.99
Profitability Ratios
6 Gross Profit ratios 50% 51% 52% 53% 60%
7 Net Profit ratios 34% 36% 37% 34% 37%
8 Return on Equity 15% 12% 12% 11% 10%
9 Earnings Per Share 0.85 0.80 0.73 0.57 0.48
Financial Risk
Ratios
10 Debt-Equity Ratio 0.24 0.25 0.21 0.16 0.17
11
Interest Coverage
Ratio 9.19 10.34 10.85 10.50 8.26
12 Proprietary Ratio 0.48 0.51 0.50 0.53 0.48
Paraphrase This Document
Need a fresh take? Get an instant paraphrase of this document with our AI Paraphraser
11
Current Assets
34,6
15,318
41,6
01,755
34,0
77,662
25,35
0,440
20,53
7,050
Current Liabilities
19,9
70,240
18,8
94,191
15,4
13,493
10,15
3,689
10,58
1,971
Working Capital
14,6
45,078
22,7
07,564
18,6
64,169
15,19
6,751
9,95
5,079
Assets held for Sale
3,1
44,037
6,5
70,089
6,2
13,464 - -
Quick Assets
31,4
71,281
35,0
31,666
27,8
64,198
25,35
0,440
20,53
7,050
Table3; Financial ratios
2014 2015 2016 2017 2018
0
0.5
1
1.5
2
2.5
3
Current Ratio Current Ratio
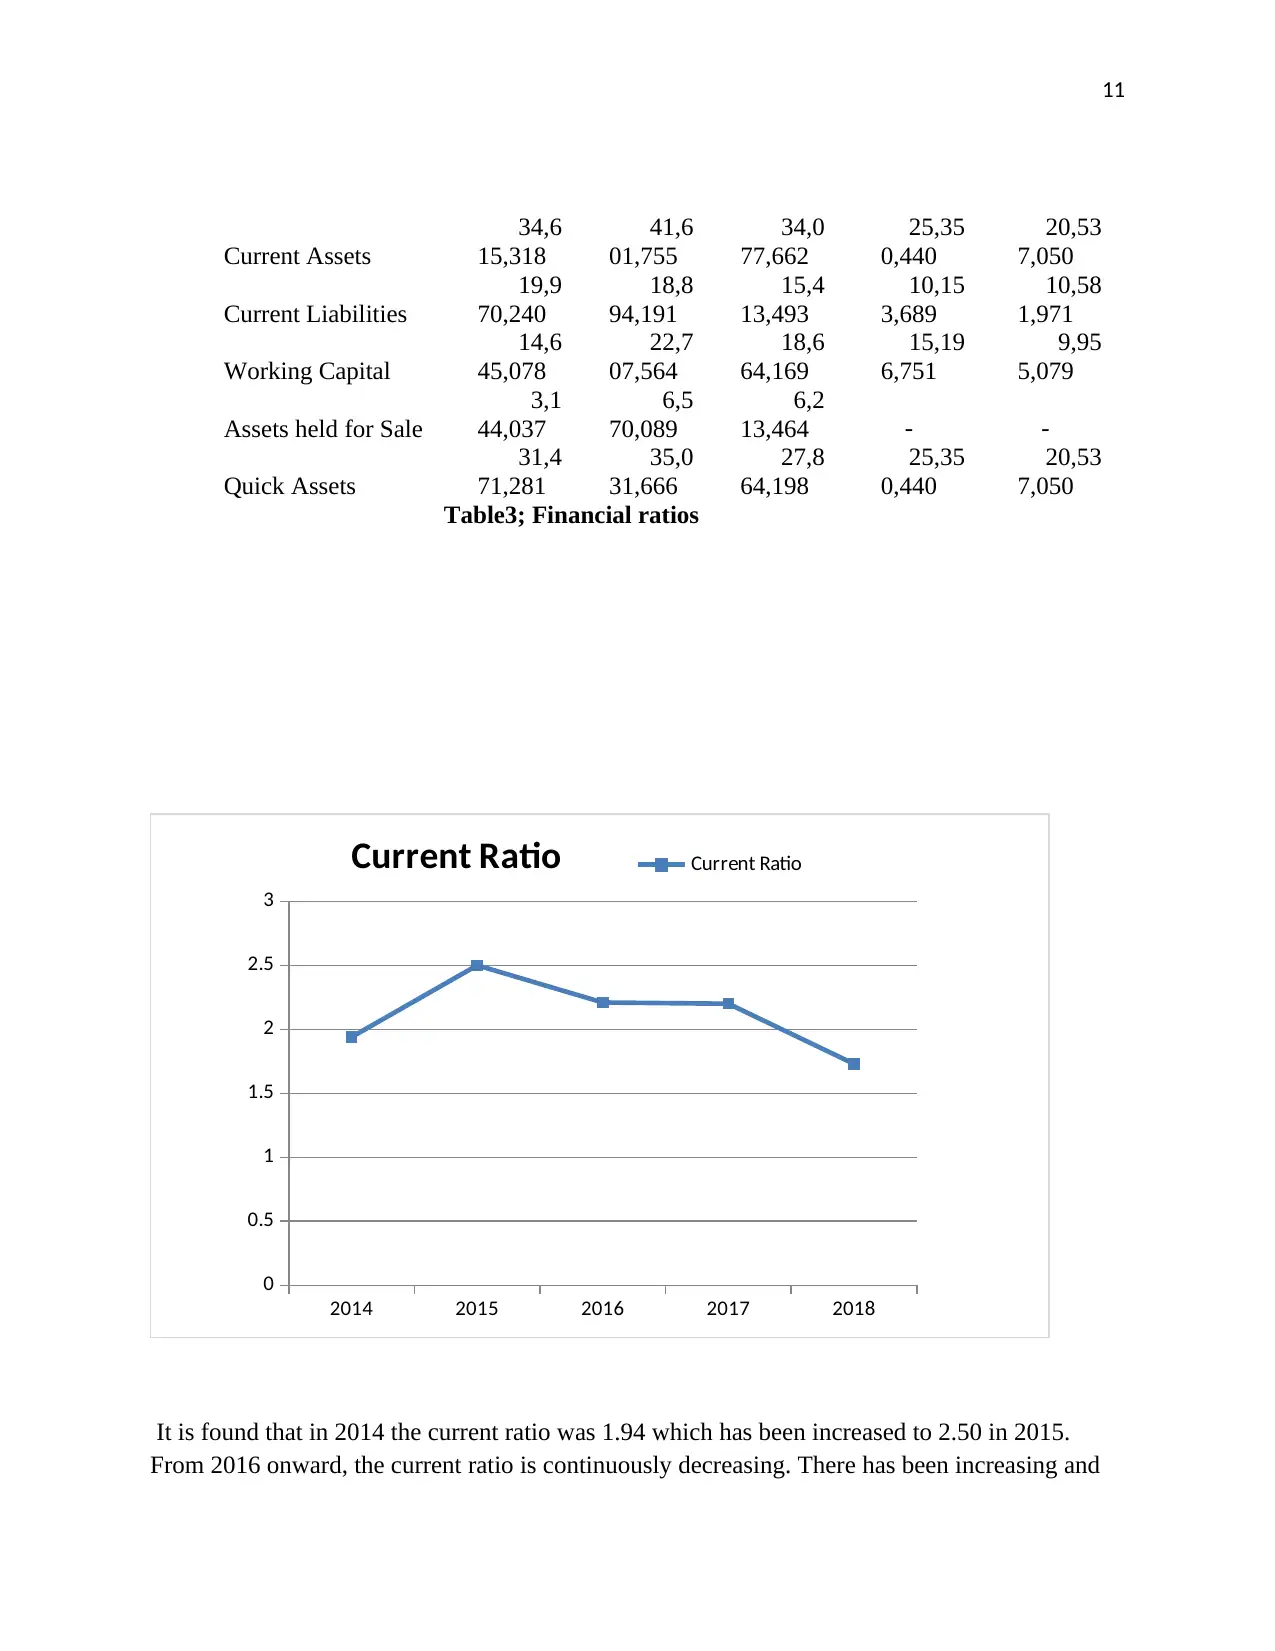
It is found that in 2014 the current ratio was 1.94 which has been increased to 2.50 in 2015.
From 2016 onward, the current ratio is continuously decreasing. There has been increasing and
Current Assets
34,6
15,318
41,6
01,755
34,0
77,662
25,35
0,440
20,53
7,050
Current Liabilities
19,9
70,240
18,8
94,191
15,4
13,493
10,15
3,689
10,58
1,971
Working Capital
14,6
45,078
22,7
07,564
18,6
64,169
15,19
6,751
9,95
5,079
Assets held for Sale
3,1
44,037
6,5
70,089
6,2
13,464 - -
Quick Assets
31,4
71,281
35,0
31,666
27,8
64,198
25,35
0,440
20,53
7,050
Table3; Financial ratios
2014 2015 2016 2017 2018
0
0.5
1
1.5
2
2.5
3
Current Ratio Current Ratio
It is found that in 2014 the current ratio was 1.94 which has been increased to 2.50 in 2015.
From 2016 onward, the current ratio is continuously decreasing. There has been increasing and
12
decreasing trend experienced in all these five years in the current ratios. Overall decrease in the
ratio from 2014 to 2018 is 10.69%. This increase or decrease in the current ratios implies that the
company ability to pay off its current obligations is also increasing and decreasing.
2018 2017 2016 2015 2014
0
0.5
1
1.5
2
2.5
3
Acid Test Ratio Acid Test Ratio
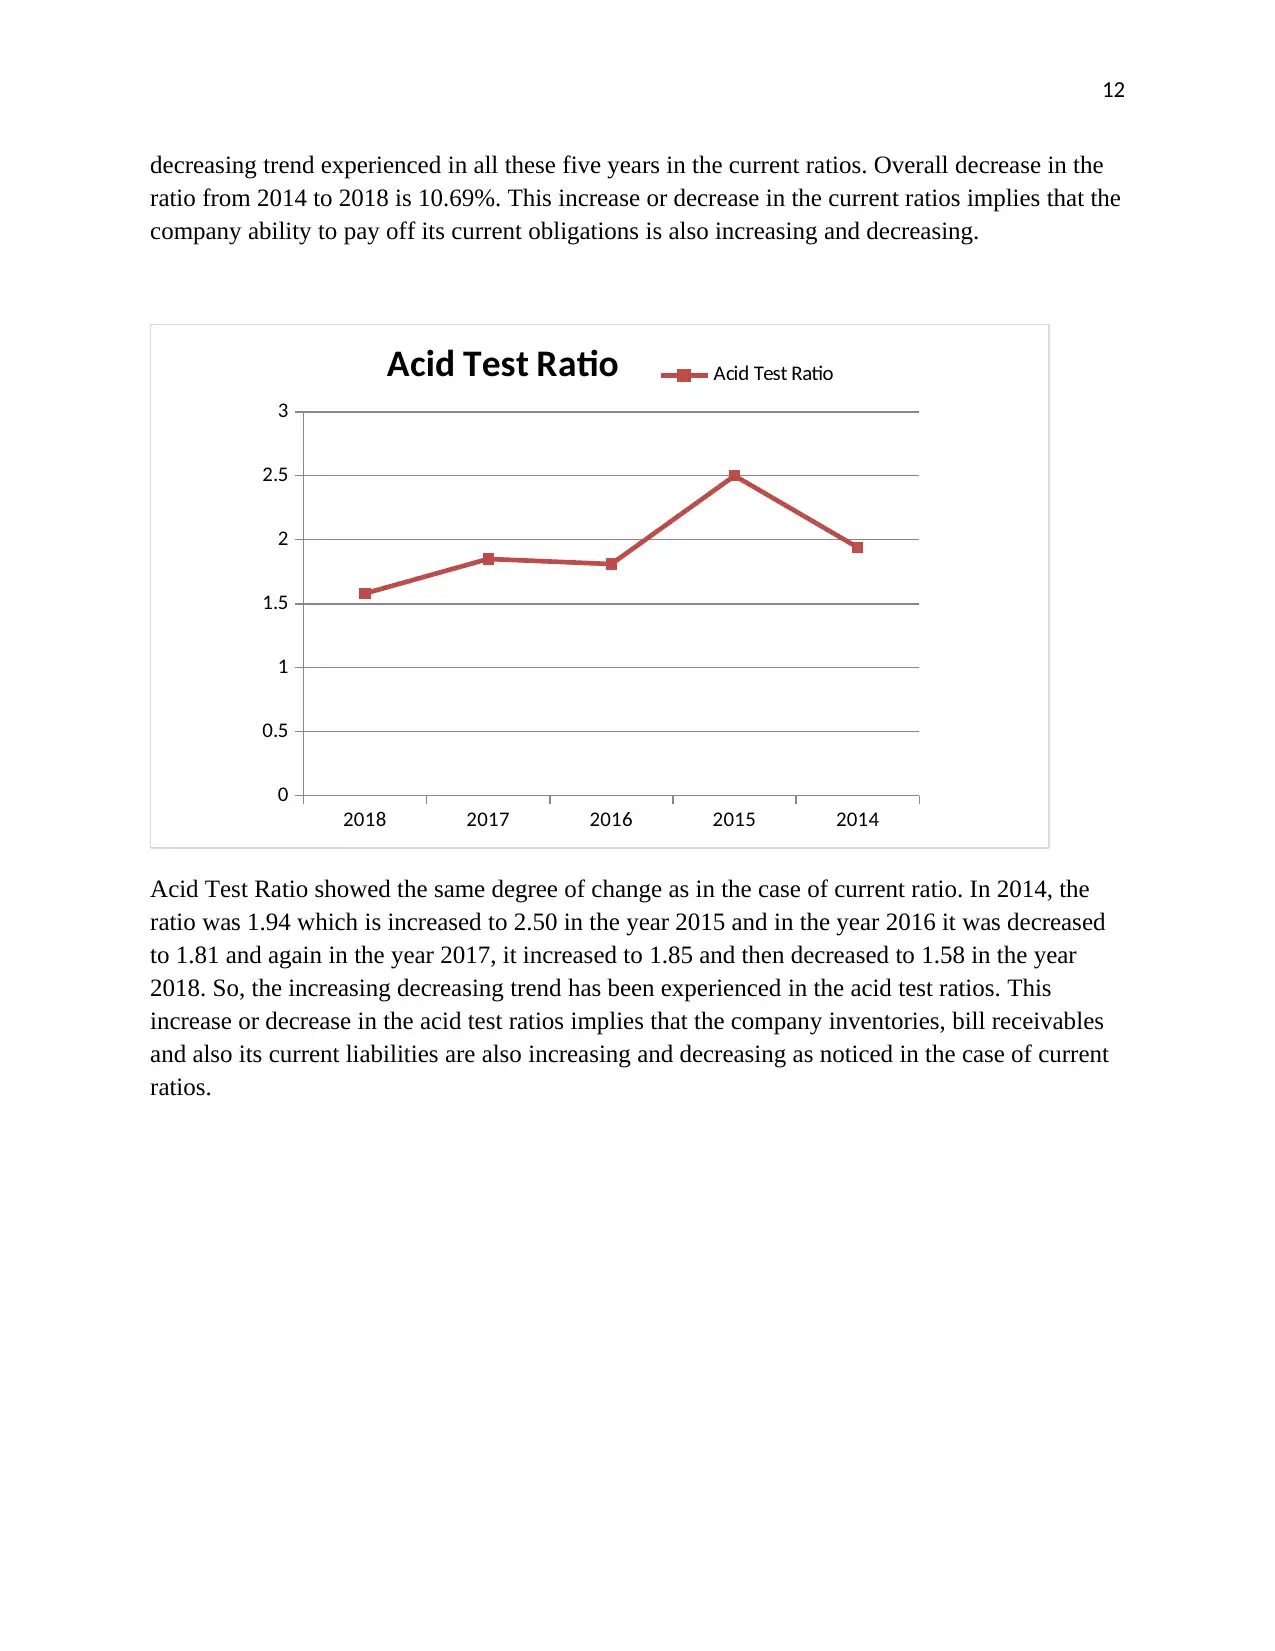
Acid Test Ratio showed the same degree of change as in the case of current ratio. In 2014, the
ratio was 1.94 which is increased to 2.50 in the year 2015 and in the year 2016 it was decreased
to 1.81 and again in the year 2017, it increased to 1.85 and then decreased to 1.58 in the year
2018. So, the increasing decreasing trend has been experienced in the acid test ratios. This
increase or decrease in the acid test ratios implies that the company inventories, bill receivables
and also its current liabilities are also increasing and decreasing as noticed in the case of current
ratios.
decreasing trend experienced in all these five years in the current ratios. Overall decrease in the
ratio from 2014 to 2018 is 10.69%. This increase or decrease in the current ratios implies that the
company ability to pay off its current obligations is also increasing and decreasing.
2018 2017 2016 2015 2014
0
0.5
1
1.5
2
2.5
3
Acid Test Ratio Acid Test Ratio
Acid Test Ratio showed the same degree of change as in the case of current ratio. In 2014, the
ratio was 1.94 which is increased to 2.50 in the year 2015 and in the year 2016 it was decreased
to 1.81 and again in the year 2017, it increased to 1.85 and then decreased to 1.58 in the year
2018. So, the increasing decreasing trend has been experienced in the acid test ratios. This
increase or decrease in the acid test ratios implies that the company inventories, bill receivables
and also its current liabilities are also increasing and decreasing as noticed in the case of current
ratios.
⊘ This is a preview!⊘
Do you want full access?
Subscribe today to unlock all pages.
Trusted by 1+ million students worldwide
1 out of 16
Related Documents


Your All-in-One AI-Powered Toolkit for Academic Success.
+13062052269
info@desklib.com
Available 24*7 on WhatsApp / Email
![[object Object]](/_next/static/media/star-bottom.7253800d.svg)
Unlock your academic potential
Copyright © 2020–2026 A2Z Services. All Rights Reserved. Developed and managed by ZUCOL.