EAUS219 Financial Services Assignment: Emaar Properties Analysis
VerifiedAdded on 2022/09/14
|19
|4274
|14
Homework Assignment
AI Summary
This assignment analyzes the financial performance of Emaar Properties PJSC and its subsidiaries, based on provided consolidated financial statements from 2015 to 2019. Task 1 involves drawing balance sheets and income statements, calculating and commenting on net working capital, and analyzing the debt-equity ratio to advise on whether to invest in the company. The analysis reveals the company's financial health, highlighting aspects like revenue, profit, and EPS trends. Task 2 explores active and passive investment funds, providing examples in the UAE market and discussing the pros and cons of investing in bonds, equity shares (common and preferred stock), and derivatives. The assignment covers various investment instruments, including bonds, stocks, and derivatives, and assesses their potential benefits and risks. The analysis concludes with an investment recommendation based on the financial data and market insights.
Financial services
Paraphrase This Document
Need a fresh take? Get an instant paraphrase of this document with our AI Paraphraser
Task 1 - LO2
a)
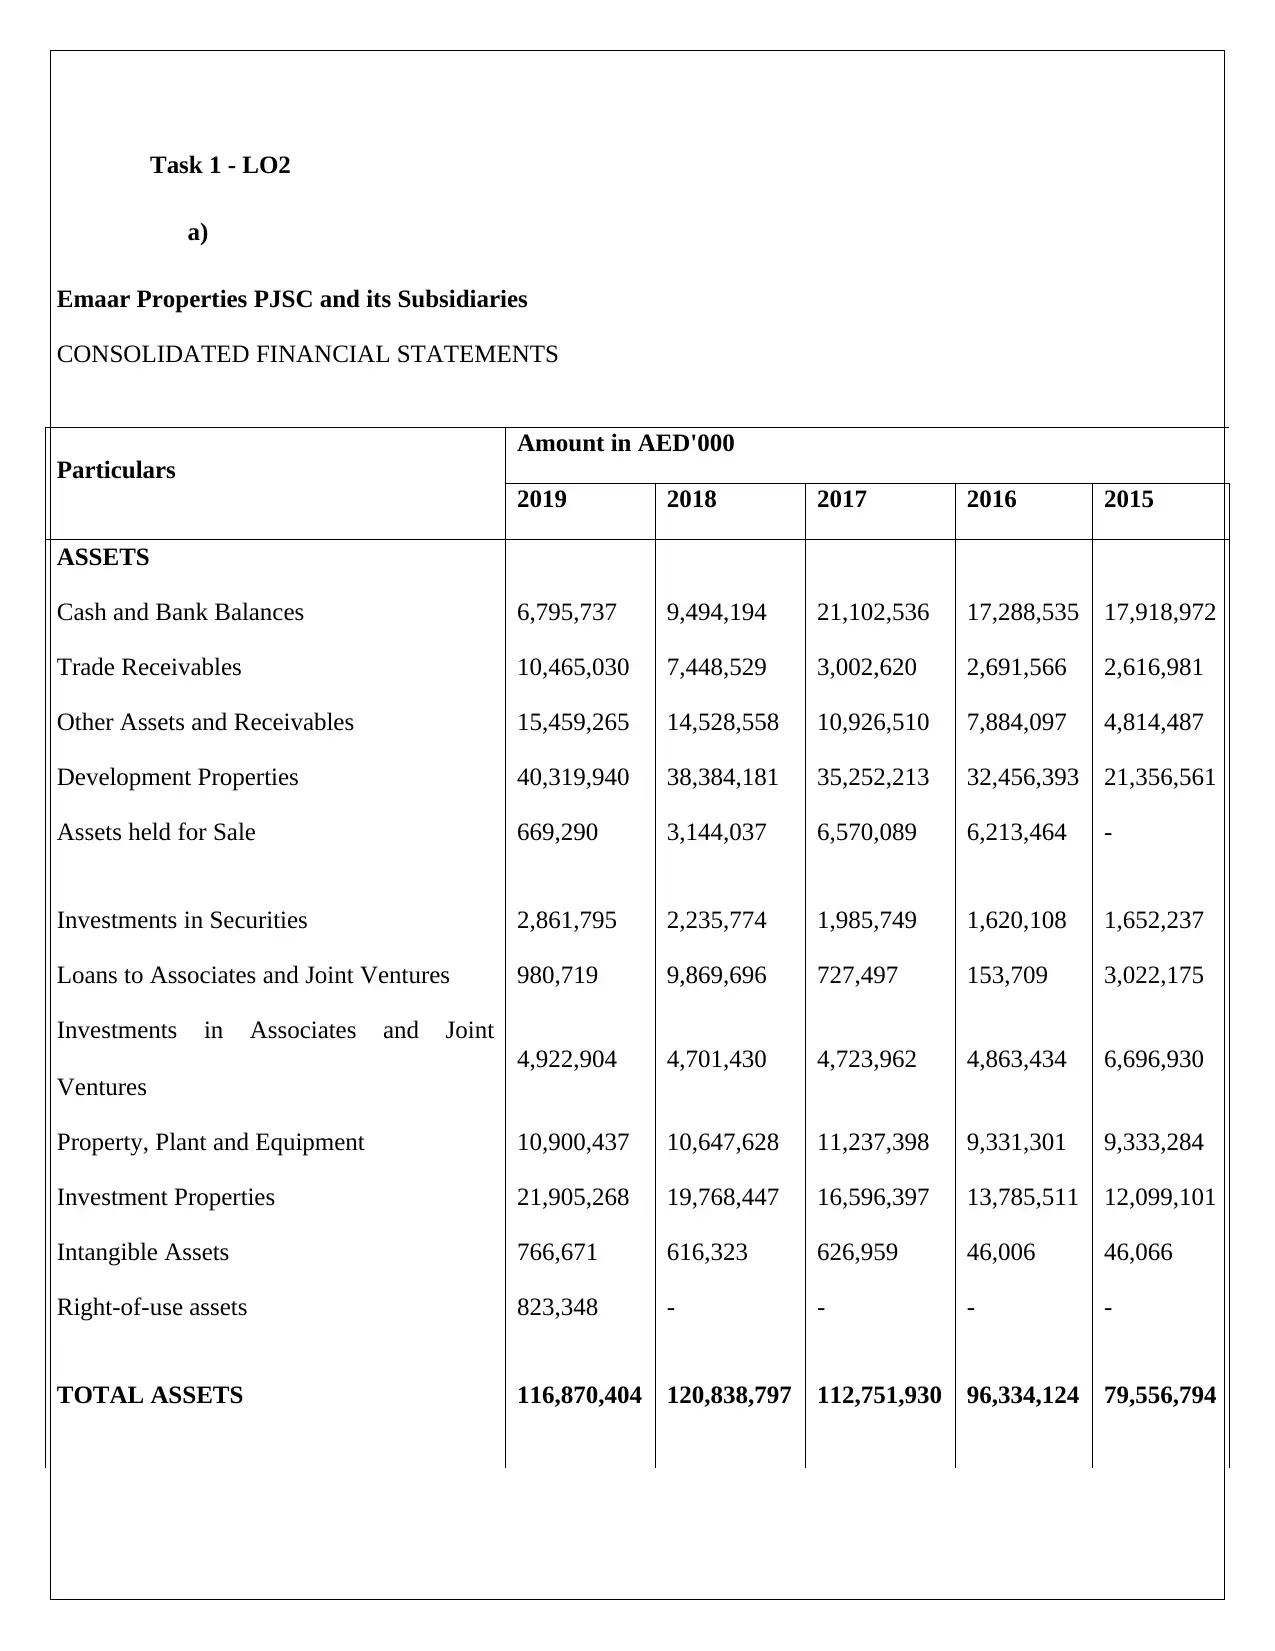
Emaar Properties PJSC and its Subsidiaries
CONSOLIDATED FINANCIAL STATEMENTS
Particulars
Amount in AED'000
2019 2018 2017 2016 2015
ASSETS
Cash and Bank Balances 6,795,737 9,494,194 21,102,536 17,288,535 17,918,972
Trade Receivables 10,465,030 7,448,529 3,002,620 2,691,566 2,616,981
Other Assets and Receivables 15,459,265 14,528,558 10,926,510 7,884,097 4,814,487
Development Properties 40,319,940 38,384,181 35,252,213 32,456,393 21,356,561
Assets held for Sale 669,290 3,144,037 6,570,089 6,213,464 -
Investments in Securities 2,861,795 2,235,774 1,985,749 1,620,108 1,652,237
Loans to Associates and Joint Ventures 980,719 9,869,696 727,497 153,709 3,022,175
Investments in Associates and Joint
Ventures
4,922,904 4,701,430 4,723,962 4,863,434 6,696,930
Property, Plant and Equipment 10,900,437 10,647,628 11,237,398 9,331,301 9,333,284
Investment Properties 21,905,268 19,768,447 16,596,397 13,785,511 12,099,101
Intangible Assets 766,671 616,323 626,959 46,006 46,066
Right-of-use assets 823,348 - - - -
TOTAL ASSETS 116,870,404 120,838,797 112,751,930 96,334,124 79,556,794
a)
Emaar Properties PJSC and its Subsidiaries
CONSOLIDATED FINANCIAL STATEMENTS
Particulars
Amount in AED'000
2019 2018 2017 2016 2015
ASSETS
Cash and Bank Balances 6,795,737 9,494,194 21,102,536 17,288,535 17,918,972
Trade Receivables 10,465,030 7,448,529 3,002,620 2,691,566 2,616,981
Other Assets and Receivables 15,459,265 14,528,558 10,926,510 7,884,097 4,814,487
Development Properties 40,319,940 38,384,181 35,252,213 32,456,393 21,356,561
Assets held for Sale 669,290 3,144,037 6,570,089 6,213,464 -
Investments in Securities 2,861,795 2,235,774 1,985,749 1,620,108 1,652,237
Loans to Associates and Joint Ventures 980,719 9,869,696 727,497 153,709 3,022,175
Investments in Associates and Joint
Ventures
4,922,904 4,701,430 4,723,962 4,863,434 6,696,930
Property, Plant and Equipment 10,900,437 10,647,628 11,237,398 9,331,301 9,333,284
Investment Properties 21,905,268 19,768,447 16,596,397 13,785,511 12,099,101
Intangible Assets 766,671 616,323 626,959 46,006 46,066
Right-of-use assets 823,348 - - - -
TOTAL ASSETS 116,870,404 120,838,797 112,751,930 96,334,124 79,556,794
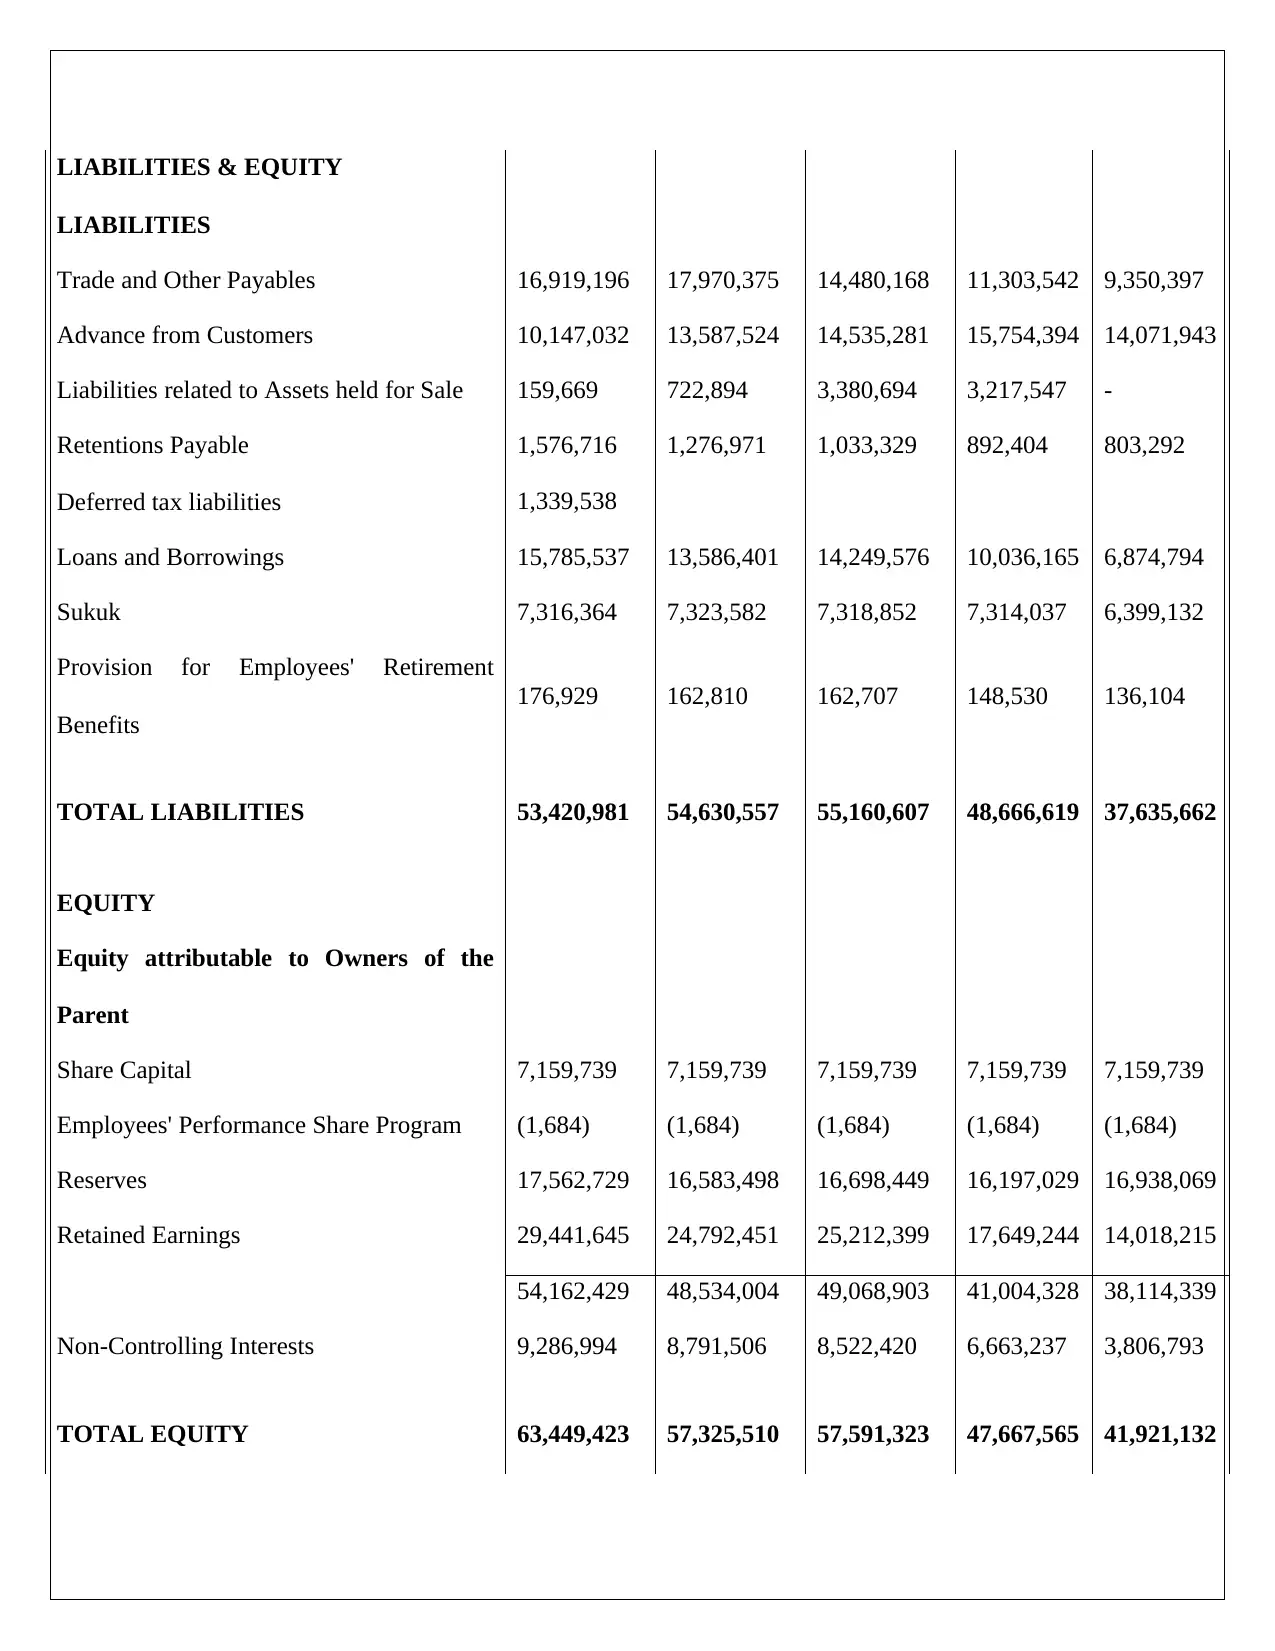
LIABILITIES & EQUITY
LIABILITIES
Trade and Other Payables 16,919,196 17,970,375 14,480,168 11,303,542 9,350,397
Advance from Customers 10,147,032 13,587,524 14,535,281 15,754,394 14,071,943
Liabilities related to Assets held for Sale 159,669 722,894 3,380,694 3,217,547 -
Retentions Payable 1,576,716 1,276,971 1,033,329 892,404 803,292
Deferred tax liabilities 1,339,538
Loans and Borrowings 15,785,537 13,586,401 14,249,576 10,036,165 6,874,794
Sukuk 7,316,364 7,323,582 7,318,852 7,314,037 6,399,132
Provision for Employees' Retirement
Benefits
176,929 162,810 162,707 148,530 136,104
TOTAL LIABILITIES 53,420,981 54,630,557 55,160,607 48,666,619 37,635,662
EQUITY
Equity attributable to Owners of the
Parent
Share Capital 7,159,739 7,159,739 7,159,739 7,159,739 7,159,739
Employees' Performance Share Program (1,684) (1,684) (1,684) (1,684) (1,684)
Reserves 17,562,729 16,583,498 16,698,449 16,197,029 16,938,069
Retained Earnings 29,441,645 24,792,451 25,212,399 17,649,244 14,018,215
54,162,429 48,534,004 49,068,903 41,004,328 38,114,339
Non-Controlling Interests 9,286,994 8,791,506 8,522,420 6,663,237 3,806,793
TOTAL EQUITY 63,449,423 57,325,510 57,591,323 47,667,565 41,921,132
⊘ This is a preview!⊘
Do you want full access?
Subscribe today to unlock all pages.
Trusted by 1+ million students worldwide
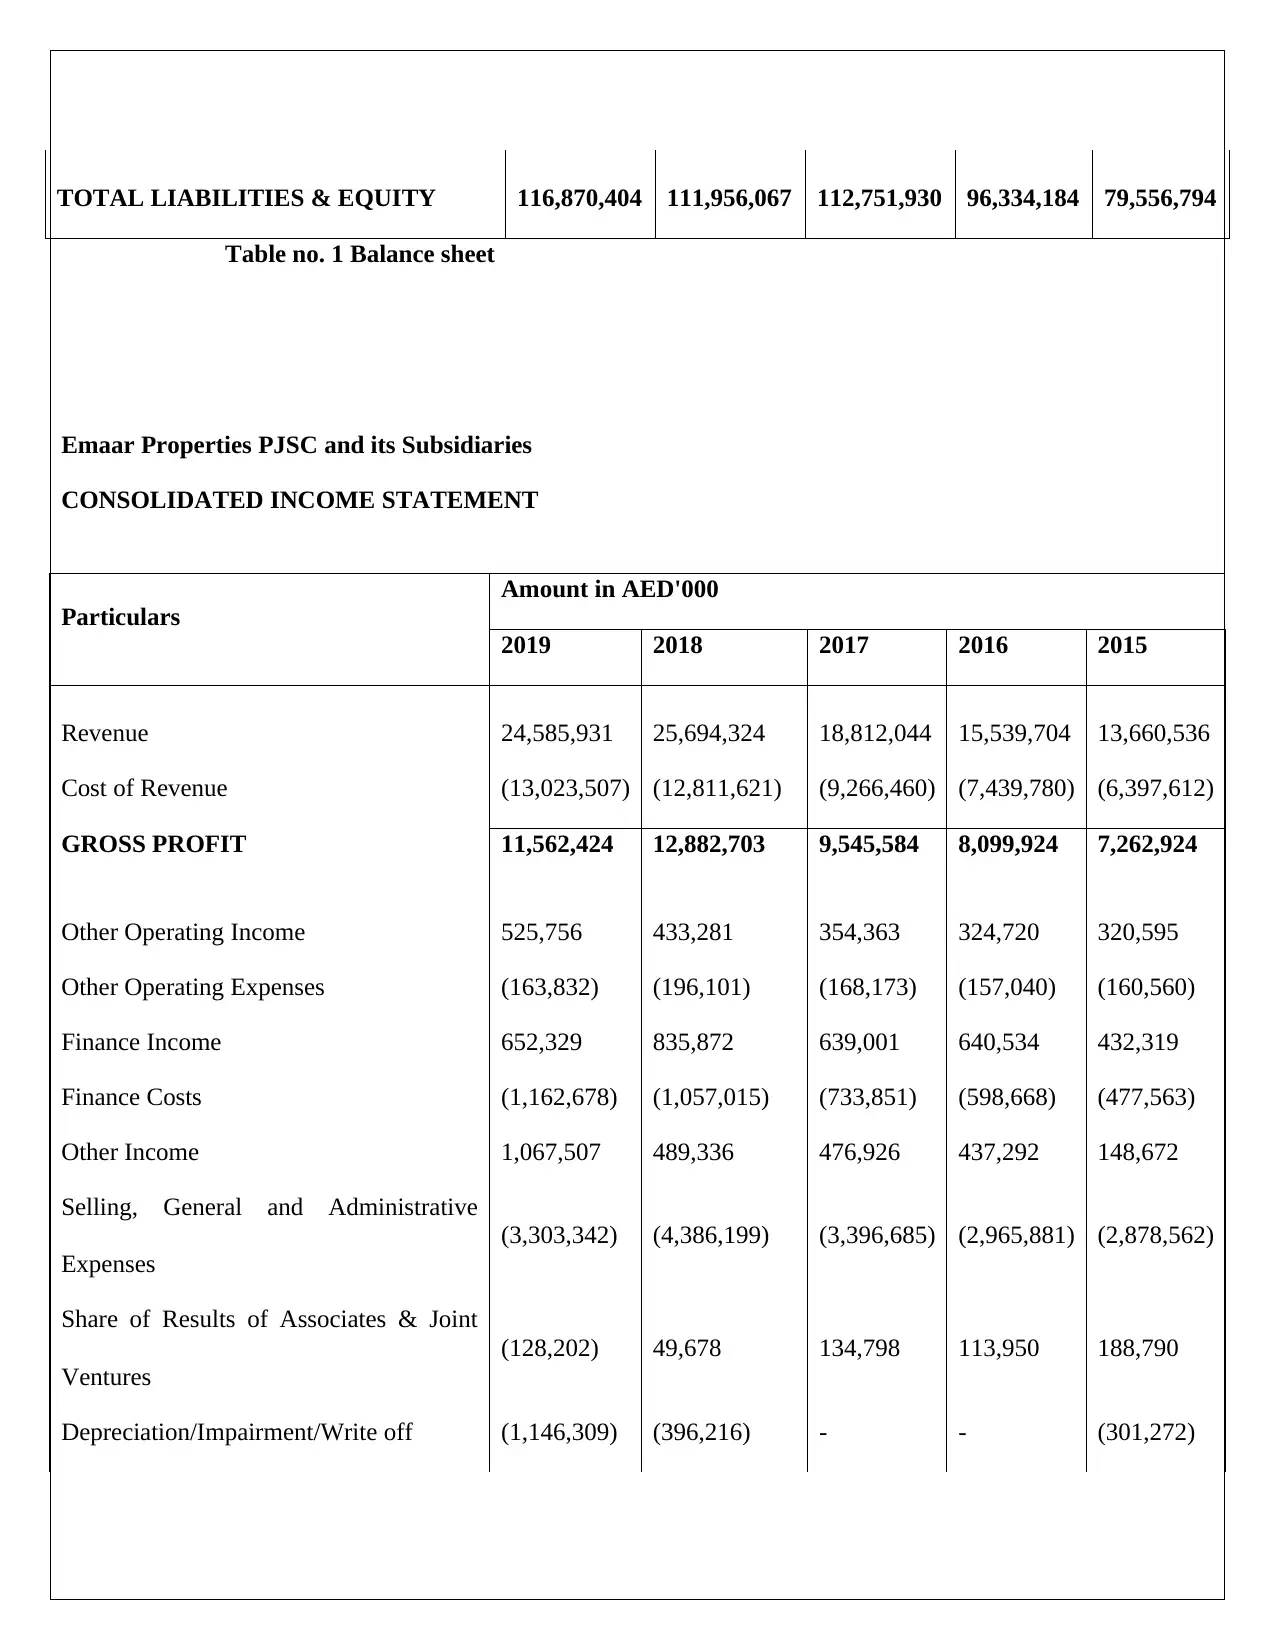
TOTAL LIABILITIES & EQUITY 116,870,404 111,956,067 112,751,930 96,334,184 79,556,794
Table no. 1 Balance sheet
Emaar Properties PJSC and its Subsidiaries
CONSOLIDATED INCOME STATEMENT
Particulars
Amount in AED'000
2019 2018 2017 2016 2015
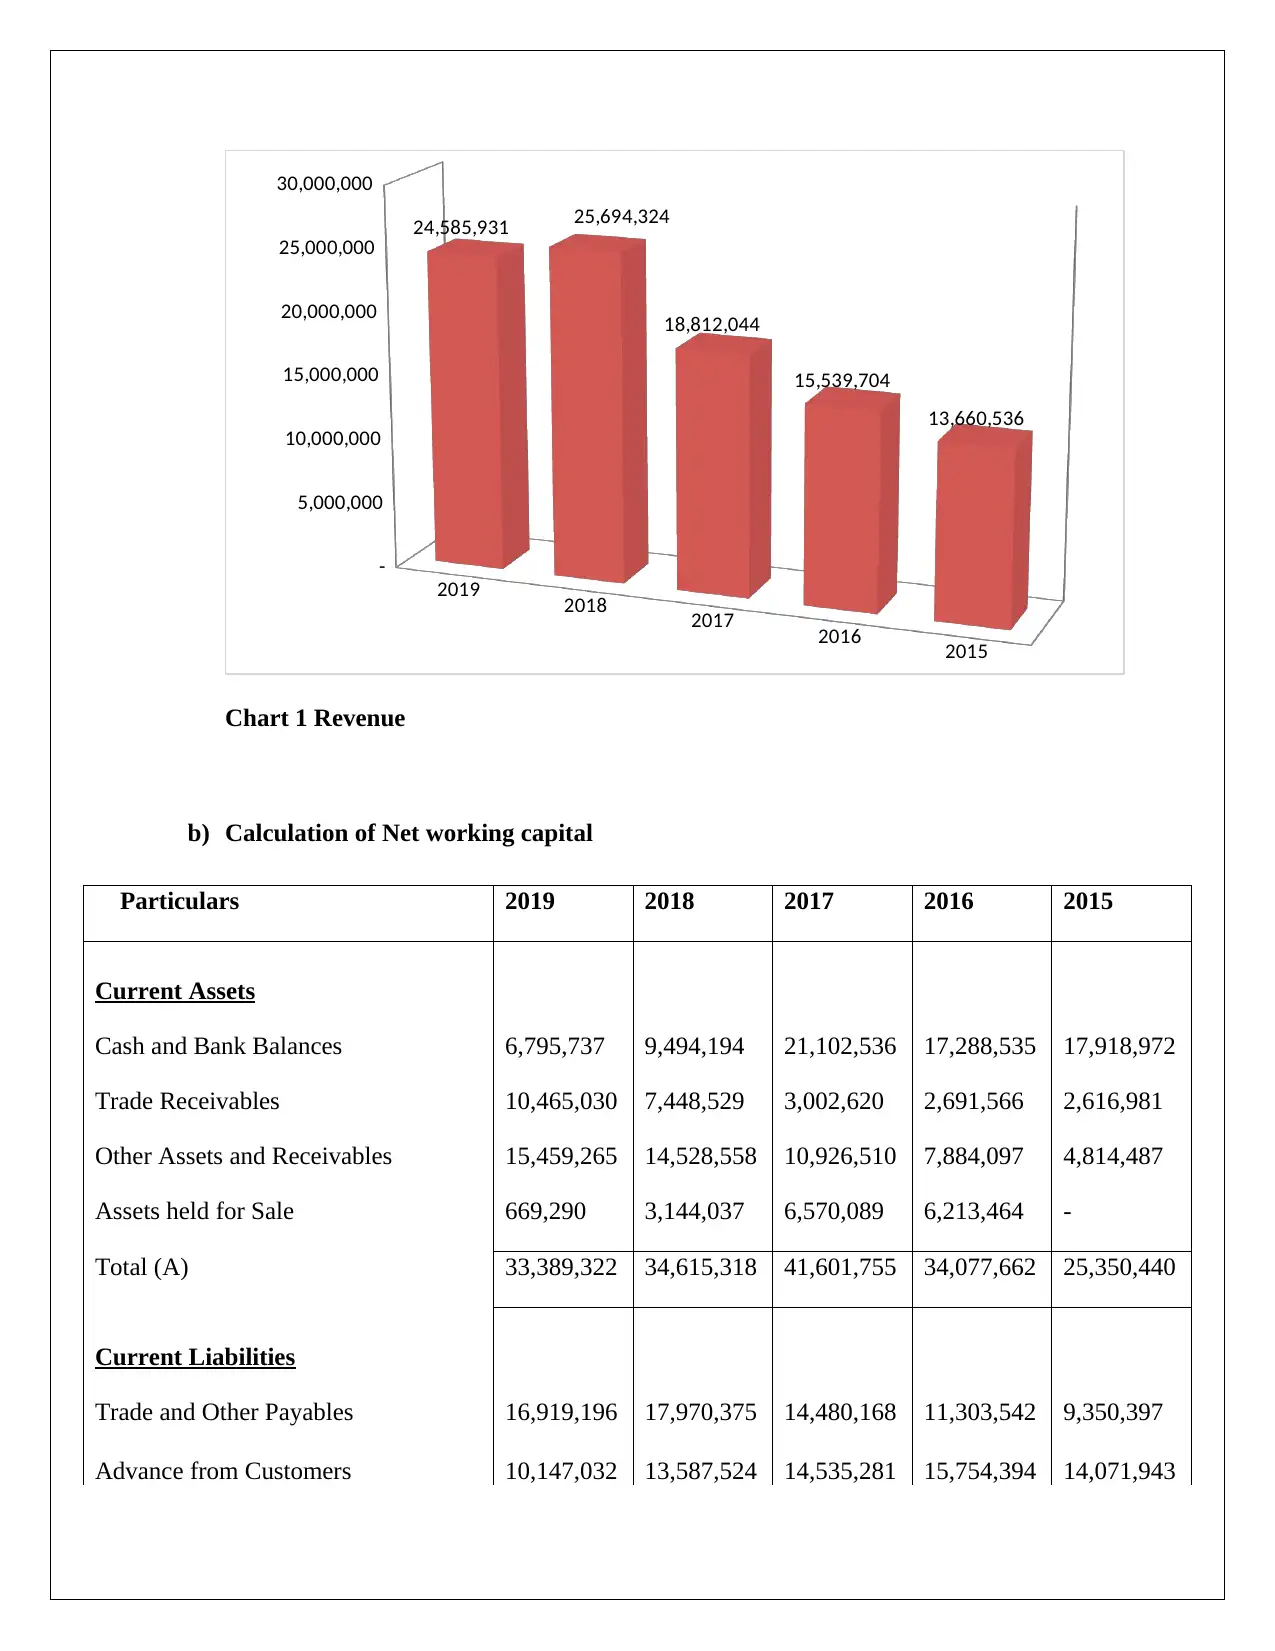
Revenue 24,585,931 25,694,324 18,812,044 15,539,704 13,660,536
Cost of Revenue (13,023,507) (12,811,621) (9,266,460) (7,439,780) (6,397,612)
GROSS PROFIT 11,562,424 12,882,703 9,545,584 8,099,924 7,262,924
Other Operating Income 525,756 433,281 354,363 324,720 320,595
Other Operating Expenses (163,832) (196,101) (168,173) (157,040) (160,560)
Finance Income 652,329 835,872 639,001 640,534 432,319
Finance Costs (1,162,678) (1,057,015) (733,851) (598,668) (477,563)
Other Income 1,067,507 489,336 476,926 437,292 148,672
Selling, General and Administrative
Expenses
(3,303,342) (4,386,199) (3,396,685) (2,965,881) (2,878,562)
Share of Results of Associates & Joint
Ventures
(128,202) 49,678 134,798 113,950 188,790
Depreciation/Impairment/Write off (1,146,309) (396,216) - - (301,272)
Table no. 1 Balance sheet
Emaar Properties PJSC and its Subsidiaries
CONSOLIDATED INCOME STATEMENT
Particulars
Amount in AED'000
2019 2018 2017 2016 2015
Revenue 24,585,931 25,694,324 18,812,044 15,539,704 13,660,536
Cost of Revenue (13,023,507) (12,811,621) (9,266,460) (7,439,780) (6,397,612)
GROSS PROFIT 11,562,424 12,882,703 9,545,584 8,099,924 7,262,924
Other Operating Income 525,756 433,281 354,363 324,720 320,595
Other Operating Expenses (163,832) (196,101) (168,173) (157,040) (160,560)
Finance Income 652,329 835,872 639,001 640,534 432,319
Finance Costs (1,162,678) (1,057,015) (733,851) (598,668) (477,563)
Other Income 1,067,507 489,336 476,926 437,292 148,672
Selling, General and Administrative
Expenses
(3,303,342) (4,386,199) (3,396,685) (2,965,881) (2,878,562)
Share of Results of Associates & Joint
Ventures
(128,202) 49,678 134,798 113,950 188,790
Depreciation/Impairment/Write off (1,146,309) (396,216) - - (301,272)
Paraphrase This Document
Need a fresh take? Get an instant paraphrase of this document with our AI Paraphraser
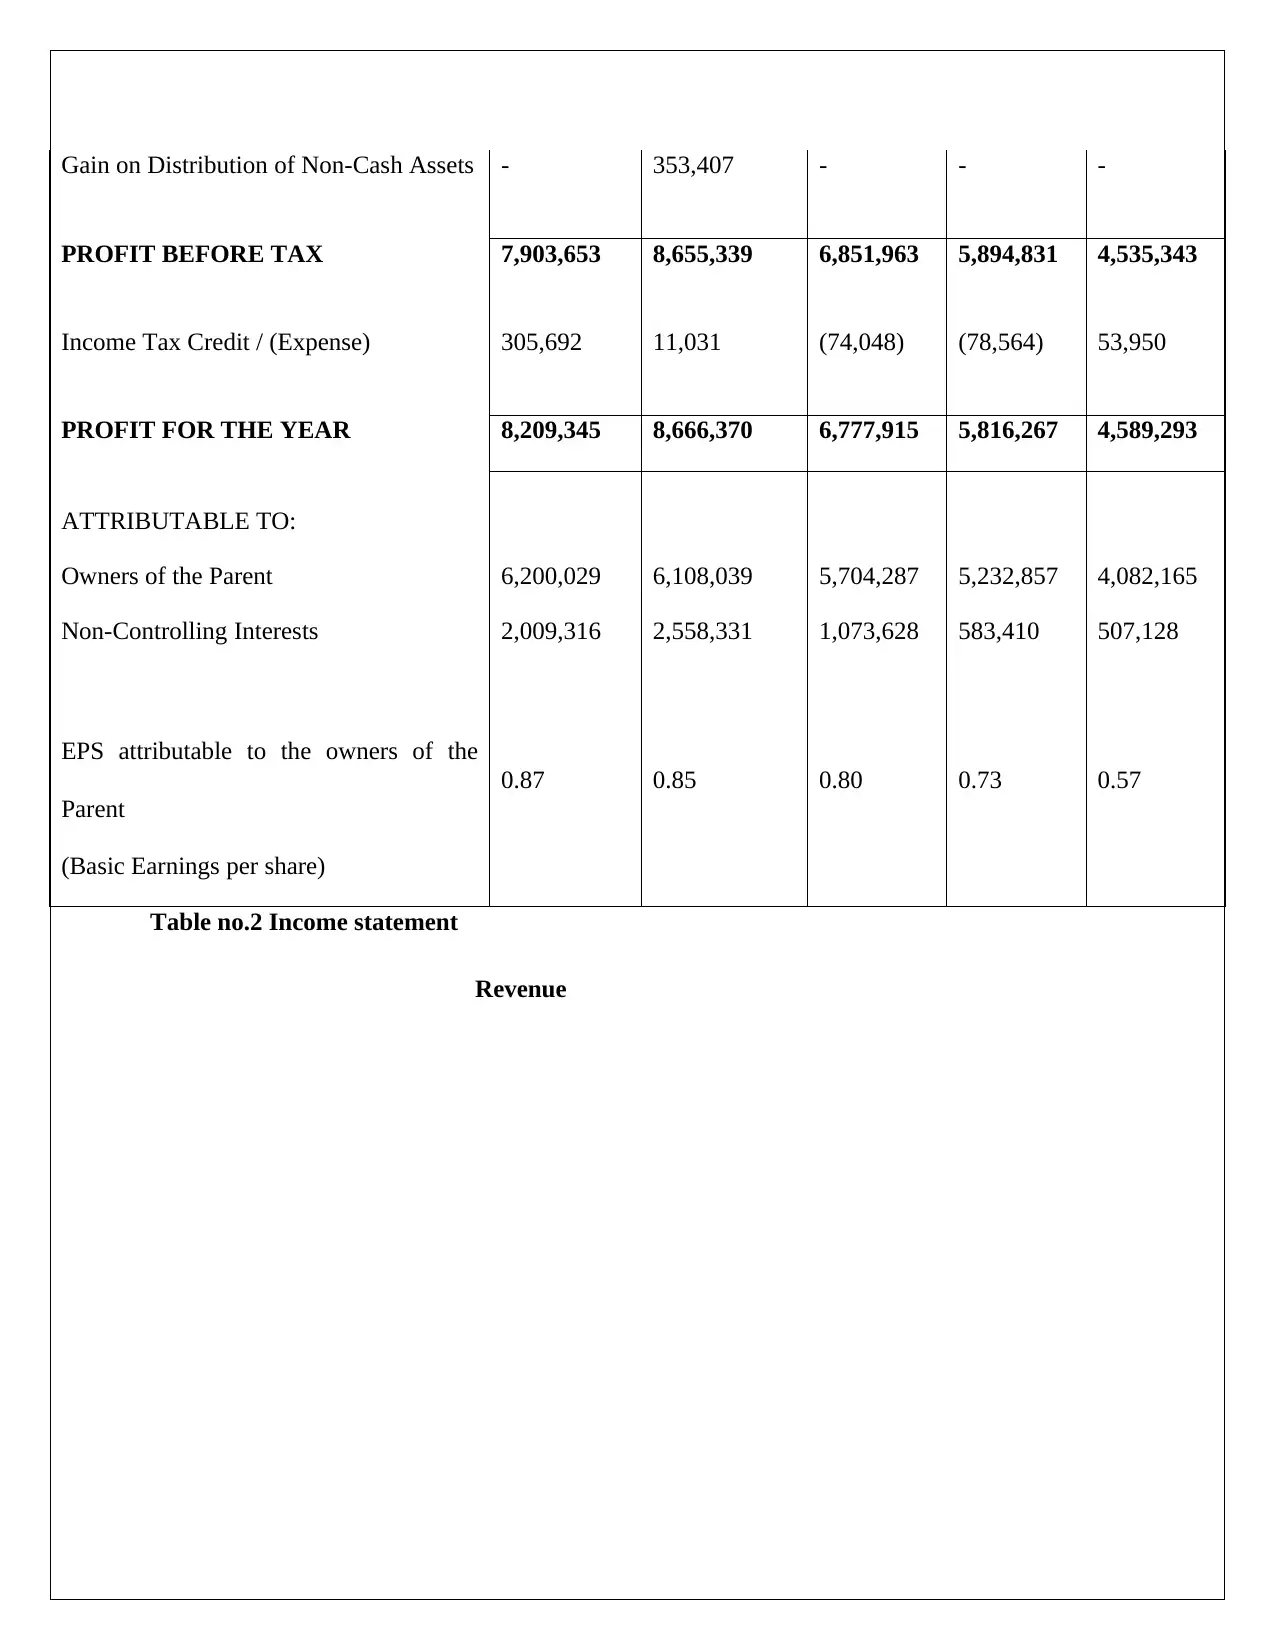
Gain on Distribution of Non-Cash Assets - 353,407 - - -
PROFIT BEFORE TAX 7,903,653 8,655,339 6,851,963 5,894,831 4,535,343
Income Tax Credit / (Expense) 305,692 11,031 (74,048) (78,564) 53,950
PROFIT FOR THE YEAR 8,209,345 8,666,370 6,777,915 5,816,267 4,589,293
ATTRIBUTABLE TO:
Owners of the Parent 6,200,029 6,108,039 5,704,287 5,232,857 4,082,165
Non-Controlling Interests 2,009,316 2,558,331 1,073,628 583,410 507,128
EPS attributable to the owners of the
Parent
0.87 0.85 0.80 0.73 0.57
(Basic Earnings per share)
Table no.2 Income statement
Revenue
2019 2018 2017 2016 2015
-
5,000,000
10,000,000
15,000,000
20,000,000
25,000,000
30,000,000
24,585,931 25,694,324
18,812,044
15,539,704
13,660,536
Chart 1 Revenue
b) Calculation of Net working capital
Particulars 2019 2018 2017 2016 2015
Current Assets
Cash and Bank Balances 6,795,737 9,494,194 21,102,536 17,288,535 17,918,972
Trade Receivables 10,465,030 7,448,529 3,002,620 2,691,566 2,616,981
Other Assets and Receivables 15,459,265 14,528,558 10,926,510 7,884,097 4,814,487
Assets held for Sale 669,290 3,144,037 6,570,089 6,213,464 -
Total (A) 33,389,322 34,615,318 41,601,755 34,077,662 25,350,440
Current Liabilities
Trade and Other Payables 16,919,196 17,970,375 14,480,168 11,303,542 9,350,397
Advance from Customers 10,147,032 13,587,524 14,535,281 15,754,394 14,071,943
⊘ This is a preview!⊘
Do you want full access?
Subscribe today to unlock all pages.
Trusted by 1+ million students worldwide
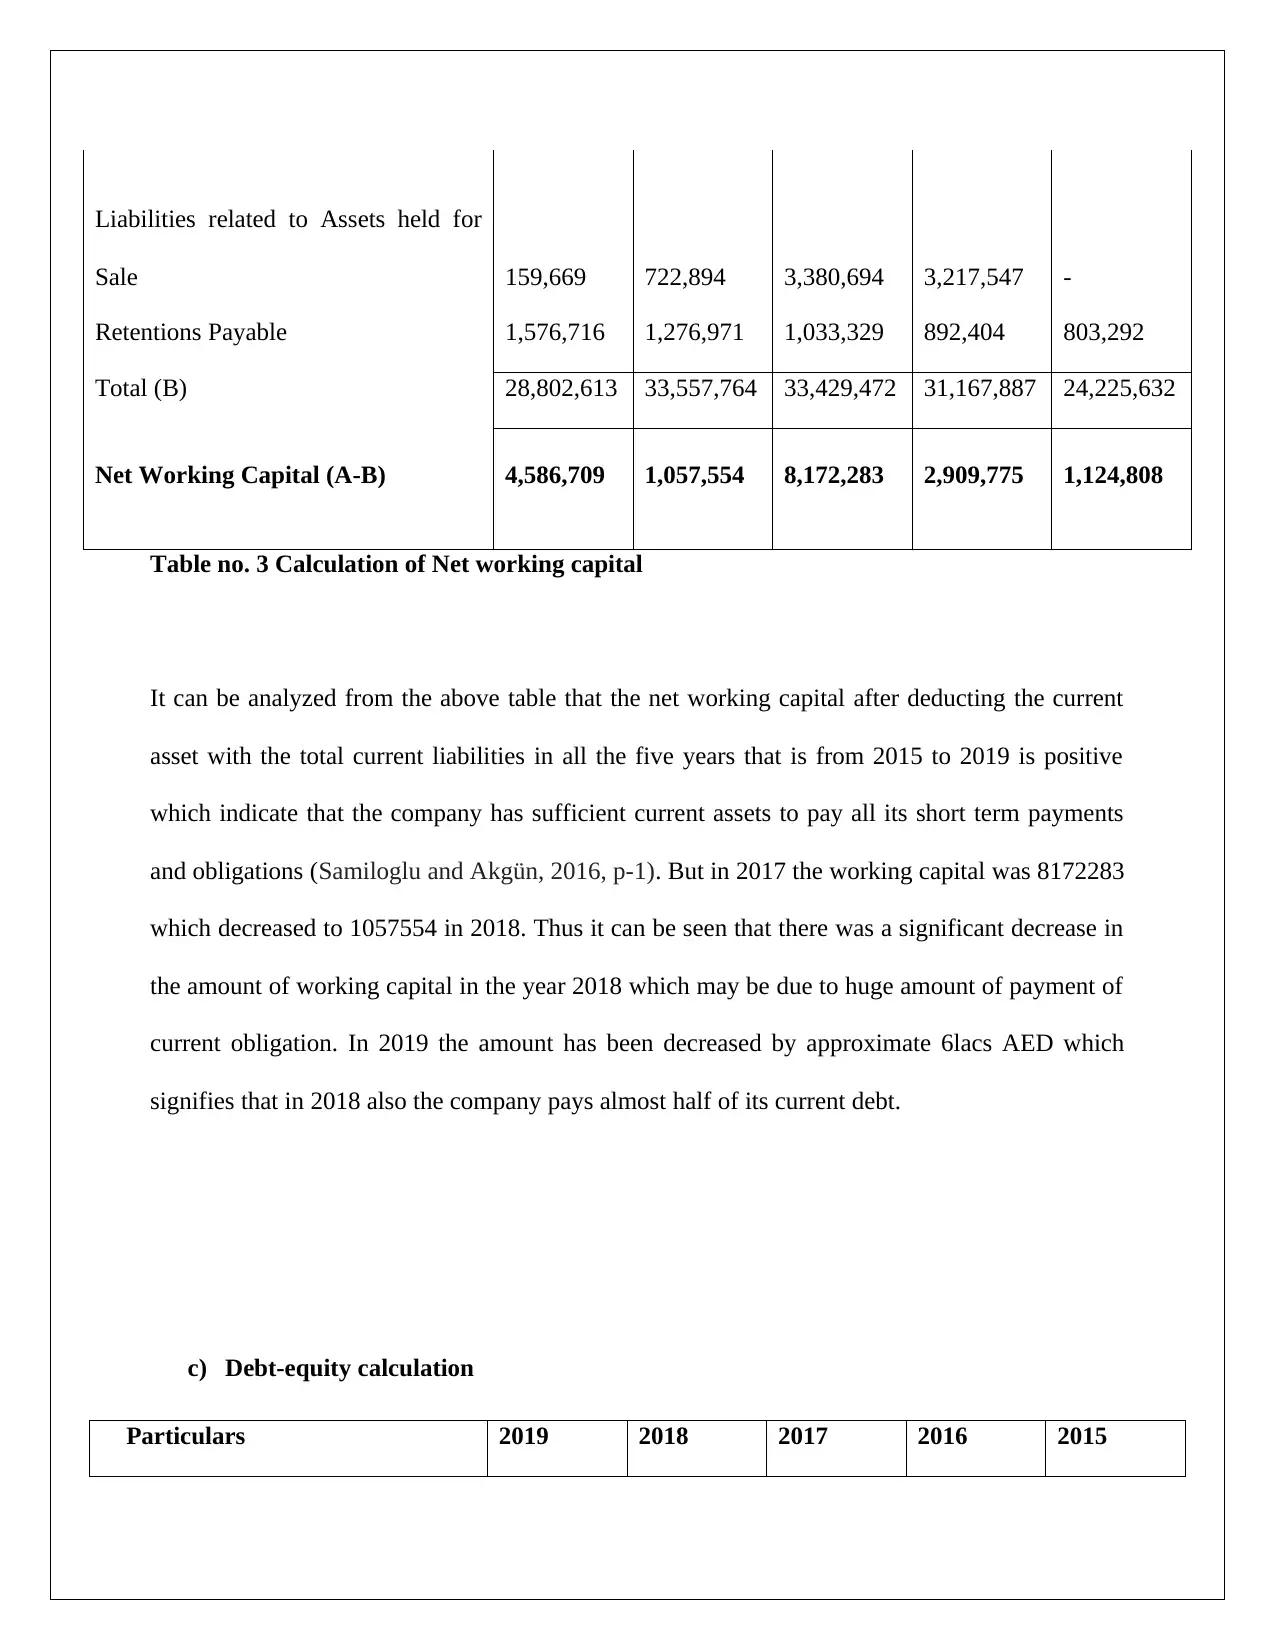
Liabilities related to Assets held for
Sale 159,669 722,894 3,380,694 3,217,547 -
Retentions Payable 1,576,716 1,276,971 1,033,329 892,404 803,292
Total (B) 28,802,613 33,557,764 33,429,472 31,167,887 24,225,632
Net Working Capital (A-B) 4,586,709 1,057,554 8,172,283 2,909,775 1,124,808
Table no. 3 Calculation of Net working capital
It can be analyzed from the above table that the net working capital after deducting the current
asset with the total current liabilities in all the five years that is from 2015 to 2019 is positive
which indicate that the company has sufficient current assets to pay all its short term payments
and obligations (Samiloglu and Akgün, 2016, p-1). But in 2017 the working capital was 8172283
which decreased to 1057554 in 2018. Thus it can be seen that there was a significant decrease in
the amount of working capital in the year 2018 which may be due to huge amount of payment of
current obligation. In 2019 the amount has been decreased by approximate 6lacs AED which
signifies that in 2018 also the company pays almost half of its current debt.
c) Debt-equity calculation
Particulars 2019 2018 2017 2016 2015
Paraphrase This Document
Need a fresh take? Get an instant paraphrase of this document with our AI Paraphraser
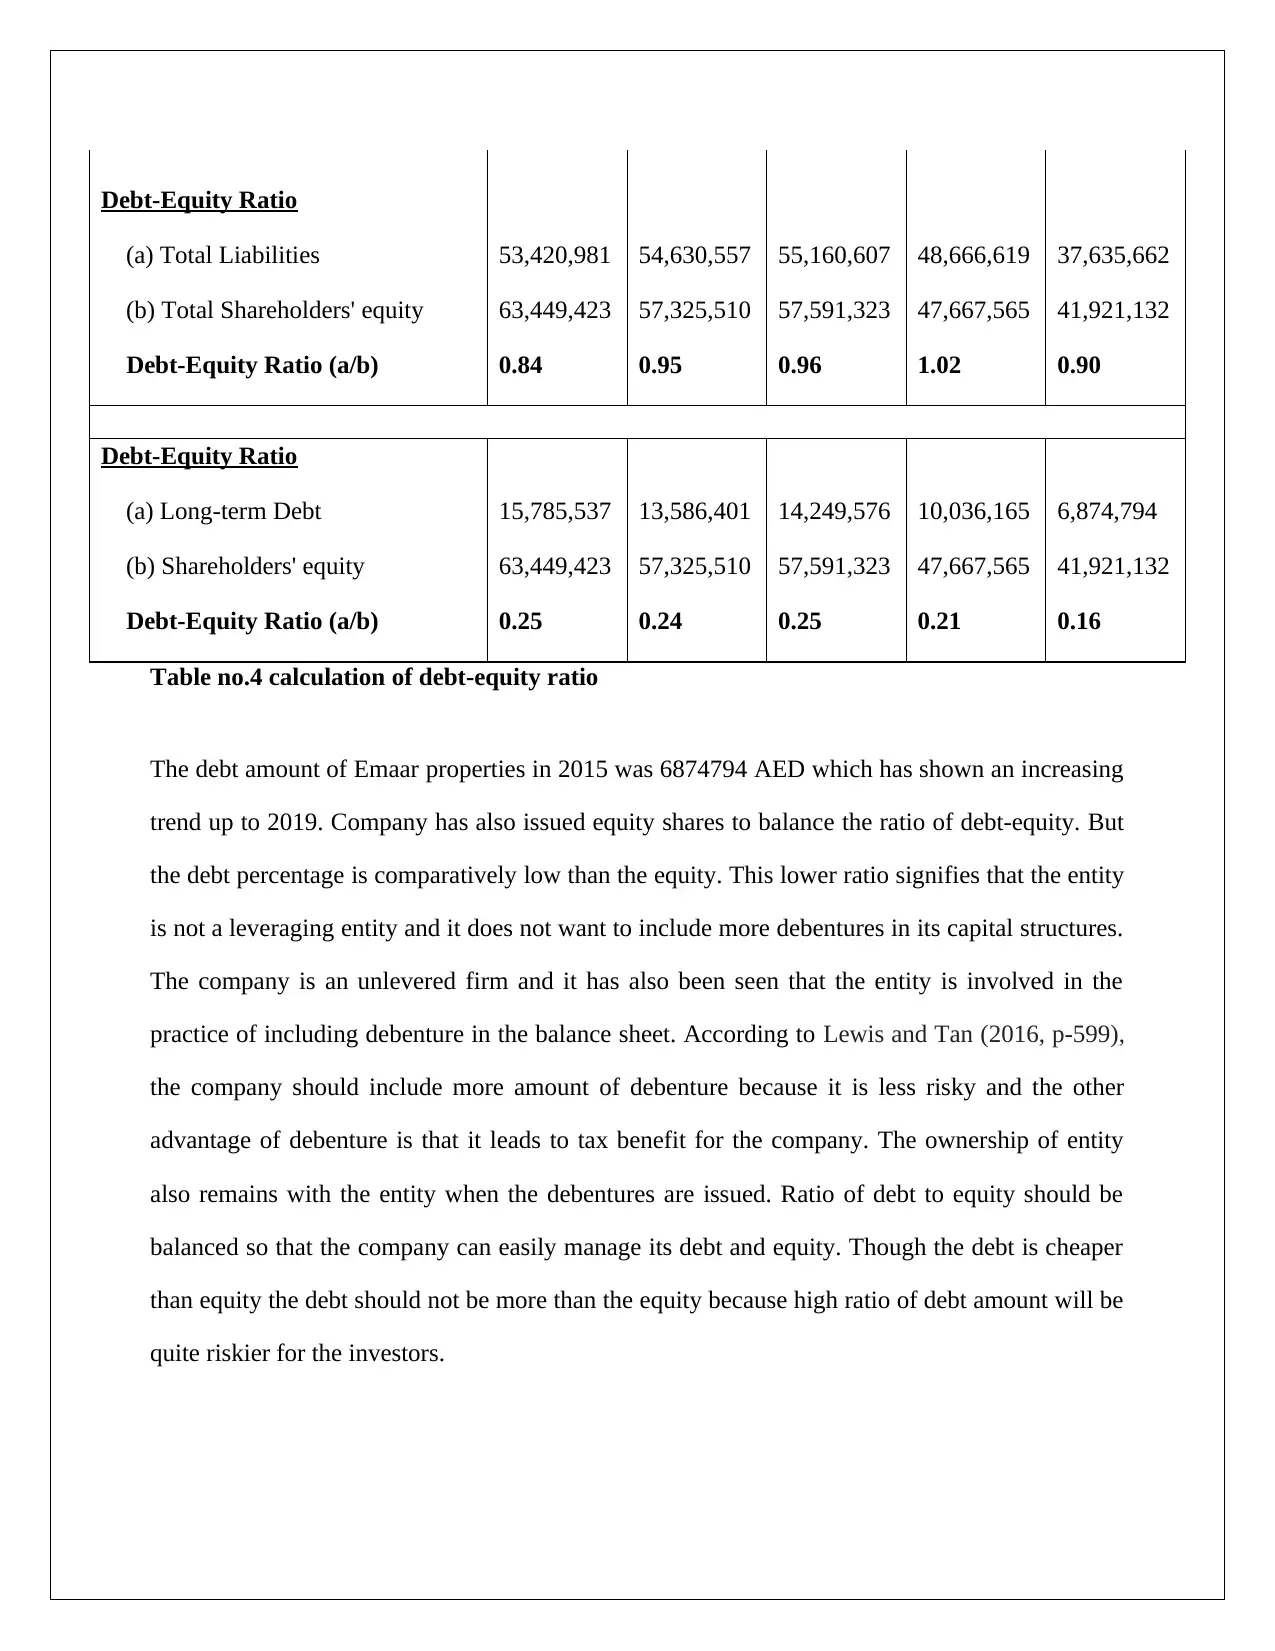
Debt-Equity Ratio
(a) Total Liabilities 53,420,981 54,630,557 55,160,607 48,666,619 37,635,662
(b) Total Shareholders' equity 63,449,423 57,325,510 57,591,323 47,667,565 41,921,132
Debt-Equity Ratio (a/b) 0.84 0.95 0.96 1.02 0.90
Debt-Equity Ratio
(a) Long-term Debt 15,785,537 13,586,401 14,249,576 10,036,165 6,874,794
(b) Shareholders' equity 63,449,423 57,325,510 57,591,323 47,667,565 41,921,132
Debt-Equity Ratio (a/b) 0.25 0.24 0.25 0.21 0.16
Table no.4 calculation of debt-equity ratio
The debt amount of Emaar properties in 2015 was 6874794 AED which has shown an increasing
trend up to 2019. Company has also issued equity shares to balance the ratio of debt-equity. But
the debt percentage is comparatively low than the equity. This lower ratio signifies that the entity
is not a leveraging entity and it does not want to include more debentures in its capital structures.
The company is an unlevered firm and it has also been seen that the entity is involved in the
practice of including debenture in the balance sheet. According to Lewis and Tan (2016, p-599),
the company should include more amount of debenture because it is less risky and the other
advantage of debenture is that it leads to tax benefit for the company. The ownership of entity
also remains with the entity when the debentures are issued. Ratio of debt to equity should be
balanced so that the company can easily manage its debt and equity. Though the debt is cheaper
than equity the debt should not be more than the equity because high ratio of debt amount will be
quite riskier for the investors.
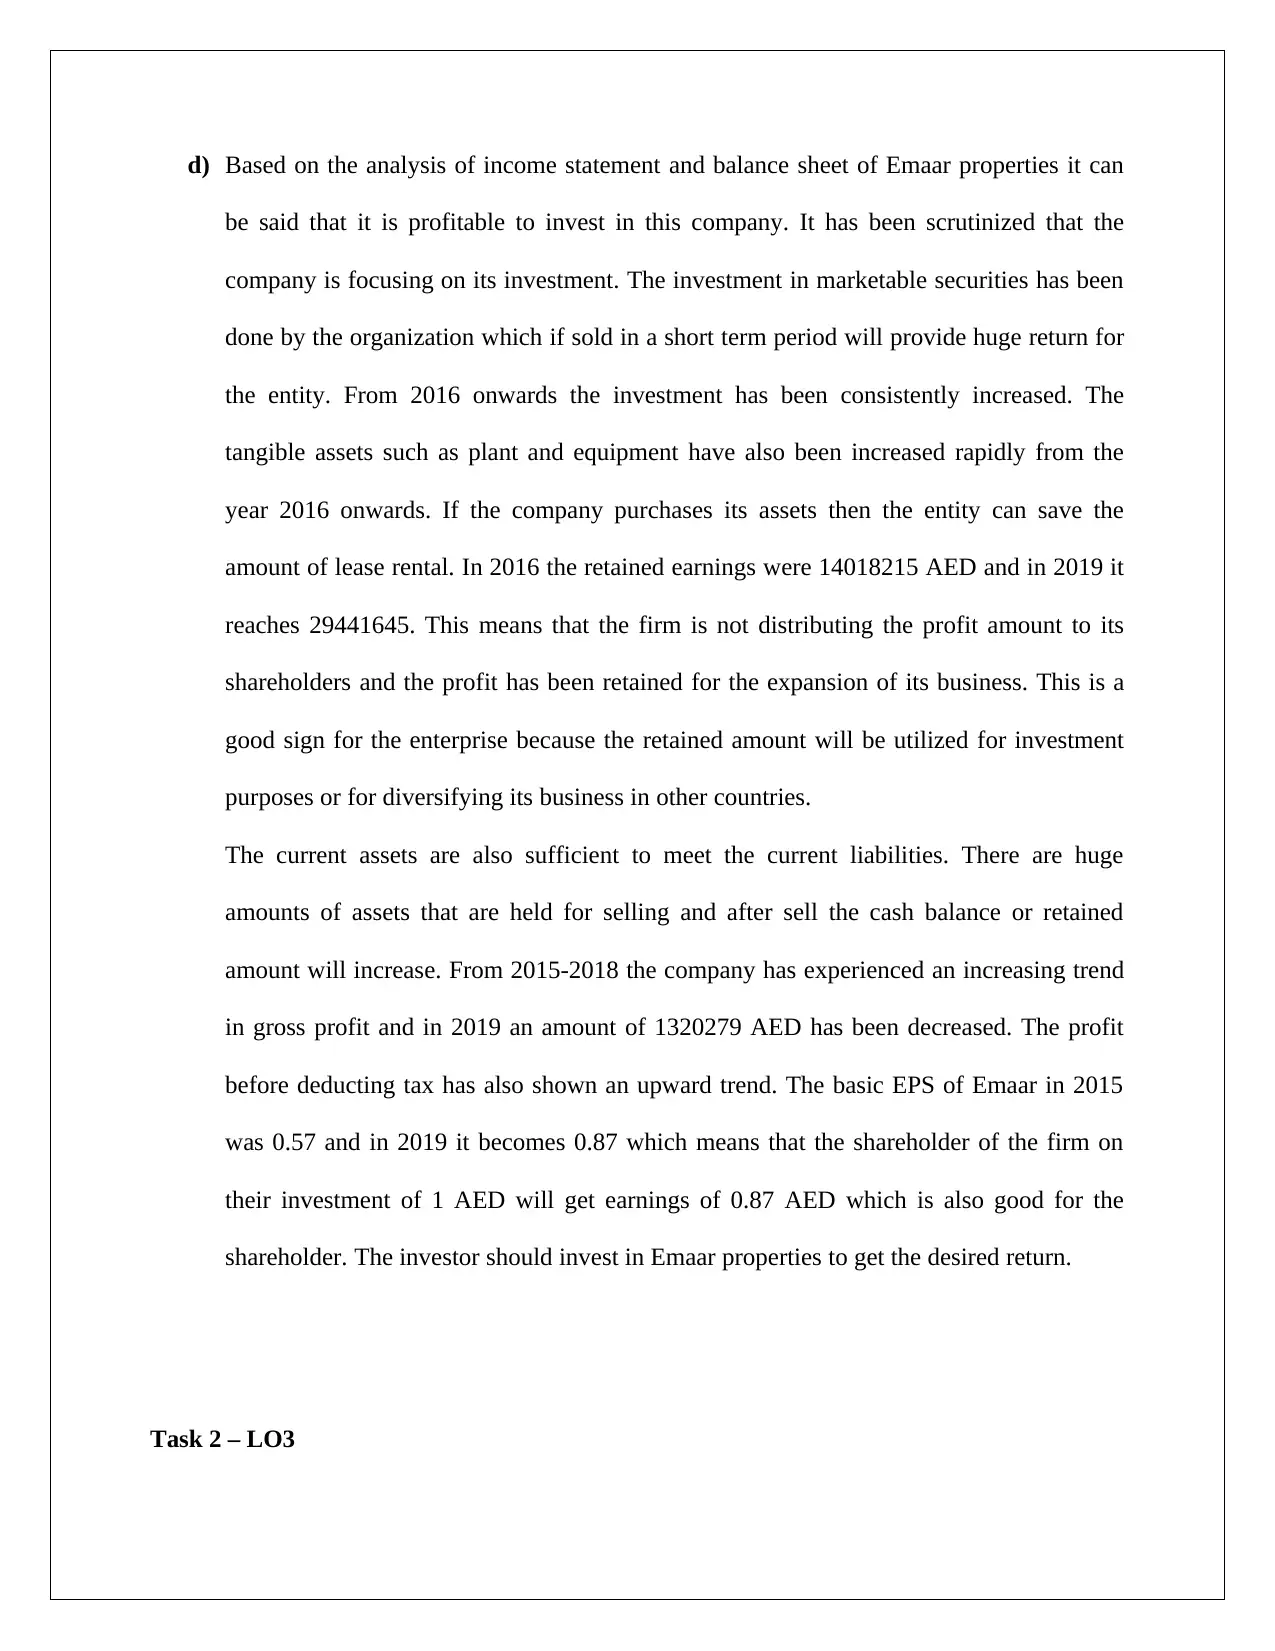
d) Based on the analysis of income statement and balance sheet of Emaar properties it can
be said that it is profitable to invest in this company. It has been scrutinized that the
company is focusing on its investment. The investment in marketable securities has been
done by the organization which if sold in a short term period will provide huge return for
the entity. From 2016 onwards the investment has been consistently increased. The
tangible assets such as plant and equipment have also been increased rapidly from the
year 2016 onwards. If the company purchases its assets then the entity can save the
amount of lease rental. In 2016 the retained earnings were 14018215 AED and in 2019 it
reaches 29441645. This means that the firm is not distributing the profit amount to its
shareholders and the profit has been retained for the expansion of its business. This is a
good sign for the enterprise because the retained amount will be utilized for investment
purposes or for diversifying its business in other countries.
The current assets are also sufficient to meet the current liabilities. There are huge
amounts of assets that are held for selling and after sell the cash balance or retained
amount will increase. From 2015-2018 the company has experienced an increasing trend
in gross profit and in 2019 an amount of 1320279 AED has been decreased. The profit
before deducting tax has also shown an upward trend. The basic EPS of Emaar in 2015
was 0.57 and in 2019 it becomes 0.87 which means that the shareholder of the firm on
their investment of 1 AED will get earnings of 0.87 AED which is also good for the
shareholder. The investor should invest in Emaar properties to get the desired return.
Task 2 – LO3
⊘ This is a preview!⊘
Do you want full access?
Subscribe today to unlock all pages.
Trusted by 1+ million students worldwide
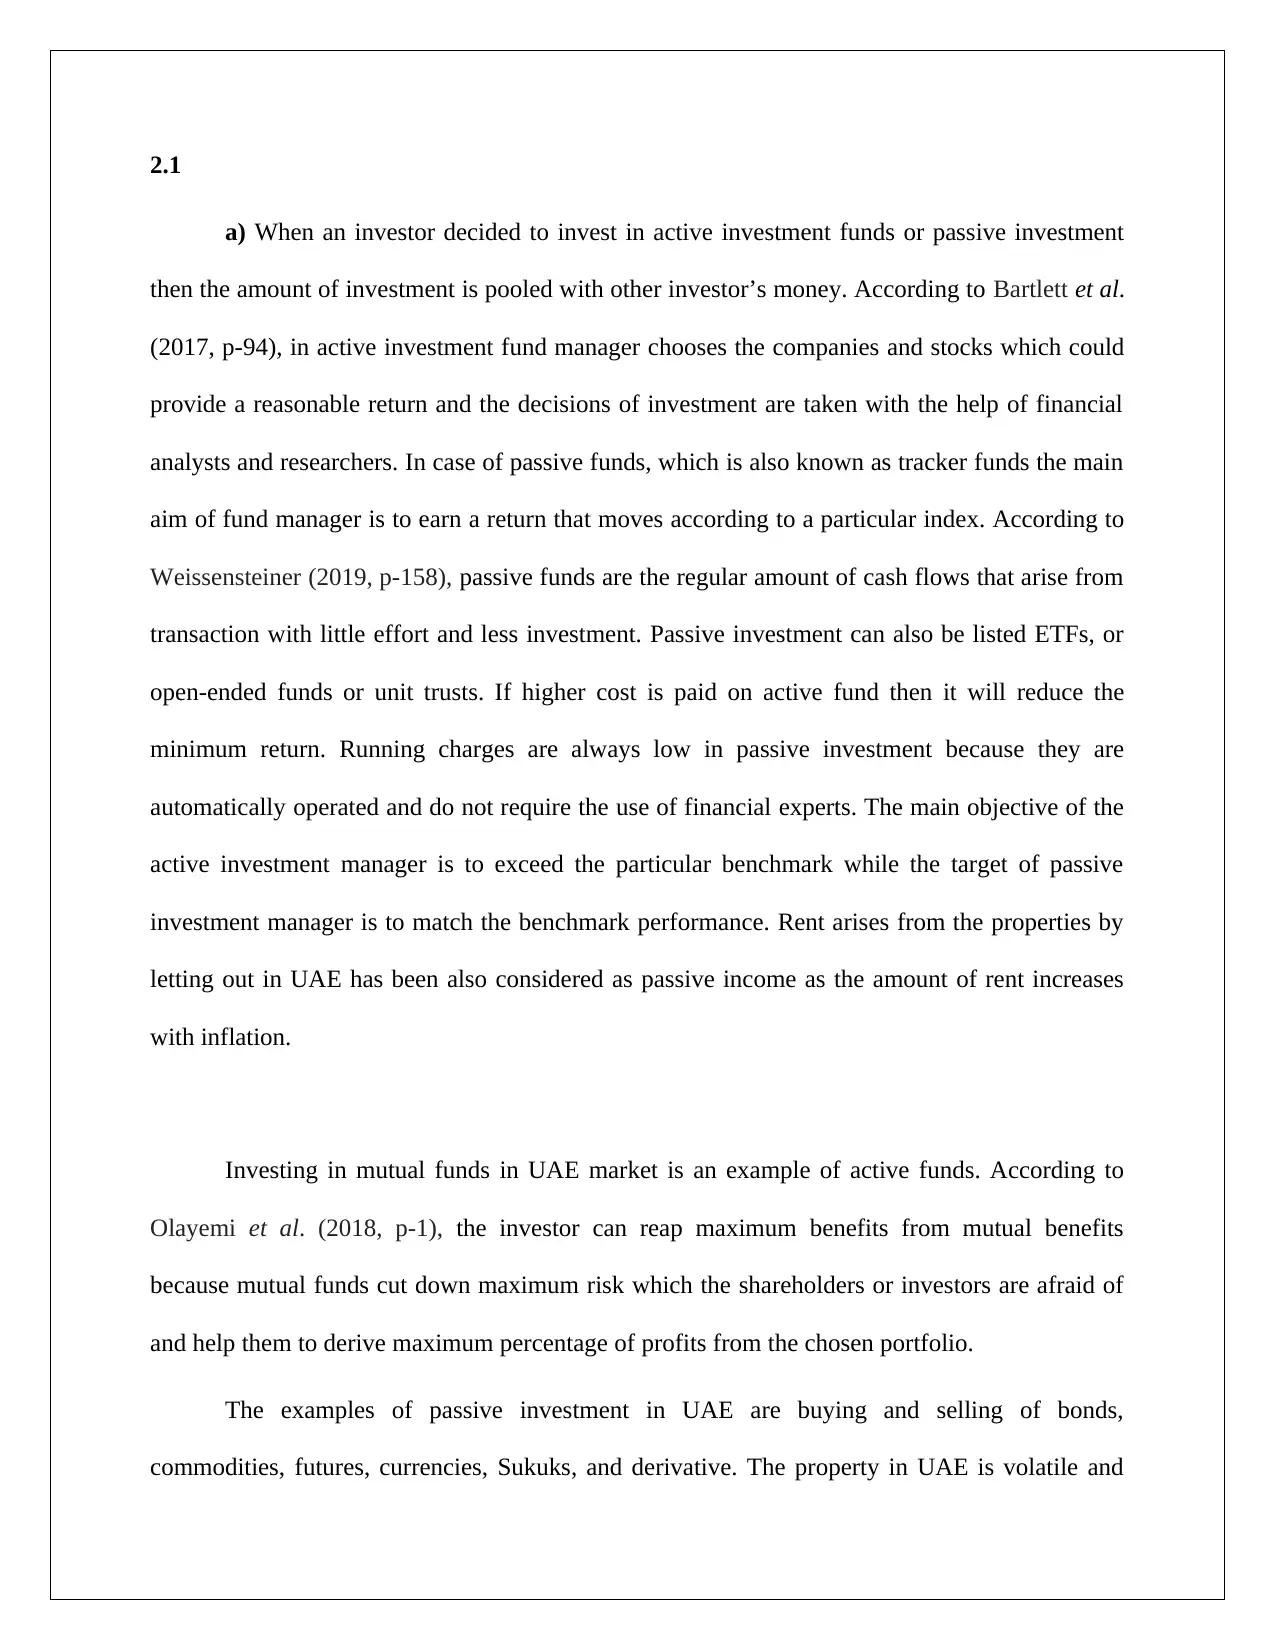
2.1
a) When an investor decided to invest in active investment funds or passive investment
then the amount of investment is pooled with other investor’s money. According to Bartlett et al.
(2017, p-94), in active investment fund manager chooses the companies and stocks which could
provide a reasonable return and the decisions of investment are taken with the help of financial
analysts and researchers. In case of passive funds, which is also known as tracker funds the main
aim of fund manager is to earn a return that moves according to a particular index. According to
Weissensteiner (2019, p-158), passive funds are the regular amount of cash flows that arise from
transaction with little effort and less investment. Passive investment can also be listed ETFs, or
open-ended funds or unit trusts. If higher cost is paid on active fund then it will reduce the
minimum return. Running charges are always low in passive investment because they are
automatically operated and do not require the use of financial experts. The main objective of the
active investment manager is to exceed the particular benchmark while the target of passive
investment manager is to match the benchmark performance. Rent arises from the properties by
letting out in UAE has been also considered as passive income as the amount of rent increases
with inflation.
Investing in mutual funds in UAE market is an example of active funds. According to
Olayemi et al. (2018, p-1), the investor can reap maximum benefits from mutual benefits
because mutual funds cut down maximum risk which the shareholders or investors are afraid of
and help them to derive maximum percentage of profits from the chosen portfolio.
The examples of passive investment in UAE are buying and selling of bonds,
commodities, futures, currencies, Sukuks, and derivative. The property in UAE is volatile and
Paraphrase This Document
Need a fresh take? Get an instant paraphrase of this document with our AI Paraphraser
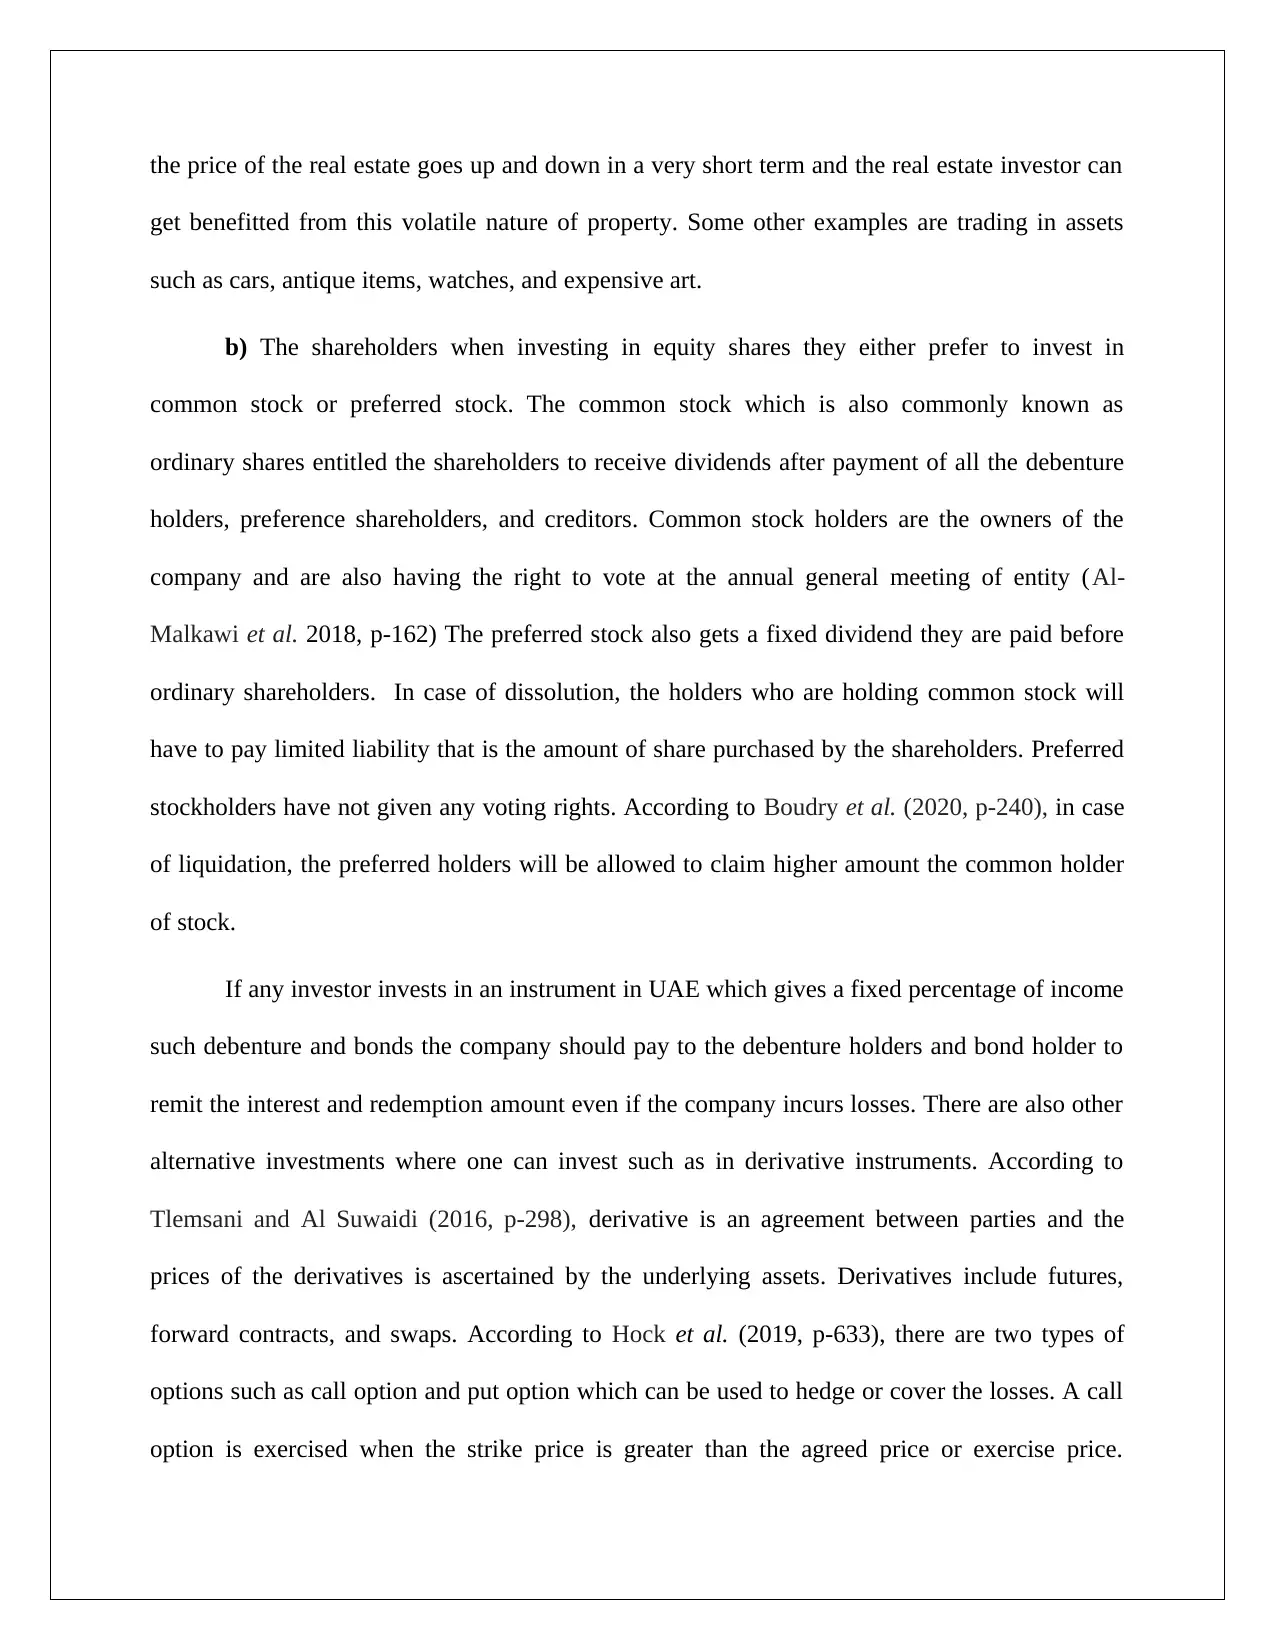
the price of the real estate goes up and down in a very short term and the real estate investor can
get benefitted from this volatile nature of property. Some other examples are trading in assets
such as cars, antique items, watches, and expensive art.
b) The shareholders when investing in equity shares they either prefer to invest in
common stock or preferred stock. The common stock which is also commonly known as
ordinary shares entitled the shareholders to receive dividends after payment of all the debenture
holders, preference shareholders, and creditors. Common stock holders are the owners of the
company and are also having the right to vote at the annual general meeting of entity (Al-
Malkawi et al. 2018, p-162) The preferred stock also gets a fixed dividend they are paid before
ordinary shareholders. In case of dissolution, the holders who are holding common stock will
have to pay limited liability that is the amount of share purchased by the shareholders. Preferred
stockholders have not given any voting rights. According to Boudry et al. (2020, p-240), in case
of liquidation, the preferred holders will be allowed to claim higher amount the common holder
of stock.
If any investor invests in an instrument in UAE which gives a fixed percentage of income
such debenture and bonds the company should pay to the debenture holders and bond holder to
remit the interest and redemption amount even if the company incurs losses. There are also other
alternative investments where one can invest such as in derivative instruments. According to
Tlemsani and Al Suwaidi (2016, p-298), derivative is an agreement between parties and the
prices of the derivatives is ascertained by the underlying assets. Derivatives include futures,
forward contracts, and swaps. According to Hock et al. (2019, p-633), there are two types of
options such as call option and put option which can be used to hedge or cover the losses. A call
option is exercised when the strike price is greater than the agreed price or exercise price.
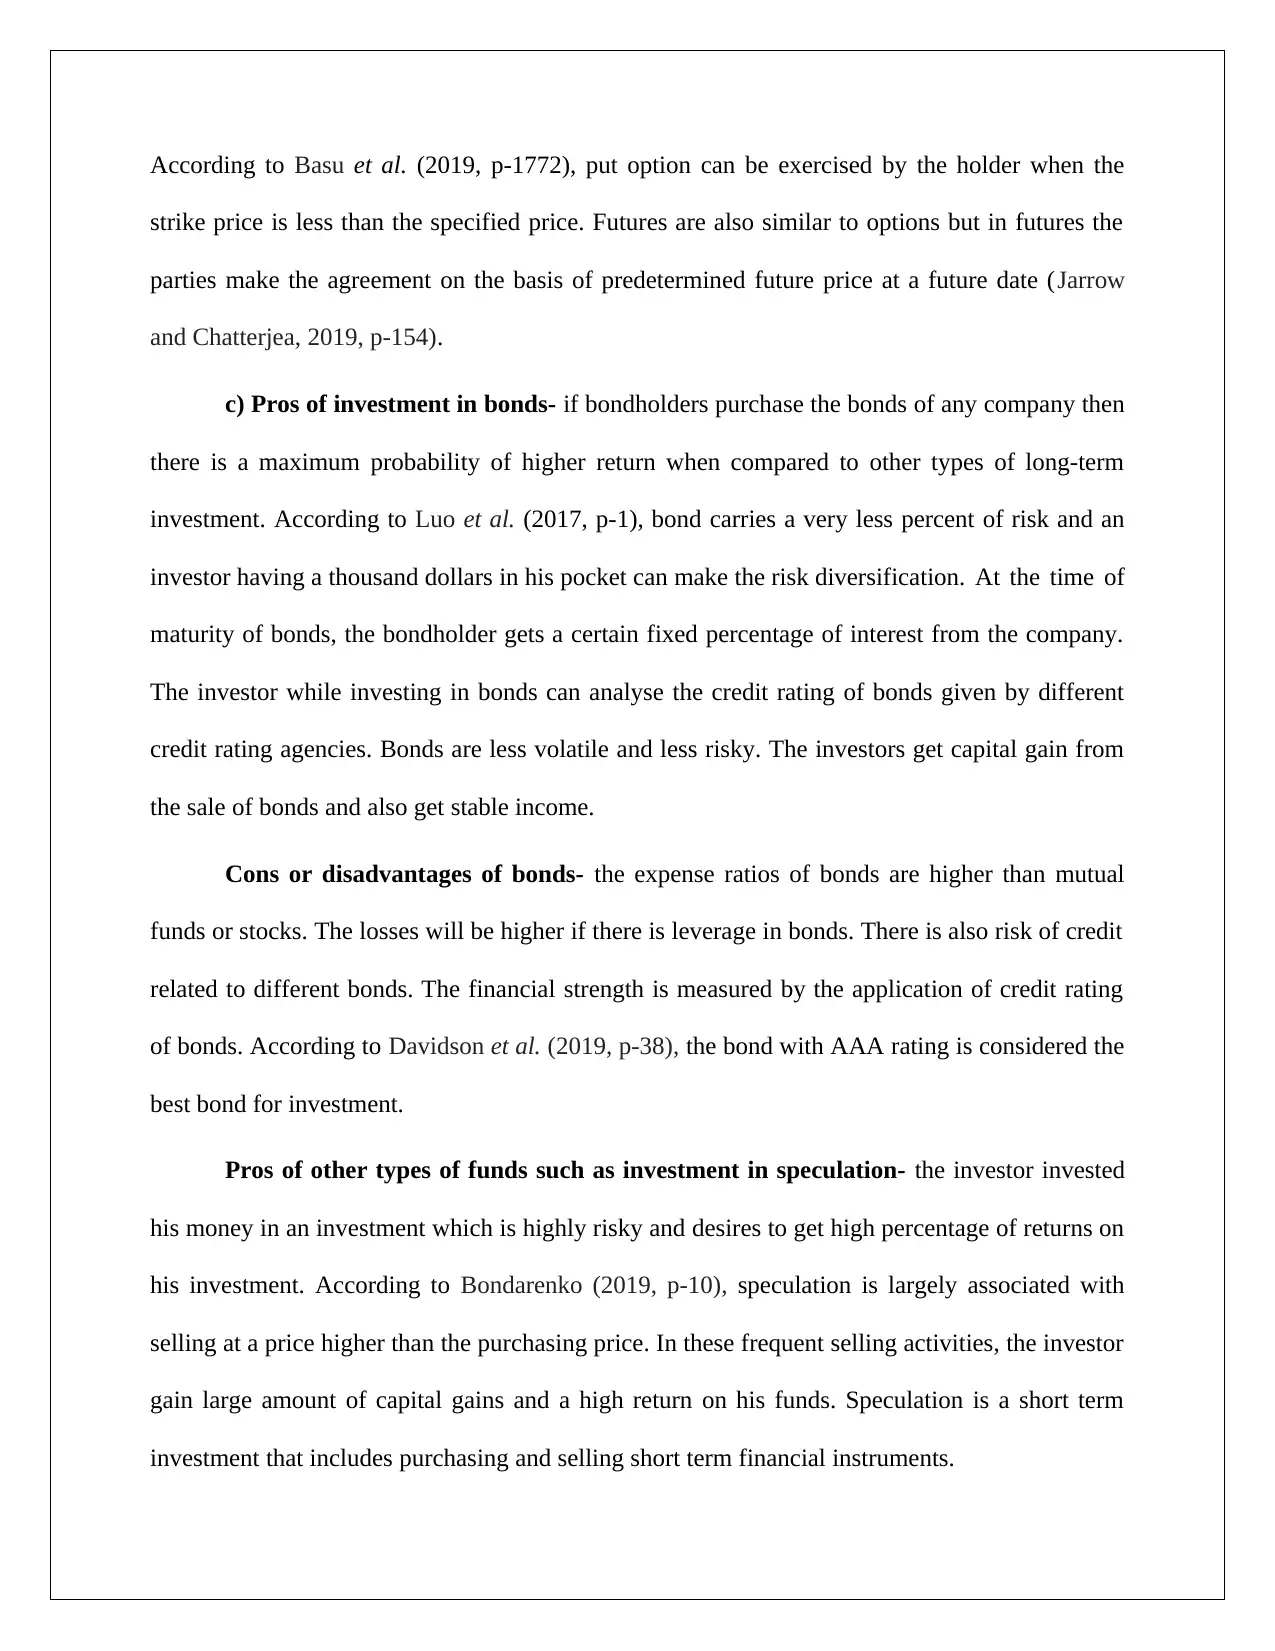
According to Basu et al. (2019, p-1772), put option can be exercised by the holder when the
strike price is less than the specified price. Futures are also similar to options but in futures the
parties make the agreement on the basis of predetermined future price at a future date (Jarrow
and Chatterjea, 2019, p-154).
c) Pros of investment in bonds- if bondholders purchase the bonds of any company then
there is a maximum probability of higher return when compared to other types of long-term
investment. According to Luo et al. (2017, p-1), bond carries a very less percent of risk and an
investor having a thousand dollars in his pocket can make the risk diversification. At the time of
maturity of bonds, the bondholder gets a certain fixed percentage of interest from the company.
The investor while investing in bonds can analyse the credit rating of bonds given by different
credit rating agencies. Bonds are less volatile and less risky. The investors get capital gain from
the sale of bonds and also get stable income.
Cons or disadvantages of bonds- the expense ratios of bonds are higher than mutual
funds or stocks. The losses will be higher if there is leverage in bonds. There is also risk of credit
related to different bonds. The financial strength is measured by the application of credit rating
of bonds. According to Davidson et al. (2019, p-38), the bond with AAA rating is considered the
best bond for investment.
Pros of other types of funds such as investment in speculation- the investor invested
his money in an investment which is highly risky and desires to get high percentage of returns on
his investment. According to Bondarenko (2019, p-10), speculation is largely associated with
selling at a price higher than the purchasing price. In these frequent selling activities, the investor
gain large amount of capital gains and a high return on his funds. Speculation is a short term
investment that includes purchasing and selling short term financial instruments.
⊘ This is a preview!⊘
Do you want full access?
Subscribe today to unlock all pages.
Trusted by 1+ million students worldwide
1 out of 19
Related Documents


Your All-in-One AI-Powered Toolkit for Academic Success.
+13062052269
info@desklib.com
Available 24*7 on WhatsApp / Email
![[object Object]](/_next/static/media/star-bottom.7253800d.svg)
Unlock your academic potential
Copyright © 2020–2026 A2Z Services. All Rights Reserved. Developed and managed by ZUCOL.