EMAAR vs ALDAR Financial Analysis Case Study
VerifiedAdded on 2019/09/16
|28
|6492
|850
Case Study
AI Summary
This case study provides a comprehensive financial analysis of two major real estate companies, EMAAR and ALDAR, comparing their performance using various financial ratios, cash flow statements, and income statements. The analysis covers liquidity, solvency, efficiency, and profitability ratios, as well as detailed cash flow and income statement analysis for the years 2014 and 2015. The study also explores the companies' relationships with employees, management, and investors, and analyzes their sources of finance. Furthermore, it discusses potential expansion strategies, sources of funding, strengths, weaknesses, and the current commercial environment for both companies. The study concludes that, based on the analyzed data, ALDAR Company is performing better than EMAAR Company, despite EMAAR's international presence, highlighting ALDAR's effective cash flow management and higher profitability.

EMAAR - ALDAR
Paraphrase This Document
Need a fresh take? Get an instant paraphrase of this document with our AI Paraphraser
Table of Contents
Introduction......................................................................................................................................2
Ratio analysis...................................................................................................................................3
1. Liquidity ratio.......................................................................................................................3
2. Solvency ratio.......................................................................................................................3
3. Efficiency ratio.....................................................................................................................4
4. Profitability ratio...................................................................................................................4
Company relationship with employees and management...............................................................5
Accountability of company..............................................................................................................5
Investors Analysis............................................................................................................................5
Source of finance Analysis..............................................................................................................5
Cash flow analysis...........................................................................................................................6
Income statement Analysis..............................................................................................................7
Conclusion.......................................................................................................................................7
Part -2...............................................................................................................................................8
Company expansion by 25%...........................................................................................................8
Sources of money............................................................................................................................8
Strength and weakness...................................................................................................................10
Company analysis..........................................................................................................................11
Gearing ratio..............................................................................................................................11
P/E ratio.........................................................................................................................................11
Conclusion.....................................................................................................................................12
Part -3.............................................................................................................................................12
Current Commercial environment.................................................................................................12
Management accounting techniques..............................................................................................13
1. Budgeting............................................................................................................................13
2. Financial planning..............................................................................................................13
3. Analysis of financial statement...........................................................................................13
4. Historical cost accounting...................................................................................................13
5. Fund flow statement...........................................................................................................14
6. Cash flow statement............................................................................................................14
7. Marginal costing.................................................................................................................14
8. Decision-making.................................................................................................................14

9. Communicating...................................................................................................................14
10. Statistical and graphical techniques................................................................................15
11. Revaluation accounting...................................................................................................15
References......................................................................................................................................16
⊘ This is a preview!⊘
Do you want full access?
Subscribe today to unlock all pages.
Trusted by 1+ million students worldwide
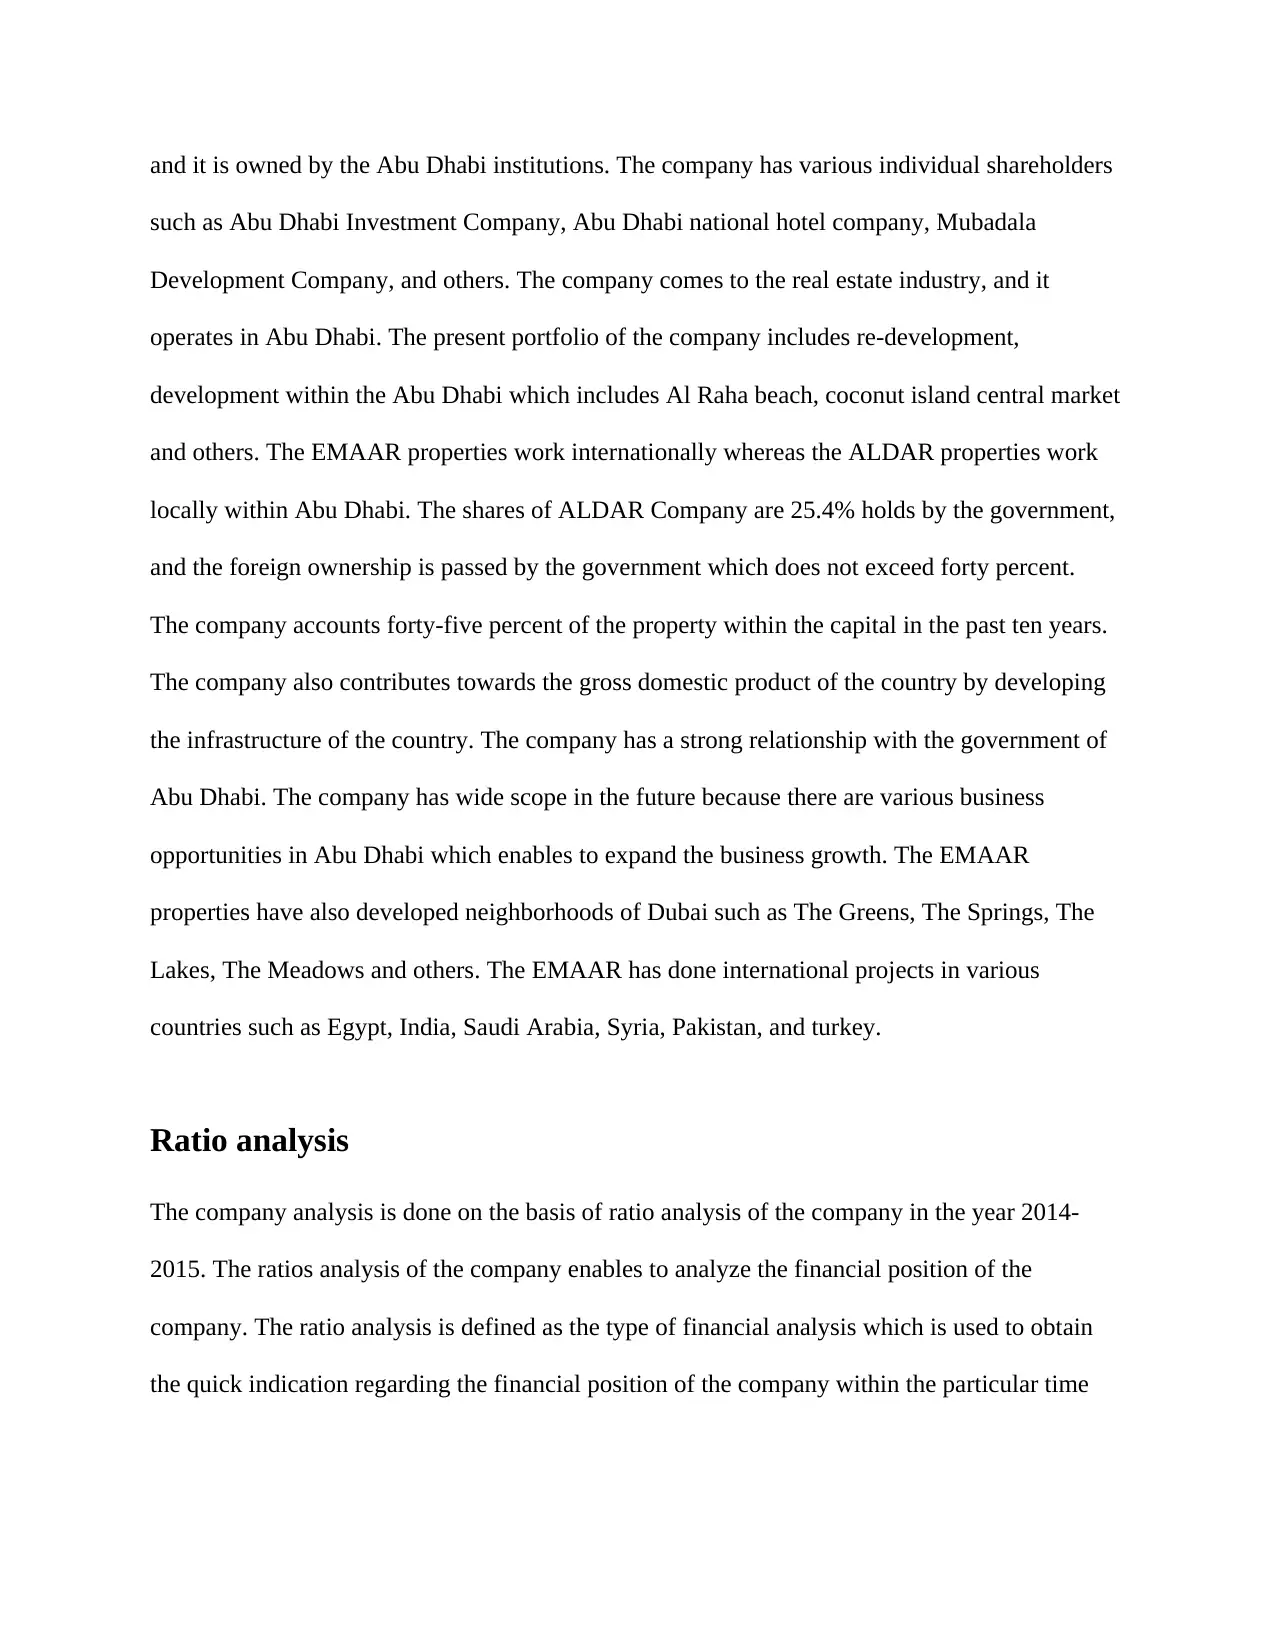
Introduction
In this present paper, we will discuss the financial analysis of ALDAR and EMAAR Company
then both the financial statements are compared on the basis of financial ratios and statements of
the company. The EMAAR is a real estate development company which is located in the United
Arab Emirates. The company comes under the public joint stock company, and it is also listed on
the Dubai Financial Market as DFM: EMAAR. The EMAAR operates internationally, and it
provides management services and property development services (Emaar Properties PJSC et al.,
2017). The company has sixty active companies and six business segments. The company is
present in thirty-six markets across the North Africa, Middle East, Europe, Pacific, and North
America. The company comes under one of the largest real estate developers in the UAE. The
company is majorly known for its greatest achievements such as the development of Burj Khalifa
which is the tallest tower in the world and it is the seven-star hotels across the globe. The
company was founded in 1997 by its chairman Mohamed Alabbar (Aldar Properties et al., 2017).
The company has diversified its interest into real estates which include the building of residents,
commercials, malls, hospitals and others. The company directly contributes towards the
development of the country and its revenue in the year 2010 was $3.307 Billion. The total
employees of the company in 2010 were ten thousand. The company was owned by the public,
and the founding shareholders of the company have 24.3 percent share in the company. Whereas
the ALDAR properties are also one of the real estate development company which is presiding in
Abu Dhabi, United Arab Emirates. It is the investment management company which is popular
for the successfully delivery of various projects such as Al Jimi Shopping Centre, Yas Island, Al
Gurm Resort, Abu Dhabi commercial market and others. The company was founded in 2001,
Paraphrase This Document
Need a fresh take? Get an instant paraphrase of this document with our AI Paraphraser
and it is owned by the Abu Dhabi institutions. The company has various individual shareholders
such as Abu Dhabi Investment Company, Abu Dhabi national hotel company, Mubadala
Development Company, and others. The company comes to the real estate industry, and it
operates in Abu Dhabi. The present portfolio of the company includes re-development,
development within the Abu Dhabi which includes Al Raha beach, coconut island central market
and others. The EMAAR properties work internationally whereas the ALDAR properties work
locally within Abu Dhabi. The shares of ALDAR Company are 25.4% holds by the government,
and the foreign ownership is passed by the government which does not exceed forty percent.
The company accounts forty-five percent of the property within the capital in the past ten years.
The company also contributes towards the gross domestic product of the country by developing
the infrastructure of the country. The company has a strong relationship with the government of
Abu Dhabi. The company has wide scope in the future because there are various business
opportunities in Abu Dhabi which enables to expand the business growth. The EMAAR
properties have also developed neighborhoods of Dubai such as The Greens, The Springs, The
Lakes, The Meadows and others. The EMAAR has done international projects in various
countries such as Egypt, India, Saudi Arabia, Syria, Pakistan, and turkey.
Ratio analysis
The company analysis is done on the basis of ratio analysis of the company in the year 2014-
2015. The ratios analysis of the company enables to analyze the financial position of the
company. The ratio analysis is defined as the type of financial analysis which is used to obtain
the quick indication regarding the financial position of the company within the particular time
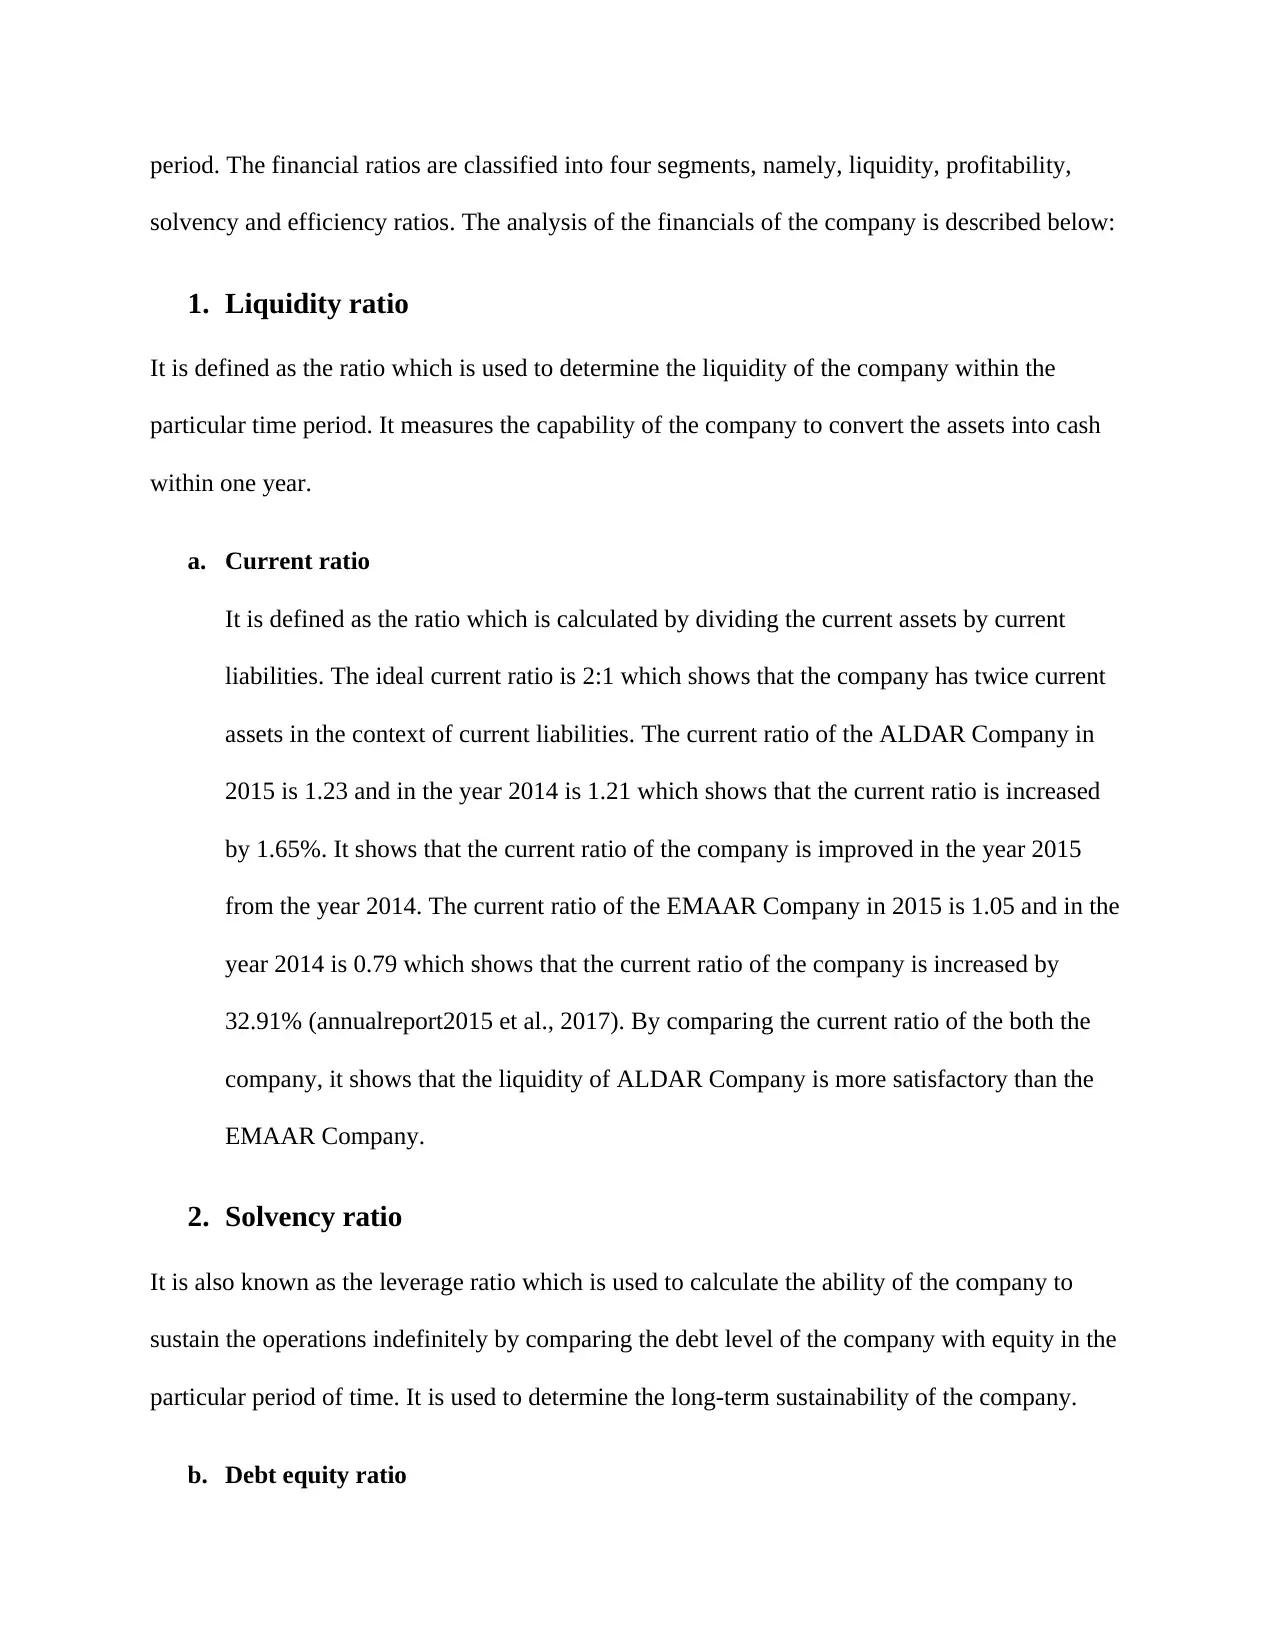
period. The financial ratios are classified into four segments, namely, liquidity, profitability,
solvency and efficiency ratios. The analysis of the financials of the company is described below:
1. Liquidity ratio
It is defined as the ratio which is used to determine the liquidity of the company within the
particular time period. It measures the capability of the company to convert the assets into cash
within one year.
a. Current ratio
It is defined as the ratio which is calculated by dividing the current assets by current
liabilities. The ideal current ratio is 2:1 which shows that the company has twice current
assets in the context of current liabilities. The current ratio of the ALDAR Company in
2015 is 1.23 and in the year 2014 is 1.21 which shows that the current ratio is increased
by 1.65%. It shows that the current ratio of the company is improved in the year 2015
from the year 2014. The current ratio of the EMAAR Company in 2015 is 1.05 and in the
year 2014 is 0.79 which shows that the current ratio of the company is increased by
32.91% (annualreport2015 et al., 2017). By comparing the current ratio of the both the
company, it shows that the liquidity of ALDAR Company is more satisfactory than the
EMAAR Company.
2. Solvency ratio
It is also known as the leverage ratio which is used to calculate the ability of the company to
sustain the operations indefinitely by comparing the debt level of the company with equity in the
particular period of time. It is used to determine the long-term sustainability of the company.
b. Debt equity ratio
⊘ This is a preview!⊘
Do you want full access?
Subscribe today to unlock all pages.
Trusted by 1+ million students worldwide
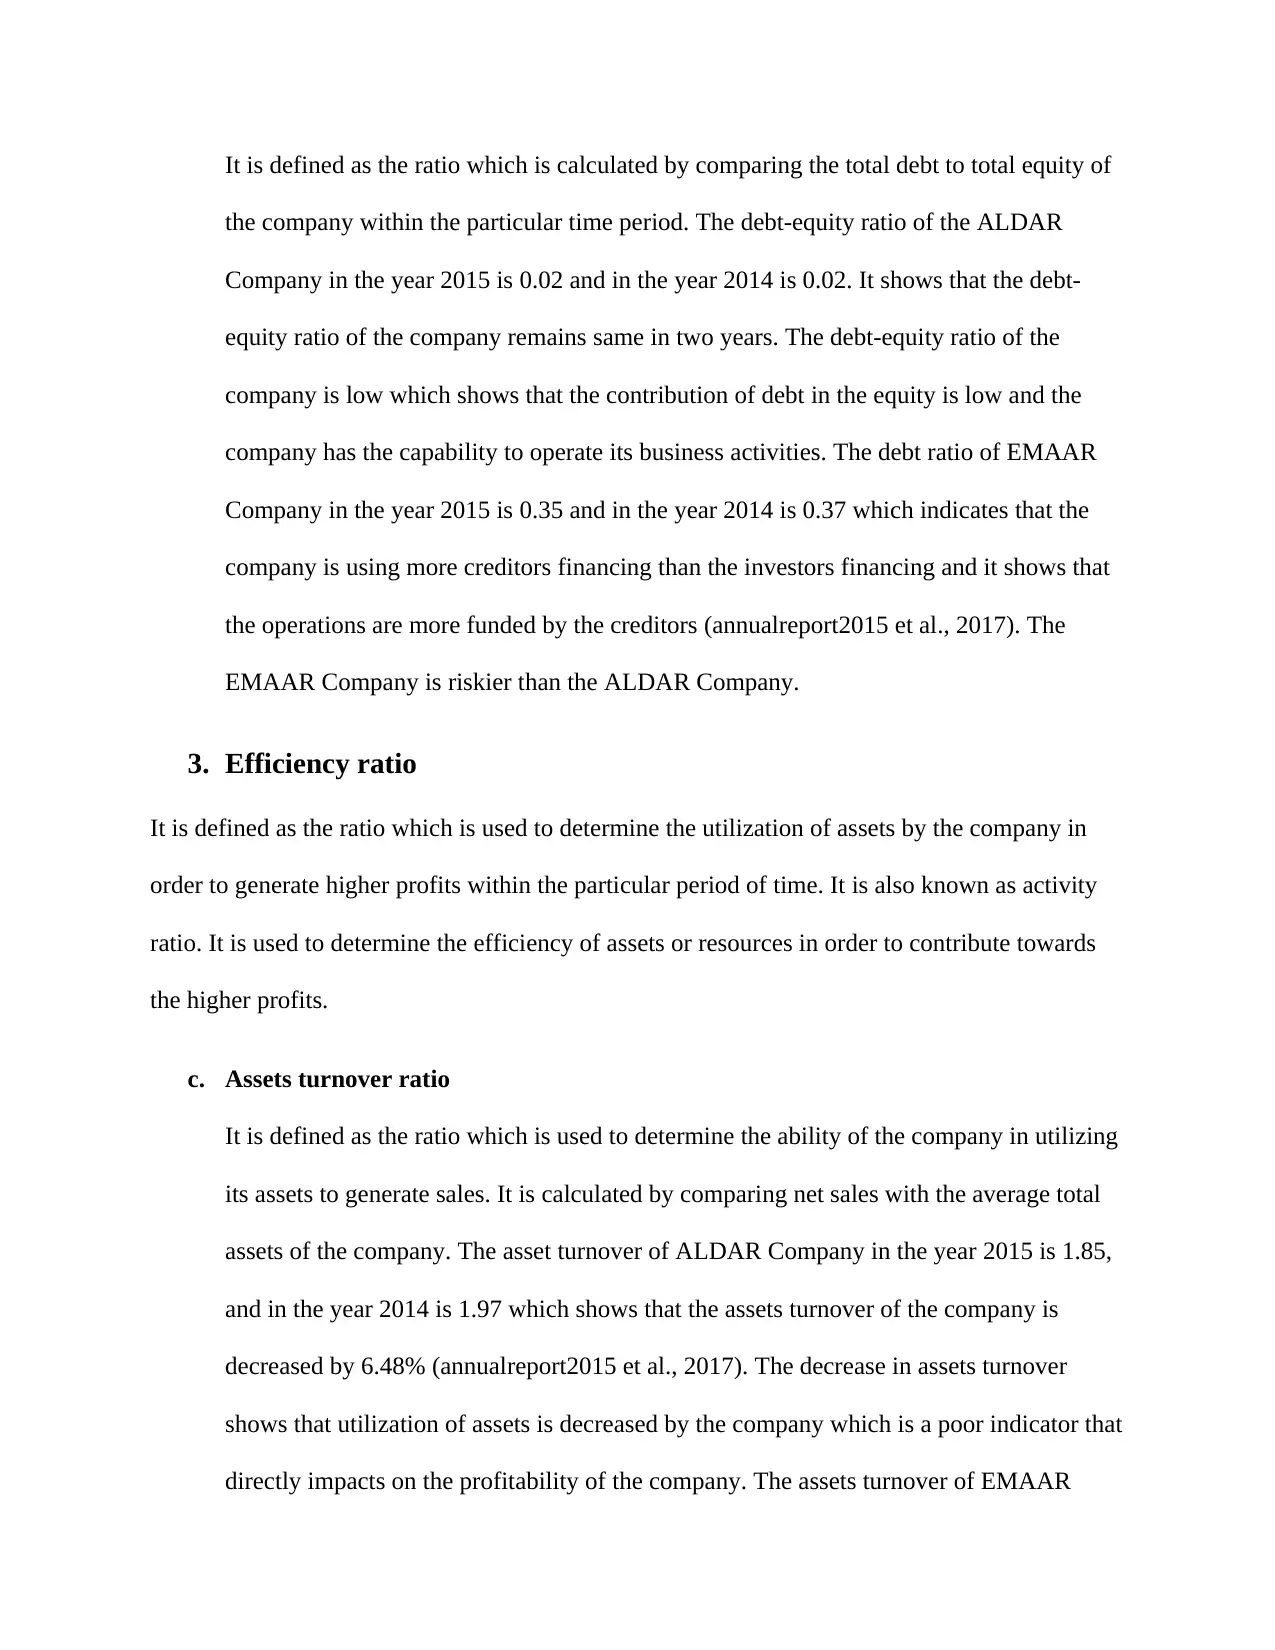
It is defined as the ratio which is calculated by comparing the total debt to total equity of
the company within the particular time period. The debt-equity ratio of the ALDAR
Company in the year 2015 is 0.02 and in the year 2014 is 0.02. It shows that the debt-
equity ratio of the company remains same in two years. The debt-equity ratio of the
company is low which shows that the contribution of debt in the equity is low and the
company has the capability to operate its business activities. The debt ratio of EMAAR
Company in the year 2015 is 0.35 and in the year 2014 is 0.37 which indicates that the
company is using more creditors financing than the investors financing and it shows that
the operations are more funded by the creditors (annualreport2015 et al., 2017). The
EMAAR Company is riskier than the ALDAR Company.
3. Efficiency ratio
It is defined as the ratio which is used to determine the utilization of assets by the company in
order to generate higher profits within the particular period of time. It is also known as activity
ratio. It is used to determine the efficiency of assets or resources in order to contribute towards
the higher profits.
c. Assets turnover ratio
It is defined as the ratio which is used to determine the ability of the company in utilizing
its assets to generate sales. It is calculated by comparing net sales with the average total
assets of the company. The asset turnover of ALDAR Company in the year 2015 is 1.85,
and in the year 2014 is 1.97 which shows that the assets turnover of the company is
decreased by 6.48% (annualreport2015 et al., 2017). The decrease in assets turnover
shows that utilization of assets is decreased by the company which is a poor indicator that
directly impacts on the profitability of the company. The assets turnover of EMAAR
Paraphrase This Document
Need a fresh take? Get an instant paraphrase of this document with our AI Paraphraser
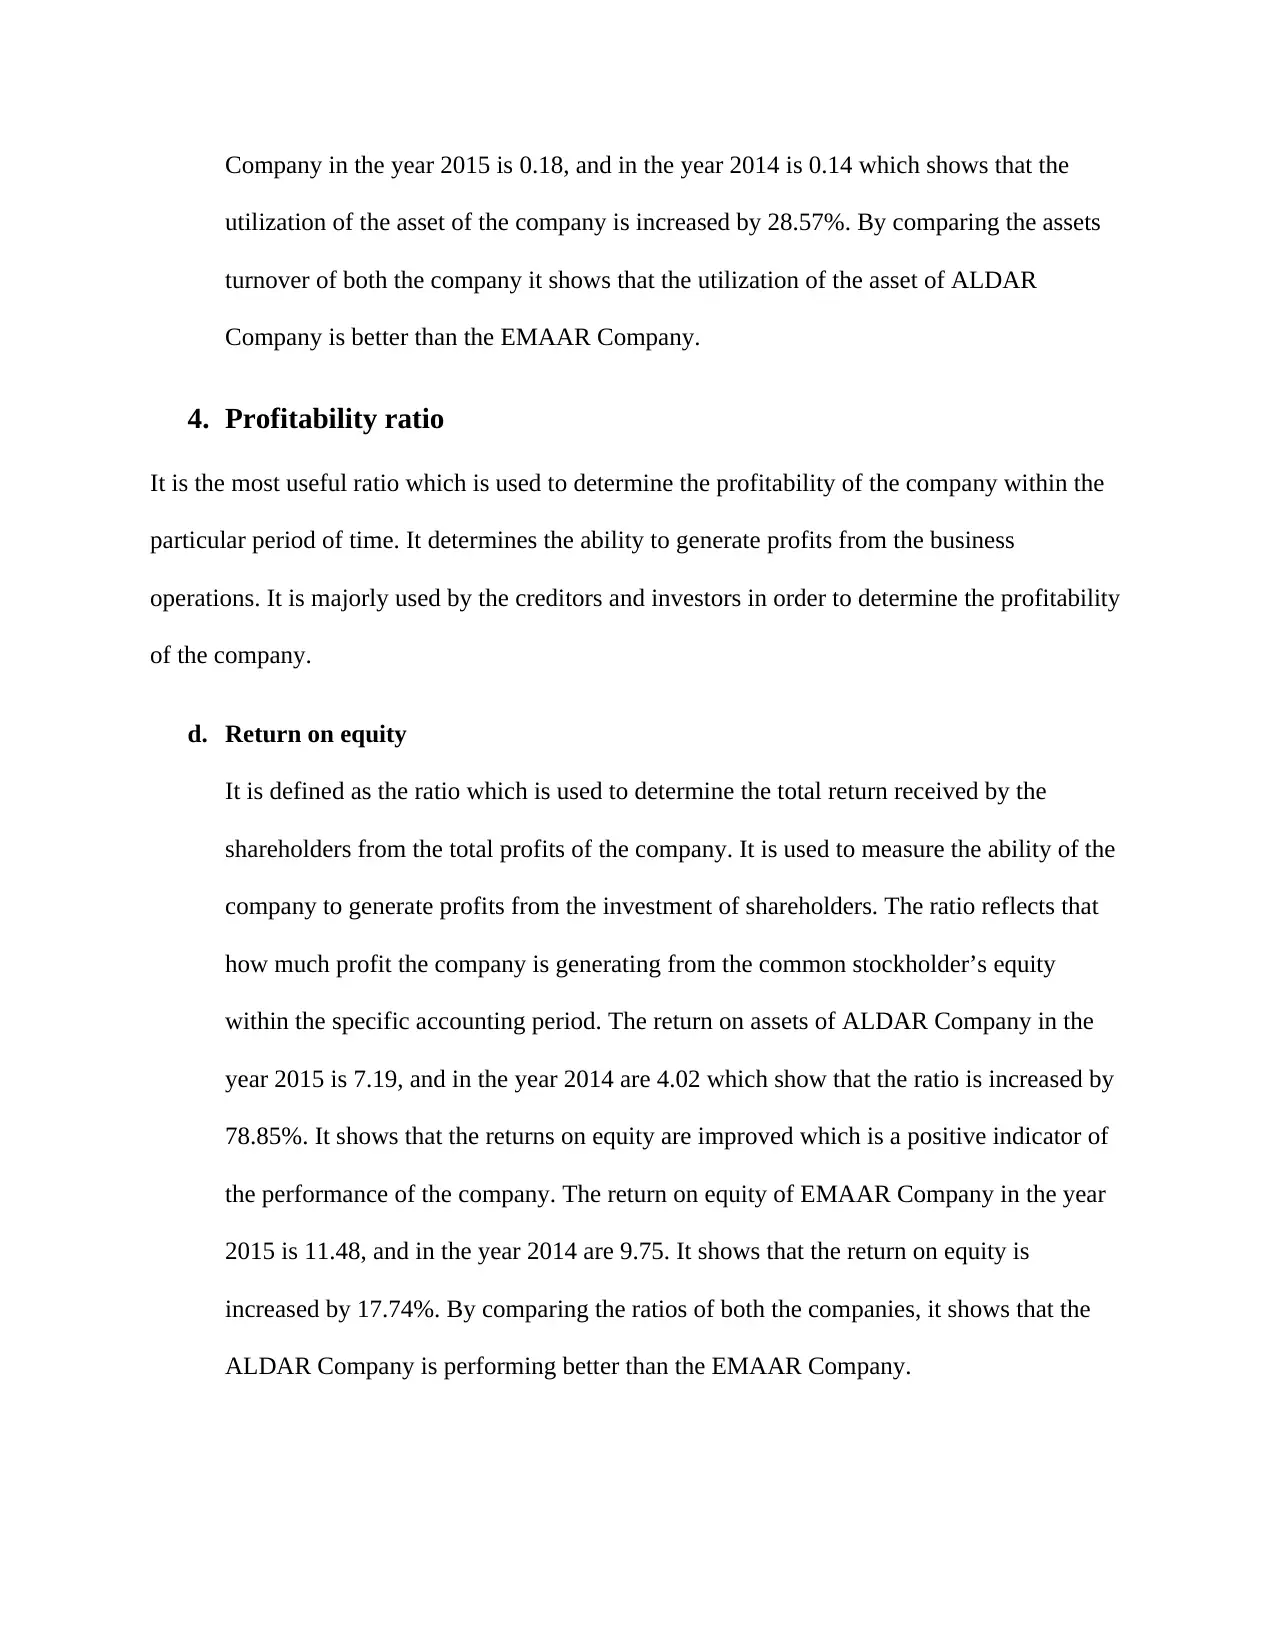
Company in the year 2015 is 0.18, and in the year 2014 is 0.14 which shows that the
utilization of the asset of the company is increased by 28.57%. By comparing the assets
turnover of both the company it shows that the utilization of the asset of ALDAR
Company is better than the EMAAR Company.
4. Profitability ratio
It is the most useful ratio which is used to determine the profitability of the company within the
particular period of time. It determines the ability to generate profits from the business
operations. It is majorly used by the creditors and investors in order to determine the profitability
of the company.
d. Return on equity
It is defined as the ratio which is used to determine the total return received by the
shareholders from the total profits of the company. It is used to measure the ability of the
company to generate profits from the investment of shareholders. The ratio reflects that
how much profit the company is generating from the common stockholder’s equity
within the specific accounting period. The return on assets of ALDAR Company in the
year 2015 is 7.19, and in the year 2014 are 4.02 which show that the ratio is increased by
78.85%. It shows that the returns on equity are improved which is a positive indicator of
the performance of the company. The return on equity of EMAAR Company in the year
2015 is 11.48, and in the year 2014 are 9.75. It shows that the return on equity is
increased by 17.74%. By comparing the ratios of both the companies, it shows that the
ALDAR Company is performing better than the EMAAR Company.
Company relationship with employees and management
The EMAAR Company is focusing on maintaining a healthy relationship with the employees
and management in order to add competitive advantage to the company. The successful projects
delivered by the EMAAR properties shows that the company has the best manpower who
directly contributes towards the achievement of higher profits and brand image in the eyes of the
customers. The company is offering lucrative packages with the additional benefits in order to
motivate the employees towards the achievement of vision of the company whereas the ALDAR
Company also has multi-disciplinary staffs who work towards the sustainable development of the
business. The ALDAR Company has five hundred man powers whereas the EMAAR has
approximately ten thousand employees who work collaboratively in an organized manner. Both
the companies are using management accounts which reflect the internal position of the company
and it is used for the decision purpose (Forrester et al., 2013).
Accountability of company
The structure of EMAAR Company is very wide as it consists of ten thousand employees who
work internationally whereas the ALDAR Company has a comparatively small structure which
works within the Abu Dhabi. The accountability of both the company is done through a formal
structure.
Investors Analysis
From the investor’s point of view, the EMAAR Properties is a high investment company because
the goodwill of the company is better than ALDAR Company. The leverage ratio is considered
by the investors at the time of making investment and the debt equity ratio of EMAAR properties
⊘ This is a preview!⊘
Do you want full access?
Subscribe today to unlock all pages.
Trusted by 1+ million students worldwide
over the past five years is stable average 0.288 and the average debt equity ratio of ALDAR
Company over the past five years is 0.02 which shows that the investment in ALDAR Company
is less risky than EMAAR Company.
Source of finance Analysis
The ALDAR Company is using both equity and debt funding. The company issue shares, bonds,
debentures, and others in order to receive the funds for the business whereas the EMAAR
properties is a public listed company which raise funds through initial public offerings, loans,
debentures, bonds, and others.
Cash flow analysis
The cash flow statement analysis is defined as the analysis of financial statement which is to determine
the inflow and outflow of cash in the company within the particular period of time. The cash
flow statement comprises of three segments, namely, cash flow from operations, cash flow from
investing and cash flow from financing (Wahlen et al., 2014). The analysis of cash flow is
explained below:
1. Cash flow from operations
The cash flow from operation of ALDAR Company in the year 2015 is 6,008,107, and in the
year 2014 are 6,661,944 which show that the net cash generated from the operations is
decreased by 10.88%. It shows that the ability to generate profit from internal sources is
reduced. The cash flow from operations of EMAAR Company in 2015 is 5,612,999, and in
Paraphrase This Document
Need a fresh take? Get an instant paraphrase of this document with our AI Paraphraser
the year 2014 is 7,830, 252. It shows that the cash generated capacity from operation is
reduced by 39.5%. By comparing the cash flow from operations of both the companies, it
shows that the ALDAR Company by is generating higher cash from operations than the
EMAAR Company.
2. Cash flow from investment
The cash generated from investment of ALDAR Company in the year 2015 is (3,350,280)
and in the year 2014 are 66,152 it shows that the cash used in investing activities goes
negative which indicates that the company is not able to meet the requirements of future
expansion but generally the investing cash flow is negative because requirement for
increased financing leads to increase in the cost of financing which reduces the future
income. The cash flow from an investment of EMAAR Company in the year 2015 is
(3,356,614) and in 2014 are 2,519,312. It shows that the cash outflow of the company for
investing in long-term investments of the company. By comparing the cash flow from the
investment of the companies, it shows that the ALDAR Company is making the high
investment in order to generate higher profits than EMAAR Company.
3. Cash flow from financing
The cash flow from the financing of ALDAR Company in the year 2015 is (4,179,647), and
in the year 2014 is (5,676,716) it shows that the net cash used in financing activities is
improved by 35.8%. The negative cash flow shows that the cash is flowing out for paying
debt, dividend or repurchase of stock. The Cash flow from the financing of EMAAR
Company in 2015 is (998,448) and in 2014 is (6,704,816) it shows that the company has
increased its cash outflow by paying a bonus to the director, repayment of loans and
borrowings and others with 85.10%. By comparing the cash flow from the financing of both
the company it shows that the ALDAR Company is managing its financials better than
EMAAR Company.
Income statement Analysis
The income statement analysis is defined as the evaluation of financial statement of the company
by analyzing the income and expenditure made by the company within the particular period of
time. It helps to determine the revenue generate by the company in the particular accounting
year.
1. Gross profit
The gross profit of EMAAR Company in the year 2015 is 7,262,924, and in the year 2014 are
5,940,728 which show that the gross profit is increased by 22.2%. The gross profit of
ALDAR Company in the year 2015 is 2,205,924, and in the year 2014 are 1,518,406 which
show that the gross profit is increased by 45.27%. By comparing the performance of both the
companies it shows that the ADLER Company is performing better than EMAAR Company.
2. Revenue
The total revenues of the EMAAR Company in the year 2015 are 13,660,536, and in the year
2014 are 9,930,044 which show that the revenue is increased by 37.56%. The revenue of the
ALDAR Company in the year 2015 is 2,205,924, and in the year 2014 is 1,518,406 which
show that the revenue of the company is increased by 45.27%. By comparing the
performance of the company, it shows that the ADLER Company is generating higher
revenue than the EMAAR Company.
3. Net Profit/loss
⊘ This is a preview!⊘
Do you want full access?
Subscribe today to unlock all pages.
Trusted by 1+ million students worldwide
1 out of 28
Related Documents


Your All-in-One AI-Powered Toolkit for Academic Success.
+13062052269
info@desklib.com
Available 24*7 on WhatsApp / Email
![[object Object]](/_next/static/media/star-bottom.7253800d.svg)
Unlock your academic potential
Copyright © 2020–2026 A2Z Services. All Rights Reserved. Developed and managed by ZUCOL.