Report on Email Usage Enhancement at the Education Department

Verified

Added on  2022/09/02

|4
|1397
|18
Report
AI Summary
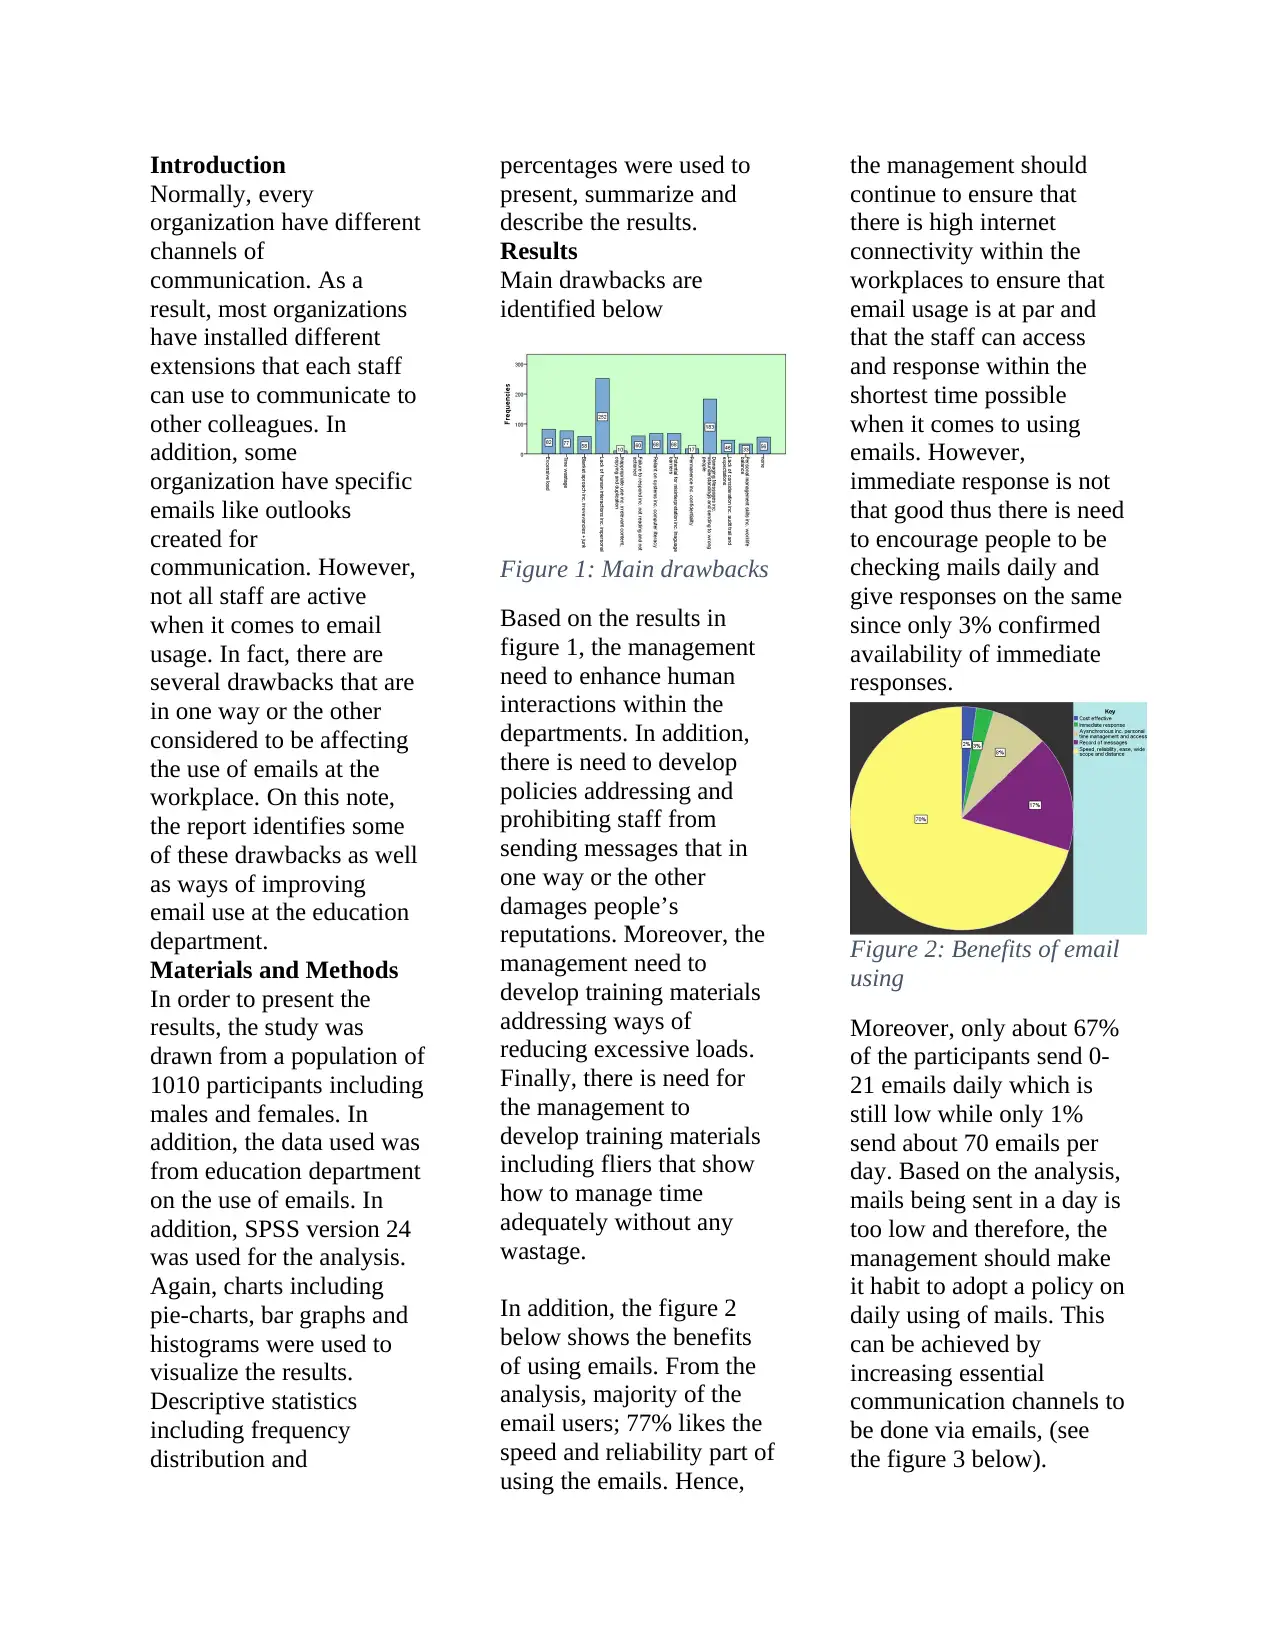
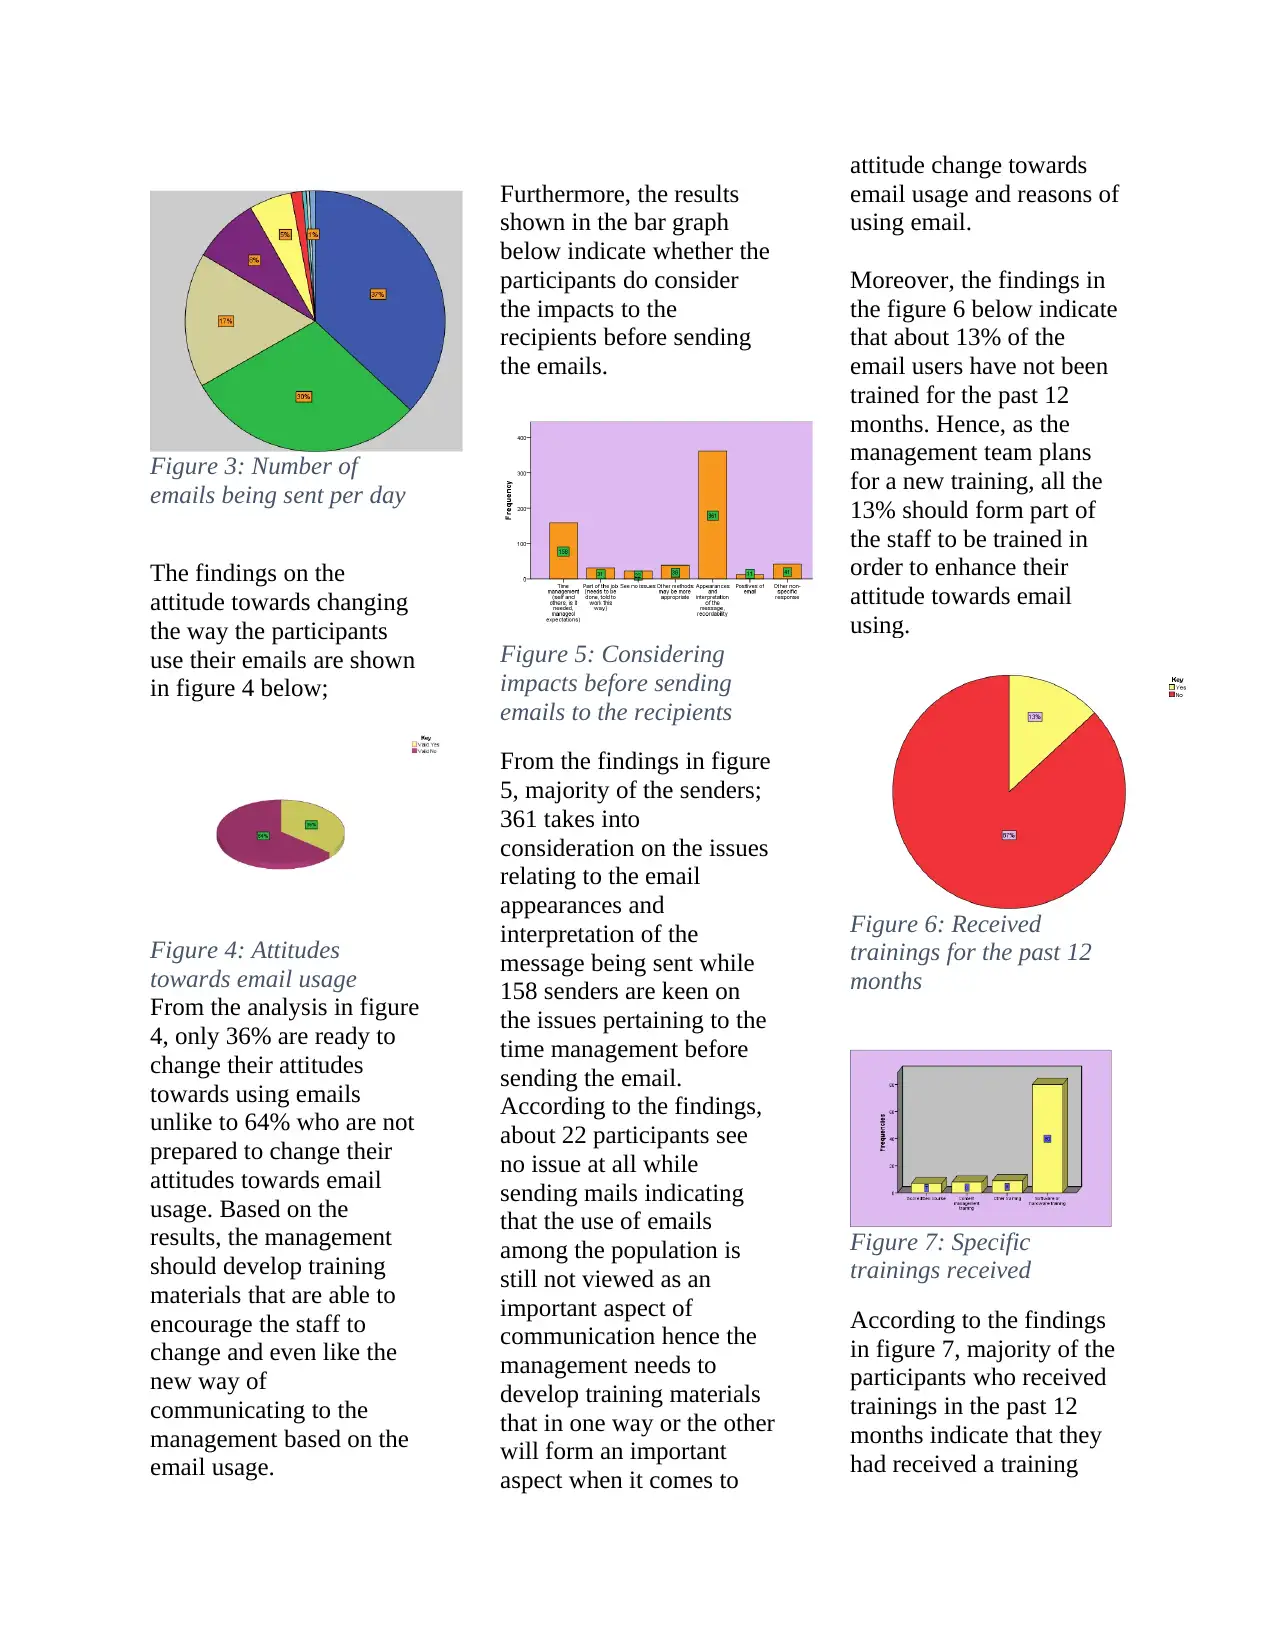
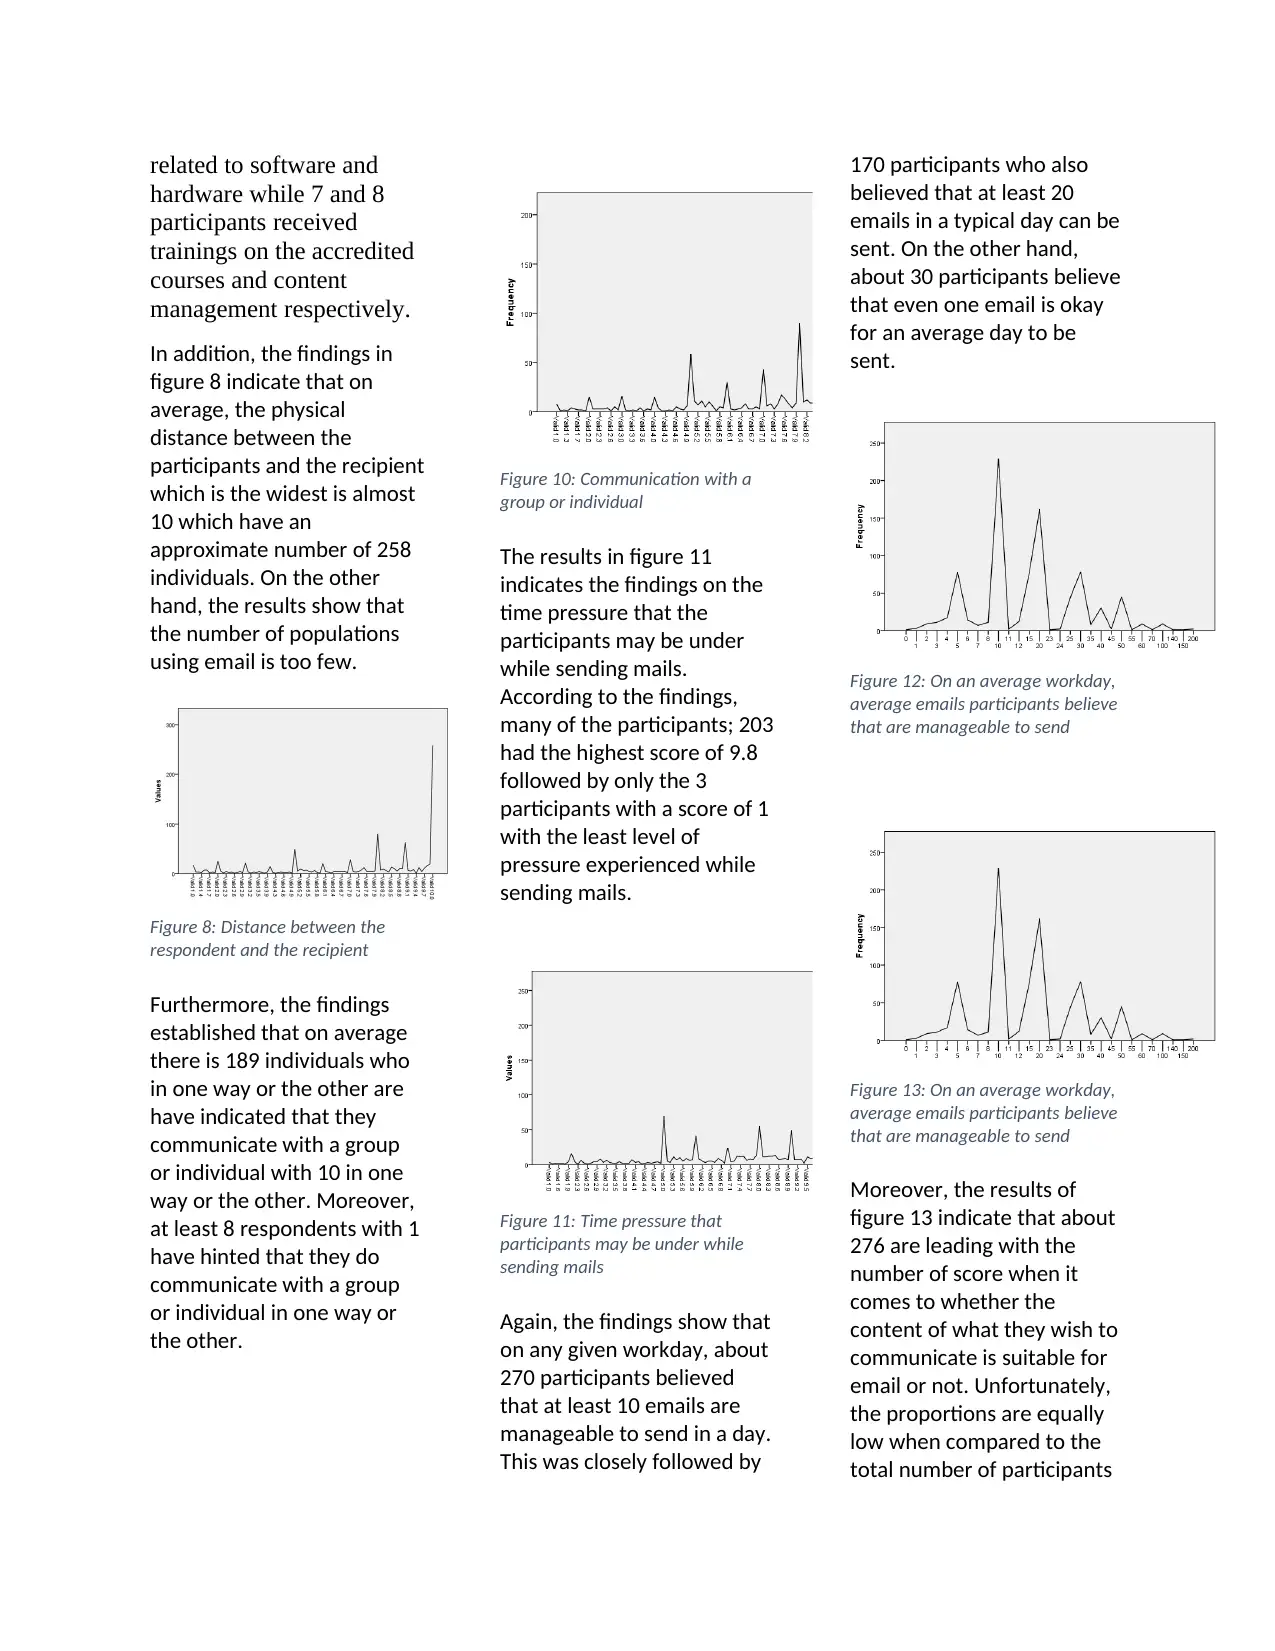
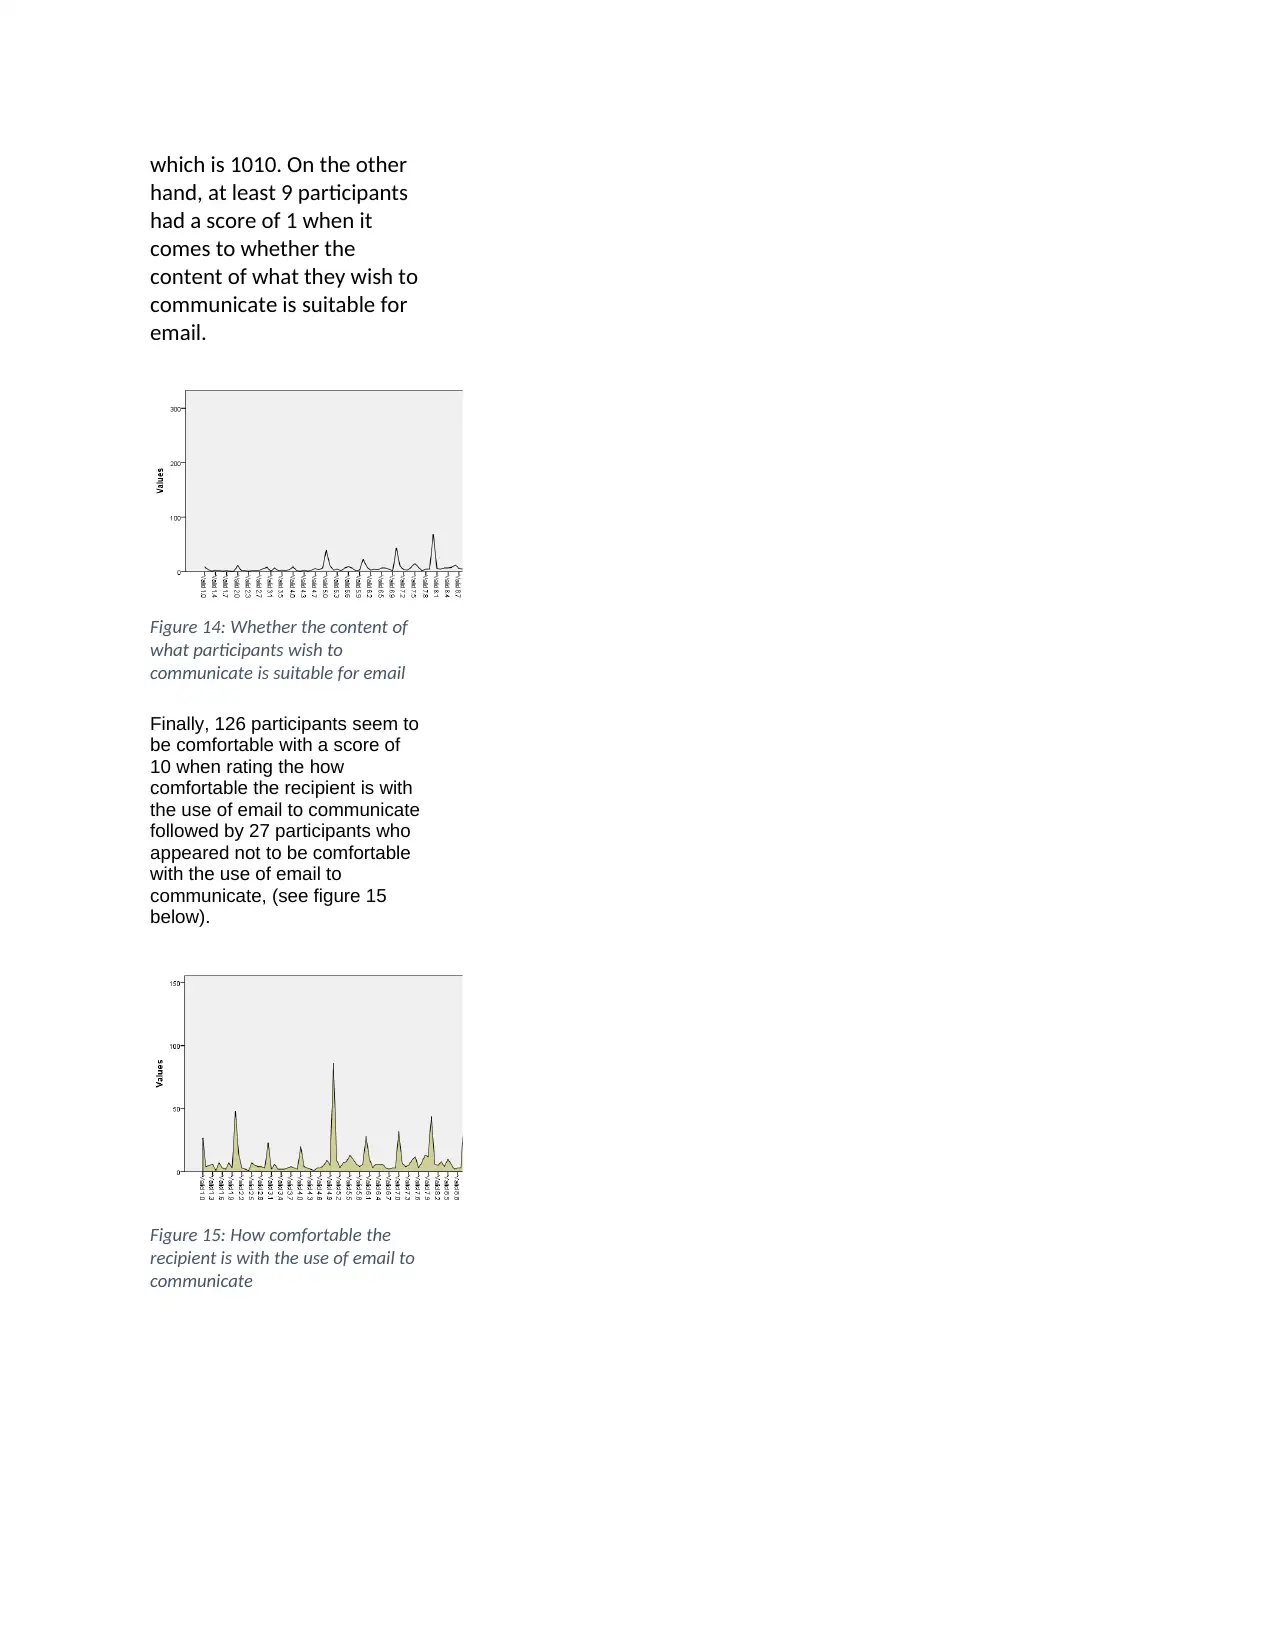
This report analyzes email usage within an education department, drawing data from a survey of 1010 participants. The study identifies key drawbacks, including the need for improved human interaction, policies against damaging messages, and training to reduce excessive email loads. The report also highlights the benefits of email, such as speed and reliability, and emphasizes the importance of high internet connectivity. Findings reveal low daily email sending rates, suggesting a need for policies promoting email use. The analysis examines attitudes towards email usage, considering factors like training, impact on recipients, and time pressure. The report uses descriptive statistics and visualizations to present the findings, offering recommendations for enhancing email communication and efficiency within the department. The report also includes figures that are discussed in the analysis.
Document Page
Introduction
Normally, every
organization have different
channels of
communication. As a
result, most organizations
have installed different
extensions that each staff
can use to communicate to
other colleagues. In
addition, some
organization have specific
emails like outlooks
created for
communication. However,
not all staff are active
when it comes to email
usage. In fact, there are
several drawbacks that are
in one way or the other
considered to be affecting
the use of emails at the
workplace. On this note,
the report identifies some
of these drawbacks as well
as ways of improving
email use at the education
department.
Materials and Methods
In order to present the
results, the study was
drawn from a population of
1010 participants including
males and females. In
addition, the data used was
from education department
on the use of emails. In
addition, SPSS version 24
was used for the analysis.
Again, charts including
pie-charts, bar graphs and
histograms were used to
visualize the results.
Descriptive statistics
including frequency
distribution and
percentages were used to
present, summarize and
describe the results.
Results
Main drawbacks are
identified below
Figure 1: Main drawbacks
Based on the results in
figure 1, the management
need to enhance human
interactions within the
departments. In addition,
there is need to develop
policies addressing and
prohibiting staff from
sending messages that in
one way or the other
damages people’s
reputations. Moreover, the
management need to
develop training materials
addressing ways of
reducing excessive loads.
Finally, there is need for
the management to
develop training materials
including fliers that show
how to manage time
adequately without any
wastage.
In addition, the figure 2
below shows the benefits
of using emails. From the
analysis, majority of the
email users; 77% likes the
speed and reliability part of
using the emails. Hence,
the management should
continue to ensure that
there is high internet
connectivity within the
workplaces to ensure that
email usage is at par and
that the staff can access
and response within the
shortest time possible
when it comes to using
emails. However,
immediate response is not
that good thus there is need
to encourage people to be
checking mails daily and
give responses on the same
since only 3% confirmed
availability of immediate
responses.
Figure 2: Benefits of email
using
Moreover, only about 67%
of the participants send 0-
21 emails daily which is
still low while only 1%
send about 70 emails per
day. Based on the analysis,
mails being sent in a day is
too low and therefore, the
management should make
it habit to adopt a policy on
daily using of mails. This
can be achieved by
increasing essential
communication channels to
be done via emails, (see
the figure 3 below).
tabler-icon-diamond-filled.svg

Paraphrase This Document

Need a fresh take? Get an instant paraphrase of this document with our AI Paraphraser
Document Page
Figure 3: Number of
emails being sent per day
The findings on the
attitude towards changing
the way the participants
use their emails are shown
in figure 4 below;
Figure 4: Attitudes
towards email usage
From the analysis in figure
4, only 36% are ready to
change their attitudes
towards using emails
unlike to 64% who are not
prepared to change their
attitudes towards email
usage. Based on the
results, the management
should develop training
materials that are able to
encourage the staff to
change and even like the
new way of
communicating to the
management based on the
email usage.
Furthermore, the results
shown in the bar graph
below indicate whether the
participants do consider
the impacts to the
recipients before sending
the emails.
Figure 5: Considering
impacts before sending
emails to the recipients
From the findings in figure
5, majority of the senders;
361 takes into
consideration on the issues
relating to the email
appearances and
interpretation of the
message being sent while
158 senders are keen on
the issues pertaining to the
time management before
sending the email.
According to the findings,
about 22 participants see
no issue at all while
sending mails indicating
that the use of emails
among the population is
still not viewed as an
important aspect of
communication hence the
management needs to
develop training materials
that in one way or the other
will form an important
aspect when it comes to
attitude change towards
email usage and reasons of
using email.
Moreover, the findings in
the figure 6 below indicate
that about 13% of the
email users have not been
trained for the past 12
months. Hence, as the
management team plans
for a new training, all the
13% should form part of
the staff to be trained in
order to enhance their
attitude towards email
using.
Figure 6: Received
trainings for the past 12
months
Figure 7: Specific
trainings received
According to the findings
in figure 7, majority of the
participants who received
trainings in the past 12
months indicate that they
had received a training
Document Page
related to software and
hardware while 7 and 8
participants received
trainings on the accredited
courses and content
management respectively.
In addition, the findings in
figure 8 indicate that on
average, the physical
distance between the
participants and the recipient
which is the widest is almost
10 which have an
approximate number of 258
individuals. On the other
hand, the results show that
the number of populations
using email is too few.
Figure 8: Distance between the
respondent and the recipient
Furthermore, the findings
established that on average
there is 189 individuals who
in one way or the other are
have indicated that they
communicate with a group
or individual with 10 in one
way or the other. Moreover,
at least 8 respondents with 1
have hinted that they do
communicate with a group
or individual in one way or
the other.
Figure 10: Communication with a
group or individual
The results in figure 11
indicates the findings on the
time pressure that the
participants may be under
while sending mails.
According to the findings,
many of the participants; 203
had the highest score of 9.8
followed by only the 3
participants with a score of 1
with the least level of
pressure experienced while
sending mails.
Figure 11: Time pressure that
participants may be under while
sending mails
Again, the findings show that
on any given workday, about
270 participants believed
that at least 10 emails are
manageable to send in a day.
This was closely followed by
170 participants who also
believed that at least 20
emails in a typical day can be
sent. On the other hand,
about 30 participants believe
that even one email is okay
for an average day to be
sent.
Figure 12: On an average workday,
average emails participants believe
that are manageable to send
Figure 13: On an average workday,
average emails participants believe
that are manageable to send
Moreover, the results of
figure 13 indicate that about
276 are leading with the
number of score when it
comes to whether the
content of what they wish to
communicate is suitable for
email or not. Unfortunately,
the proportions are equally
low when compared to the
total number of participants
Document Page
which is 1010. On the other
hand, at least 9 participants
had a score of 1 when it
comes to whether the
content of what they wish to
communicate is suitable for
email.
Figure 14: Whether the content of
what participants wish to
communicate is suitable for email
Finally, 126 participants seem to
be comfortable with a score of
10 when rating the how
comfortable the recipient is with
the use of email to communicate
followed by 27 participants who
appeared not to be comfortable
with the use of email to
communicate, (see figure 15
below).
Figure 15: How comfortable the
recipient is with the use of email to
communicate
chevron_up_icon
1 out of 4
circle_padding
hide_on_mobile
zoom_out_icon
[object Object]