Emergency Department Dataset Analysis: Data Science Project Report
VerifiedAdded on 2020/02/19
|20
|4752
|36
Project
AI Summary
This project presents an analysis of an emergency department dataset from a New South Wales hospital, focusing on identifying issues causing service delays and suggesting improvements. The analysis involves a group mind map to understand the problem, followed by the establishment of project justification and scope, which includes determining the processes patients undergo, their durations, and the most time-consuming stages. A detailed data dictionary outlines the data used, including patient arrival and departure times, triage categories, diagnoses, and time spent. A sample dataset is provided, and the exploration involves calculating average patient age, waiting and clinical care times, and identifying the most common diagnoses. The analysis plan outlines statistical operations like mean, maximum, minimum, totals, and modes to derive insights and inform recommendations for enhancing the emergency department's performance. The student's assignment aims to improve the efficiency of the emergency department.
Analysis of emergency department dataset 1
ANALYSIS OF EMERGENCY DEPARTMENT DATASET
By (student name)
[Student class]
[lecture name]
[Univwersity Name]
[University Town Name]
[Date]
ANALYSIS OF EMERGENCY DEPARTMENT DATASET
By (student name)
[Student class]
[lecture name]
[Univwersity Name]
[University Town Name]
[Date]
Paraphrase This Document
Need a fresh take? Get an instant paraphrase of this document with our AI Paraphraser
Analysis of emergency department dataset 2
Assignment 1
Group:
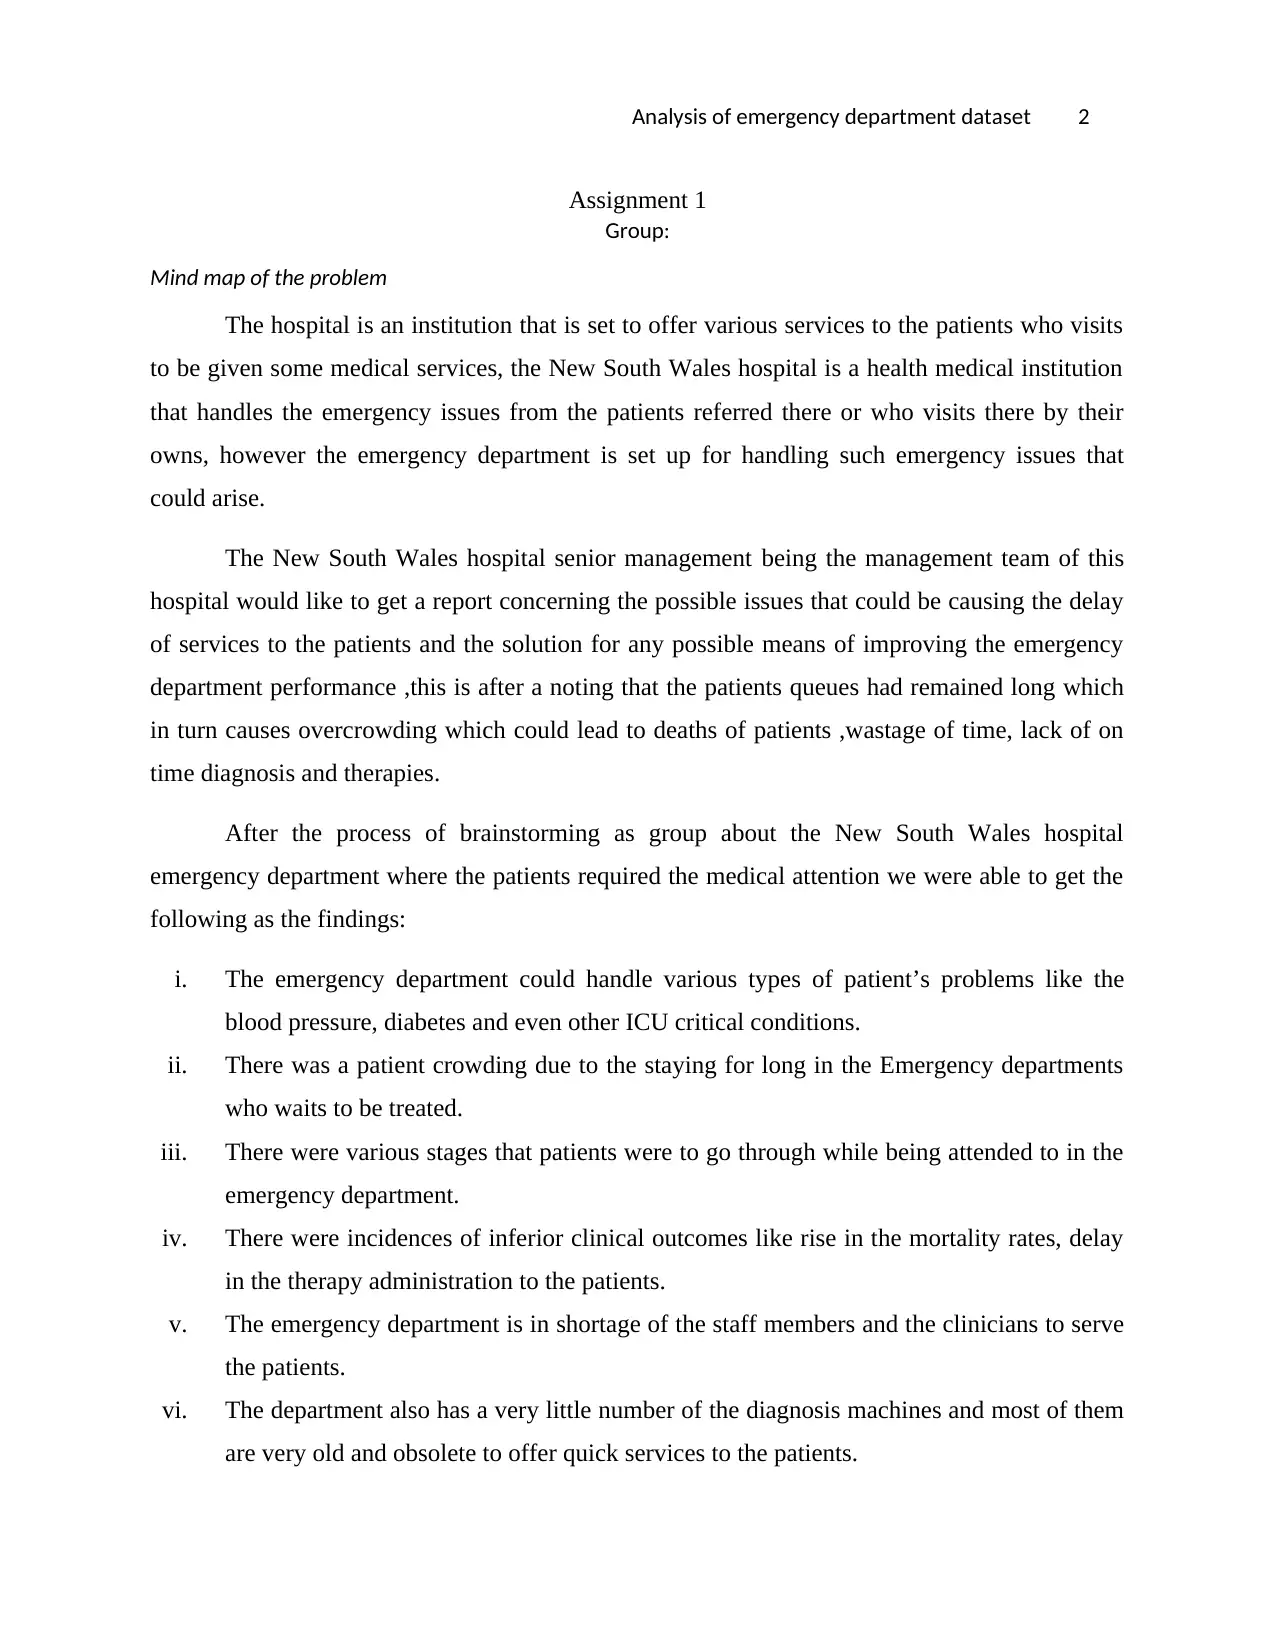
Mind map of the problem
The hospital is an institution that is set to offer various services to the patients who visits
to be given some medical services, the New South Wales hospital is a health medical institution
that handles the emergency issues from the patients referred there or who visits there by their
owns, however the emergency department is set up for handling such emergency issues that
could arise.
The New South Wales hospital senior management being the management team of this
hospital would like to get a report concerning the possible issues that could be causing the delay
of services to the patients and the solution for any possible means of improving the emergency
department performance ,this is after a noting that the patients queues had remained long which
in turn causes overcrowding which could lead to deaths of patients ,wastage of time, lack of on
time diagnosis and therapies.
After the process of brainstorming as group about the New South Wales hospital
emergency department where the patients required the medical attention we were able to get the
following as the findings:
i. The emergency department could handle various types of patient’s problems like the
blood pressure, diabetes and even other ICU critical conditions.
ii. There was a patient crowding due to the staying for long in the Emergency departments
who waits to be treated.
iii. There were various stages that patients were to go through while being attended to in the
emergency department.
iv. There were incidences of inferior clinical outcomes like rise in the mortality rates, delay
in the therapy administration to the patients.
v. The emergency department is in shortage of the staff members and the clinicians to serve
the patients.
vi. The department also has a very little number of the diagnosis machines and most of them
are very old and obsolete to offer quick services to the patients.
Assignment 1
Group:
Mind map of the problem
The hospital is an institution that is set to offer various services to the patients who visits
to be given some medical services, the New South Wales hospital is a health medical institution
that handles the emergency issues from the patients referred there or who visits there by their
owns, however the emergency department is set up for handling such emergency issues that
could arise.
The New South Wales hospital senior management being the management team of this
hospital would like to get a report concerning the possible issues that could be causing the delay
of services to the patients and the solution for any possible means of improving the emergency
department performance ,this is after a noting that the patients queues had remained long which
in turn causes overcrowding which could lead to deaths of patients ,wastage of time, lack of on
time diagnosis and therapies.
After the process of brainstorming as group about the New South Wales hospital
emergency department where the patients required the medical attention we were able to get the
following as the findings:
i. The emergency department could handle various types of patient’s problems like the
blood pressure, diabetes and even other ICU critical conditions.
ii. There was a patient crowding due to the staying for long in the Emergency departments
who waits to be treated.
iii. There were various stages that patients were to go through while being attended to in the
emergency department.
iv. There were incidences of inferior clinical outcomes like rise in the mortality rates, delay
in the therapy administration to the patients.
v. The emergency department is in shortage of the staff members and the clinicians to serve
the patients.
vi. The department also has a very little number of the diagnosis machines and most of them
are very old and obsolete to offer quick services to the patients.
Analysis of emergency department dataset 3
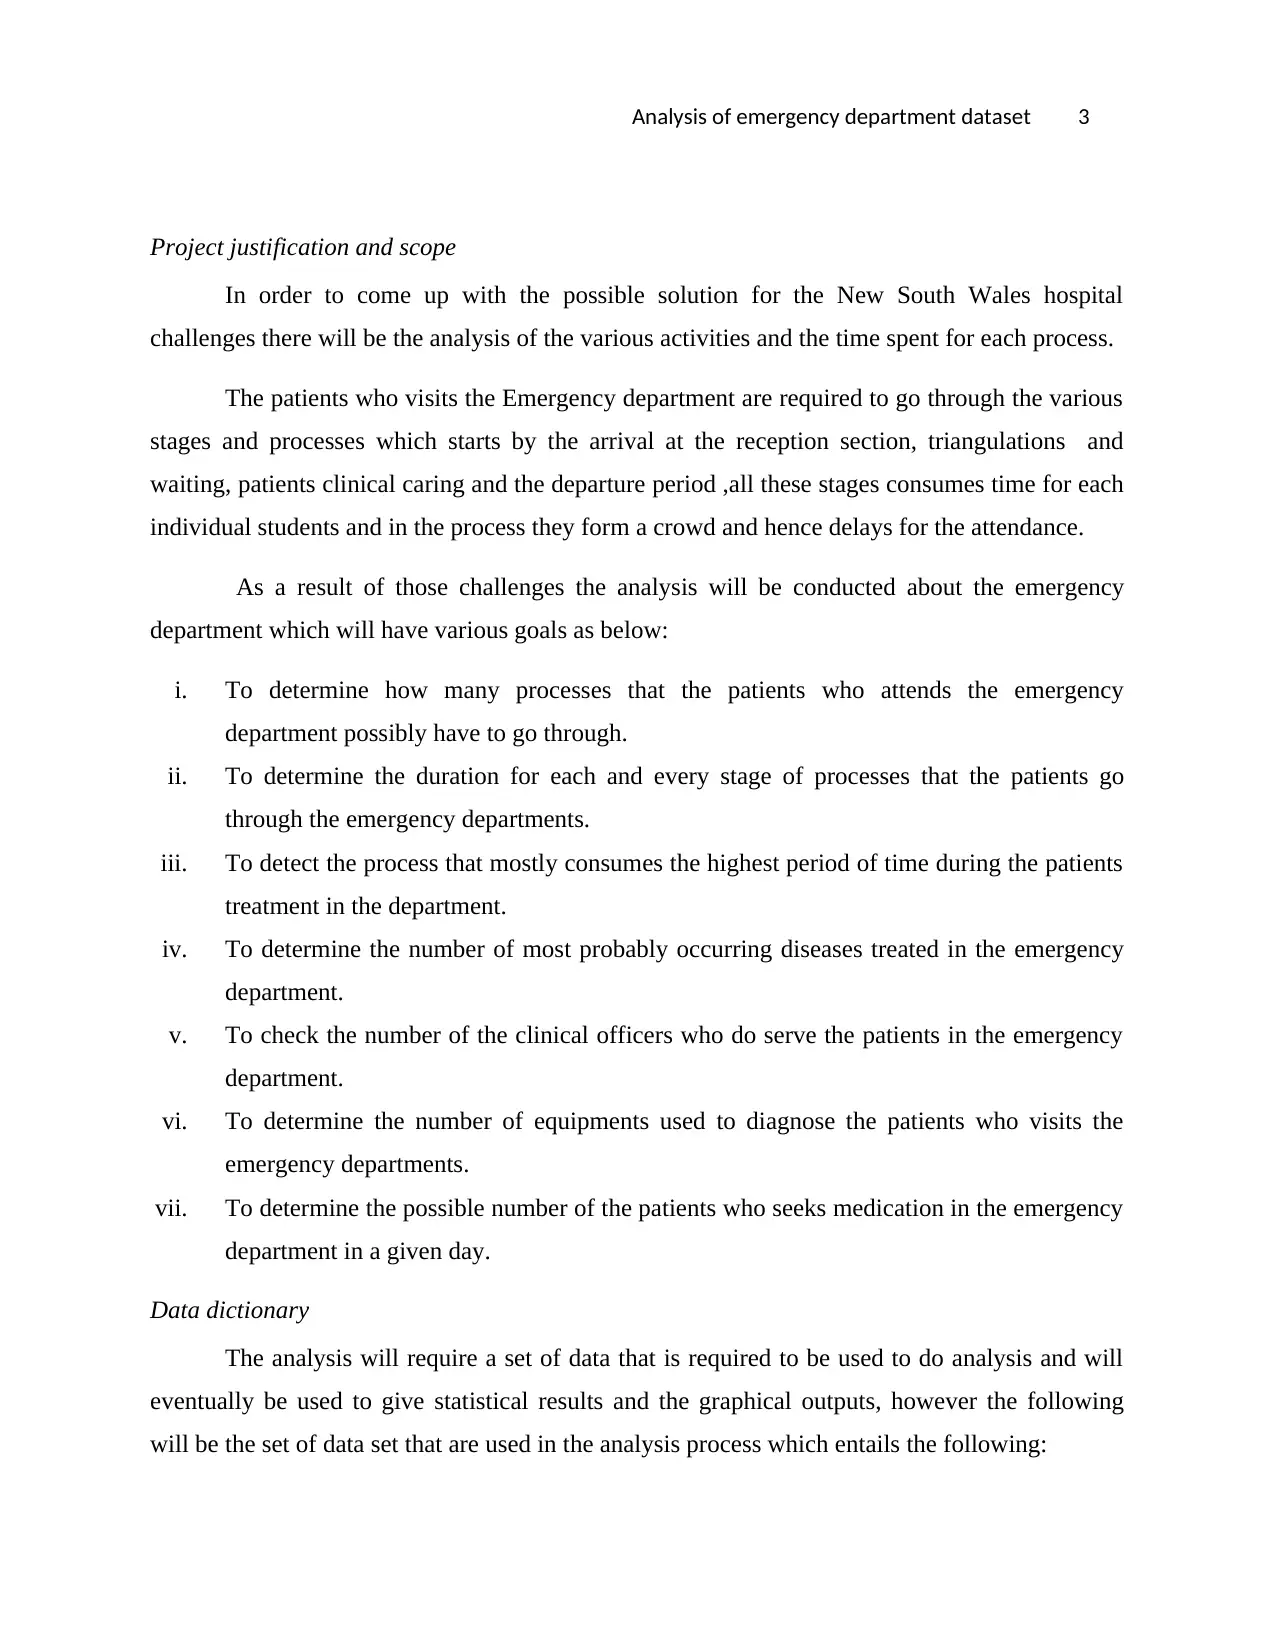
Project justification and scope
In order to come up with the possible solution for the New South Wales hospital
challenges there will be the analysis of the various activities and the time spent for each process.
The patients who visits the Emergency department are required to go through the various
stages and processes which starts by the arrival at the reception section, triangulations and
waiting, patients clinical caring and the departure period ,all these stages consumes time for each
individual students and in the process they form a crowd and hence delays for the attendance.
As a result of those challenges the analysis will be conducted about the emergency
department which will have various goals as below:
i. To determine how many processes that the patients who attends the emergency
department possibly have to go through.
ii. To determine the duration for each and every stage of processes that the patients go
through the emergency departments.
iii. To detect the process that mostly consumes the highest period of time during the patients
treatment in the department.
iv. To determine the number of most probably occurring diseases treated in the emergency
department.
v. To check the number of the clinical officers who do serve the patients in the emergency
department.
vi. To determine the number of equipments used to diagnose the patients who visits the
emergency departments.
vii. To determine the possible number of the patients who seeks medication in the emergency
department in a given day.
Data dictionary
The analysis will require a set of data that is required to be used to do analysis and will
eventually be used to give statistical results and the graphical outputs, however the following
will be the set of data set that are used in the analysis process which entails the following:
⊘ This is a preview!⊘
Do you want full access?
Subscribe today to unlock all pages.
Trusted by 1+ million students worldwide
Analysis of emergency department dataset 4
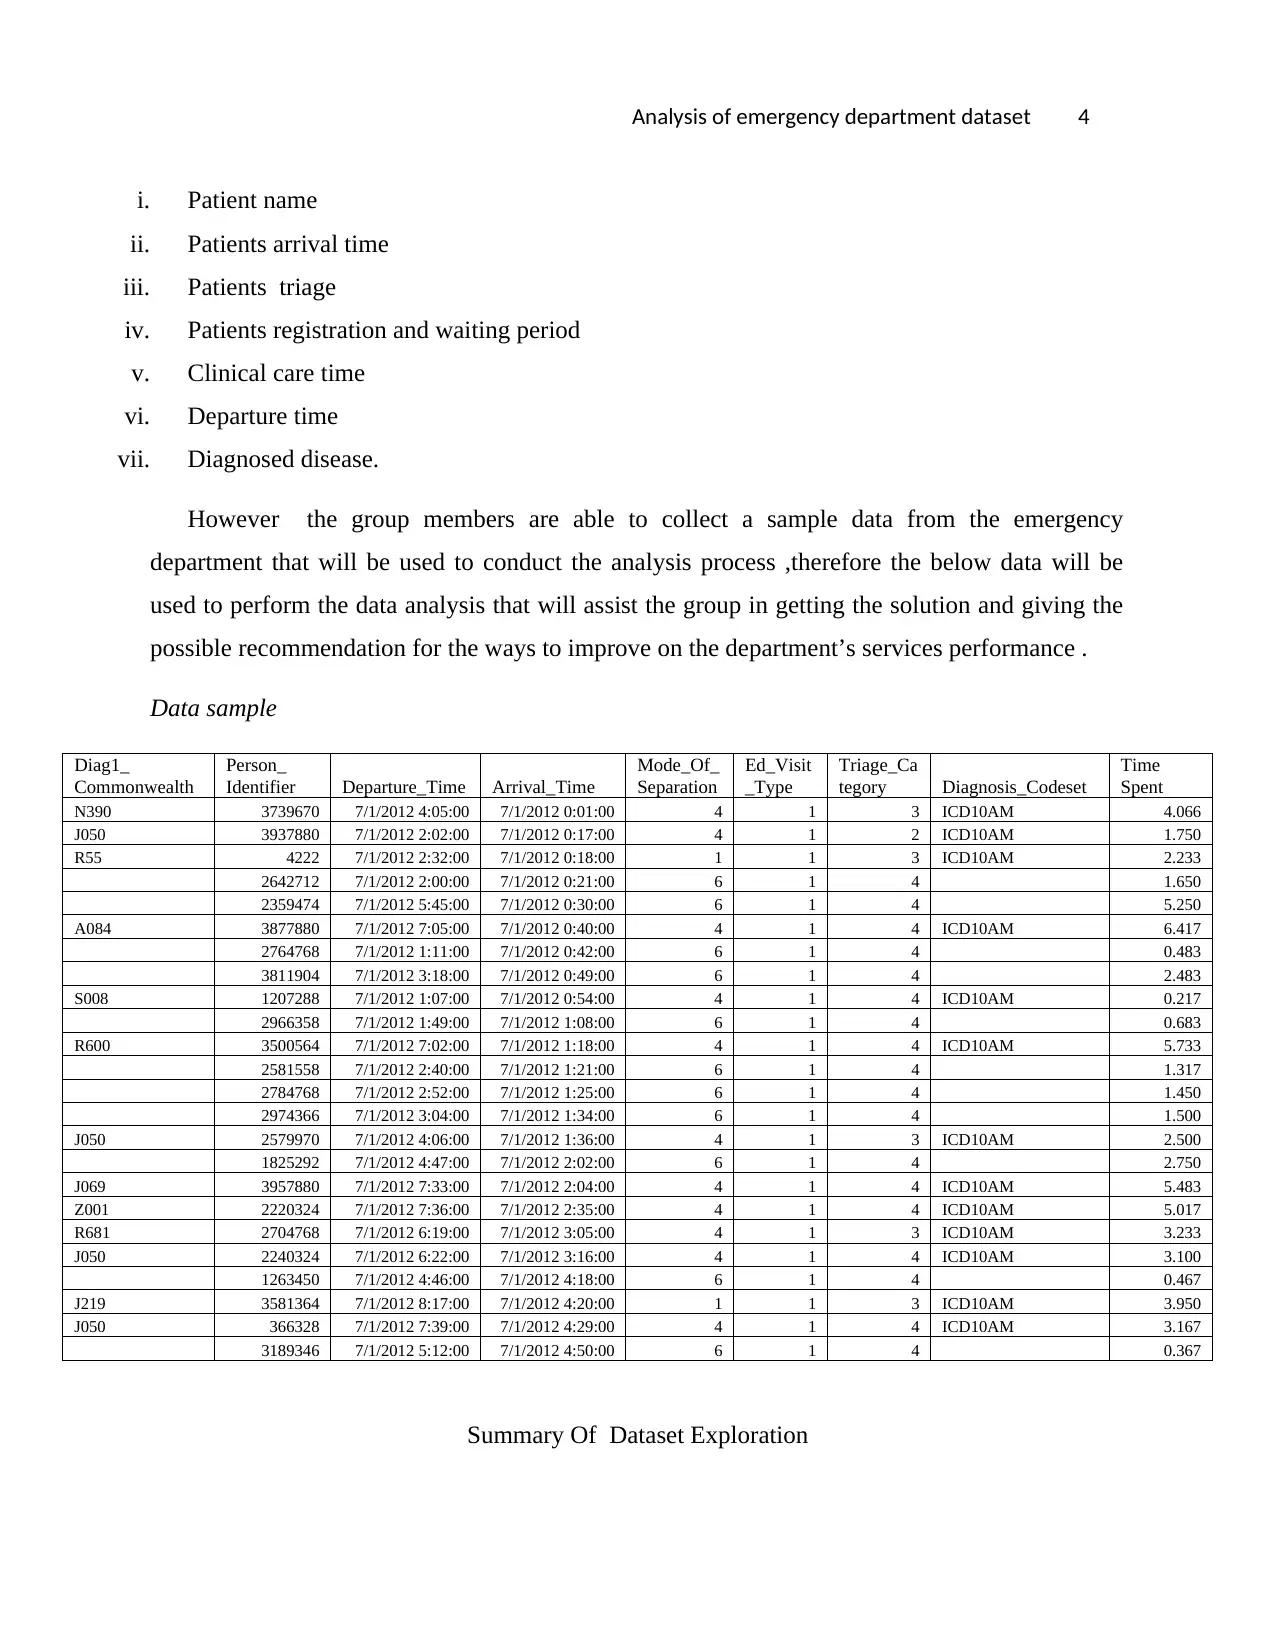
i. Patient name
ii. Patients arrival time
iii. Patients triage
iv. Patients registration and waiting period
v. Clinical care time
vi. Departure time
vii. Diagnosed disease.
However the group members are able to collect a sample data from the emergency
department that will be used to conduct the analysis process ,therefore the below data will be
used to perform the data analysis that will assist the group in getting the solution and giving the
possible recommendation for the ways to improve on the department’s services performance .
Data sample
Diag1_
Commonwealth
Person_
Identifier Departure_Time Arrival_Time
Mode_Of_
Separation
Ed_Visit
_Type
Triage_Ca
tegory Diagnosis_Codeset
Time
Spent
N390 3739670 7/1/2012 4:05:00 7/1/2012 0:01:00 4 1 3 ICD10AM 4.066
J050 3937880 7/1/2012 2:02:00 7/1/2012 0:17:00 4 1 2 ICD10AM 1.750
R55 4222 7/1/2012 2:32:00 7/1/2012 0:18:00 1 1 3 ICD10AM 2.233
2642712 7/1/2012 2:00:00 7/1/2012 0:21:00 6 1 4 1.650
2359474 7/1/2012 5:45:00 7/1/2012 0:30:00 6 1 4 5.250
A084 3877880 7/1/2012 7:05:00 7/1/2012 0:40:00 4 1 4 ICD10AM 6.417
2764768 7/1/2012 1:11:00 7/1/2012 0:42:00 6 1 4 0.483
3811904 7/1/2012 3:18:00 7/1/2012 0:49:00 6 1 4 2.483
S008 1207288 7/1/2012 1:07:00 7/1/2012 0:54:00 4 1 4 ICD10AM 0.217
2966358 7/1/2012 1:49:00 7/1/2012 1:08:00 6 1 4 0.683
R600 3500564 7/1/2012 7:02:00 7/1/2012 1:18:00 4 1 4 ICD10AM 5.733
2581558 7/1/2012 2:40:00 7/1/2012 1:21:00 6 1 4 1.317
2784768 7/1/2012 2:52:00 7/1/2012 1:25:00 6 1 4 1.450
2974366 7/1/2012 3:04:00 7/1/2012 1:34:00 6 1 4 1.500
J050 2579970 7/1/2012 4:06:00 7/1/2012 1:36:00 4 1 3 ICD10AM 2.500
1825292 7/1/2012 4:47:00 7/1/2012 2:02:00 6 1 4 2.750
J069 3957880 7/1/2012 7:33:00 7/1/2012 2:04:00 4 1 4 ICD10AM 5.483
Z001 2220324 7/1/2012 7:36:00 7/1/2012 2:35:00 4 1 4 ICD10AM 5.017
R681 2704768 7/1/2012 6:19:00 7/1/2012 3:05:00 4 1 3 ICD10AM 3.233
J050 2240324 7/1/2012 6:22:00 7/1/2012 3:16:00 4 1 4 ICD10AM 3.100
1263450 7/1/2012 4:46:00 7/1/2012 4:18:00 6 1 4 0.467
J219 3581364 7/1/2012 8:17:00 7/1/2012 4:20:00 1 1 3 ICD10AM 3.950
J050 366328 7/1/2012 7:39:00 7/1/2012 4:29:00 4 1 4 ICD10AM 3.167
3189346 7/1/2012 5:12:00 7/1/2012 4:50:00 6 1 4 0.367
Summary Of Dataset Exploration
Paraphrase This Document
Need a fresh take? Get an instant paraphrase of this document with our AI Paraphraser
Analysis of emergency department dataset 5
The above is the set of the data collected illustrating the data dictionary of the emergency
department that will be used to conduct the analysis to determine the possible causes of poor
performance and the results will give the incites on how to improve the services offered in the
emergency department.
Summaries of data exploration.
The data obtained from the emergency department is going to be used in the exploration
process this will enable us to get the facts and using the drawn facts one will be able to give the
conclusions and recommendations about the improving of the emergency department.
Collection of initial data.
The information to be used was collected through various means from the emergency
department , some of these methods are through observations , interviews and the from the
secondary sources from the organisation.
Data formats.
Below is the consolidated data set which is made of various variables which includes the
Patient name, Patients arrival time, Patients triage(years), Patients registration and waiting
period(hrs), Clinical care time (hours), Departure time (hours) and Diagnosed diseases as shown
in below sample of the data.
Diag1_
Commonwealth
Person_
Identifier Departure_Time Arrival_Time
Mode_Of_
Separation
Ed_Visit
_Type
Triage_Ca
tegory Diagnosis_Codeset
Time
Spent
N390 3739670 7/1/2012 4:05:00 7/1/2012 0:01:00 4 1 3 ICD10AM 4.066
J050 3937880 7/1/2012 2:02:00 7/1/2012 0:17:00 4 1 2 ICD10AM 1.750
R55 4222 7/1/2012 2:32:00 7/1/2012 0:18:00 1 1 3 ICD10AM 2.233
2642712 7/1/2012 2:00:00 7/1/2012 0:21:00 6 1 4 1.650
2359474 7/1/2012 5:45:00 7/1/2012 0:30:00 6 1 4 5.250
A084 3877880 7/1/2012 7:05:00 7/1/2012 0:40:00 4 1 4 ICD10AM 6.417
2764768 7/1/2012 1:11:00 7/1/2012 0:42:00 6 1 4 0.483
3811904 7/1/2012 3:18:00 7/1/2012 0:49:00 6 1 4 2.483
S008 1207288 7/1/2012 1:07:00 7/1/2012 0:54:00 4 1 4 ICD10AM 0.217
2966358 7/1/2012 1:49:00 7/1/2012 1:08:00 6 1 4 0.683
R600 3500564 7/1/2012 7:02:00 7/1/2012 1:18:00 4 1 4 ICD10AM 5.733
2581558 7/1/2012 2:40:00 7/1/2012 1:21:00 6 1 4 1.317
2784768 7/1/2012 2:52:00 7/1/2012 1:25:00 6 1 4 1.450
2974366 7/1/2012 3:04:00 7/1/2012 1:34:00 6 1 4 1.500
J050 2579970 7/1/2012 4:06:00 7/1/2012 1:36:00 4 1 3 ICD10AM 2.500
1825292 7/1/2012 4:47:00 7/1/2012 2:02:00 6 1 4 2.750
J069 3957880 7/1/2012 7:33:00 7/1/2012 2:04:00 4 1 4 ICD10AM 5.483
Analysis of emergency department dataset 6
Z001 2220324 7/1/2012 7:36:00 7/1/2012 2:35:00 4 1 4 ICD10AM 5.017
R681 2704768 7/1/2012 6:19:00 7/1/2012 3:05:00 4 1 3 ICD10AM 3.233
J050 2240324 7/1/2012 6:22:00 7/1/2012 3:16:00 4 1 4 ICD10AM 3.100
1263450 7/1/2012 4:46:00 7/1/2012 4:18:00 6 1 4 0.467
J219 3581364 7/1/2012 8:17:00 7/1/2012 4:20:00 1 1 3 ICD10AM 3.950
J050 366328 7/1/2012 7:39:00 7/1/2012 4:29:00 4 1 4 ICD10AM 3.167
3189346 7/1/2012 5:12:00 7/1/2012 4:50:00 6 1 4 0.367
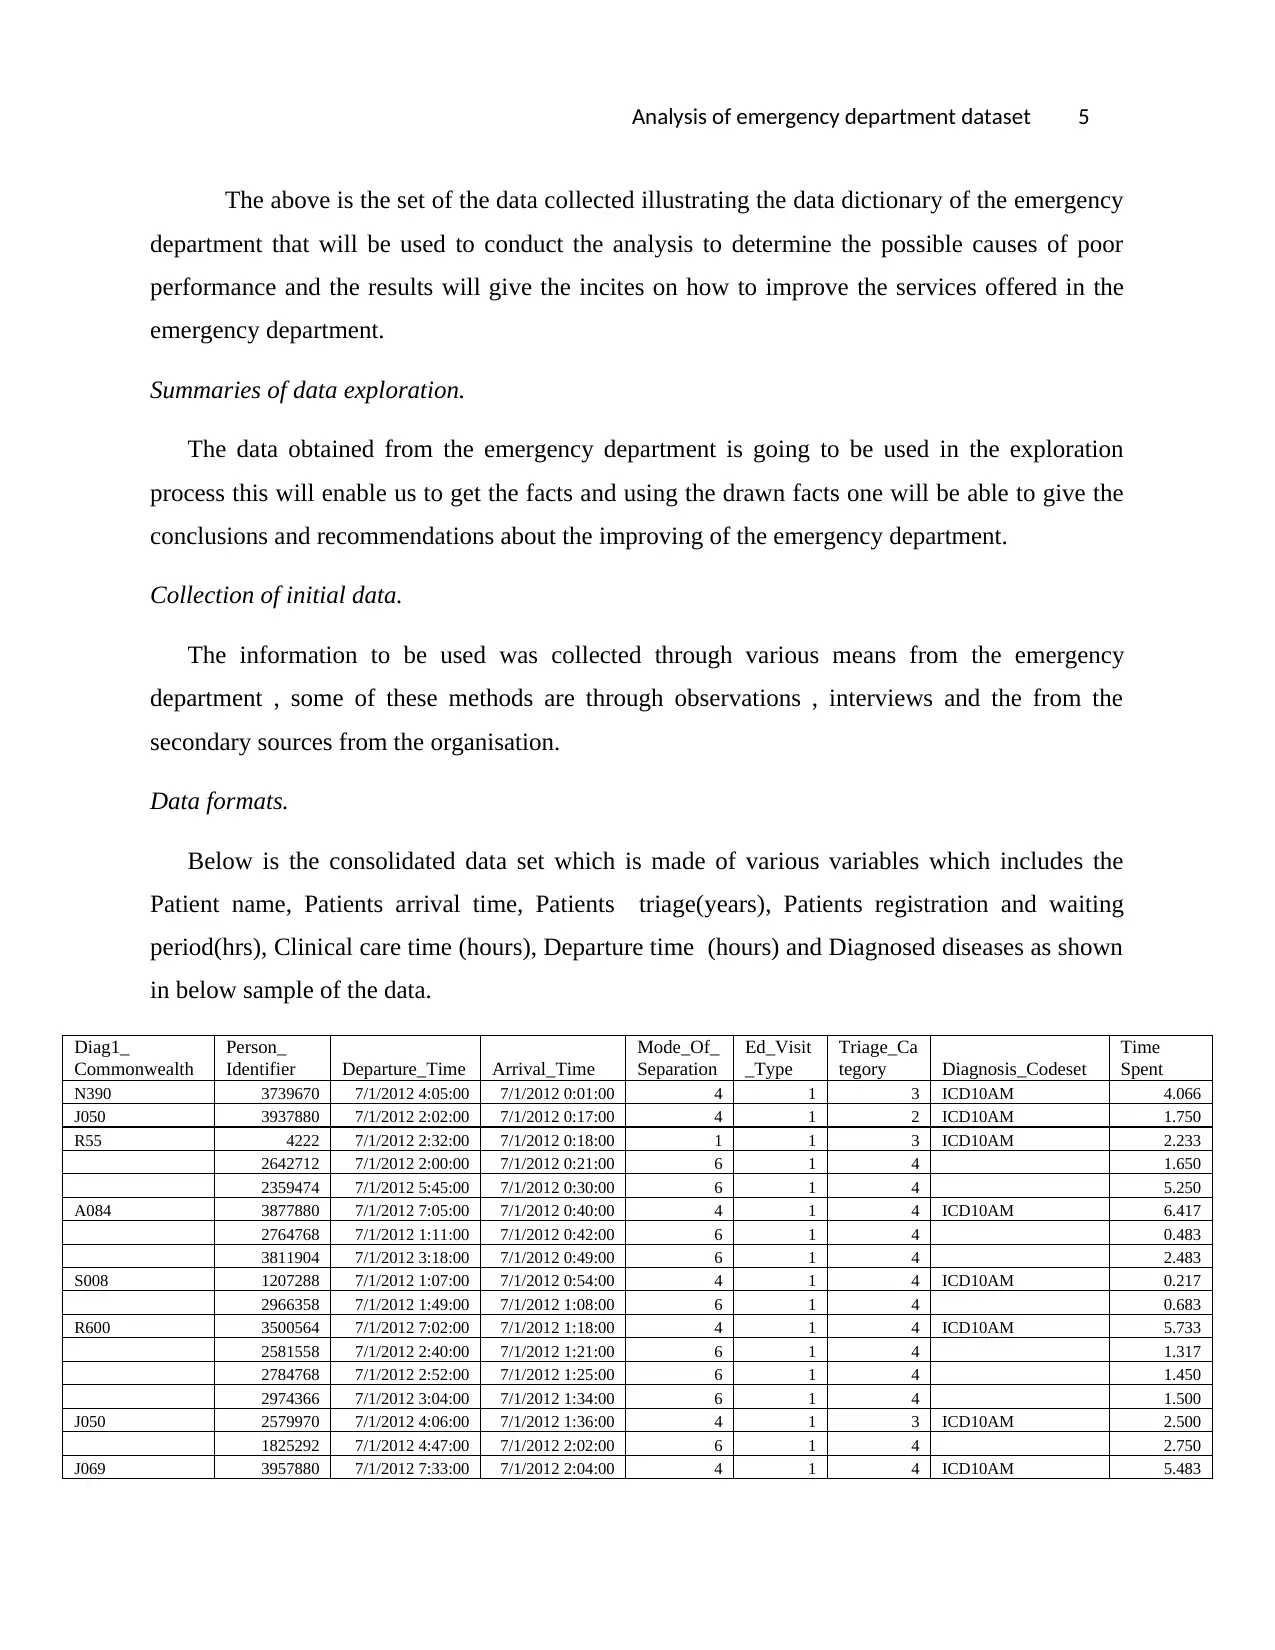
Exploring data.
The data above is analysed to give the overview of the emergency department activities
the analysis is carried out sing the analysis tool called Microsoft office excel this will be able to
give various measures of central tendency and display the respective graphs for easy visual
display and interpretations.
The data analysed will give the following measures.
i. Average patient age-16.4 years.
ii. The oldest patient-25 years
iii. Patients registration and waiting period-1.4 hours.
iv. Patients average clinical care time- 3.6 hours.
v. Total time spent by patients-18 hours.
vi. Most diagnosed diseases- Malaria.
Exploring the data.
The corrected data is required to be analysed and below is the result of the analysis
carried out in the above data which give the central tendencies in summarised form and the
graphical representations as below:
Diag1_
Commonwealth
Person_
Identifier Departure_Time Arrival_Time
Mode_Of_
Separation
Ed_Visit
_Type
Triage_Ca
tegory Diagnosis_Codeset
Time
Spent
N390 3739670 7/1/2012 4:05:00 7/1/2012 0:01:00 4 1 3 ICD10AM 4.066
J050 3937880 7/1/2012 2:02:00 7/1/2012 0:17:00 4 1 2 ICD10AM 1.750
R55 4222 7/1/2012 2:32:00 7/1/2012 0:18:00 1 1 3 ICD10AM 2.233
2642712 7/1/2012 2:00:00 7/1/2012 0:21:00 6 1 4 1.650
2359474 7/1/2012 5:45:00 7/1/2012 0:30:00 6 1 4 5.250
A084 3877880 7/1/2012 7:05:00 7/1/2012 0:40:00 4 1 4 ICD10AM 6.417
2764768 7/1/2012 1:11:00 7/1/2012 0:42:00 6 1 4 0.483
3811904 7/1/2012 3:18:00 7/1/2012 0:49:00 6 1 4 2.483
S008 1207288 7/1/2012 1:07:00 7/1/2012 0:54:00 4 1 4 ICD10AM 0.217
2966358 7/1/2012 1:49:00 7/1/2012 1:08:00 6 1 4 0.683
Z001 2220324 7/1/2012 7:36:00 7/1/2012 2:35:00 4 1 4 ICD10AM 5.017
R681 2704768 7/1/2012 6:19:00 7/1/2012 3:05:00 4 1 3 ICD10AM 3.233
J050 2240324 7/1/2012 6:22:00 7/1/2012 3:16:00 4 1 4 ICD10AM 3.100
1263450 7/1/2012 4:46:00 7/1/2012 4:18:00 6 1 4 0.467
J219 3581364 7/1/2012 8:17:00 7/1/2012 4:20:00 1 1 3 ICD10AM 3.950
J050 366328 7/1/2012 7:39:00 7/1/2012 4:29:00 4 1 4 ICD10AM 3.167
3189346 7/1/2012 5:12:00 7/1/2012 4:50:00 6 1 4 0.367
Exploring data.
The data above is analysed to give the overview of the emergency department activities
the analysis is carried out sing the analysis tool called Microsoft office excel this will be able to
give various measures of central tendency and display the respective graphs for easy visual
display and interpretations.
The data analysed will give the following measures.
i. Average patient age-16.4 years.
ii. The oldest patient-25 years
iii. Patients registration and waiting period-1.4 hours.
iv. Patients average clinical care time- 3.6 hours.
v. Total time spent by patients-18 hours.
vi. Most diagnosed diseases- Malaria.
Exploring the data.
The corrected data is required to be analysed and below is the result of the analysis
carried out in the above data which give the central tendencies in summarised form and the
graphical representations as below:
Diag1_
Commonwealth
Person_
Identifier Departure_Time Arrival_Time
Mode_Of_
Separation
Ed_Visit
_Type
Triage_Ca
tegory Diagnosis_Codeset
Time
Spent
N390 3739670 7/1/2012 4:05:00 7/1/2012 0:01:00 4 1 3 ICD10AM 4.066
J050 3937880 7/1/2012 2:02:00 7/1/2012 0:17:00 4 1 2 ICD10AM 1.750
R55 4222 7/1/2012 2:32:00 7/1/2012 0:18:00 1 1 3 ICD10AM 2.233
2642712 7/1/2012 2:00:00 7/1/2012 0:21:00 6 1 4 1.650
2359474 7/1/2012 5:45:00 7/1/2012 0:30:00 6 1 4 5.250
A084 3877880 7/1/2012 7:05:00 7/1/2012 0:40:00 4 1 4 ICD10AM 6.417
2764768 7/1/2012 1:11:00 7/1/2012 0:42:00 6 1 4 0.483
3811904 7/1/2012 3:18:00 7/1/2012 0:49:00 6 1 4 2.483
S008 1207288 7/1/2012 1:07:00 7/1/2012 0:54:00 4 1 4 ICD10AM 0.217
2966358 7/1/2012 1:49:00 7/1/2012 1:08:00 6 1 4 0.683
⊘ This is a preview!⊘
Do you want full access?
Subscribe today to unlock all pages.
Trusted by 1+ million students worldwide
Analysis of emergency department dataset 7
R600 3500564 7/1/2012 7:02:00 7/1/2012 1:18:00 4 1 4 ICD10AM 5.733
2581558 7/1/2012 2:40:00 7/1/2012 1:21:00 6 1 4 1.317
2784768 7/1/2012 2:52:00 7/1/2012 1:25:00 6 1 4 1.450
2974366 7/1/2012 3:04:00 7/1/2012 1:34:00 6 1 4 1.500
J050 2579970 7/1/2012 4:06:00 7/1/2012 1:36:00 4 1 3 ICD10AM 2.500
1825292 7/1/2012 4:47:00 7/1/2012 2:02:00 6 1 4 2.750
J069 3957880 7/1/2012 7:33:00 7/1/2012 2:04:00 4 1 4 ICD10AM 5.483
Z001 2220324 7/1/2012 7:36:00 7/1/2012 2:35:00 4 1 4 ICD10AM 5.017
R681 2704768 7/1/2012 6:19:00 7/1/2012 3:05:00 4 1 3 ICD10AM 3.233
J050 2240324 7/1/2012 6:22:00 7/1/2012 3:16:00 4 1 4 ICD10AM 3.100
1263450 7/1/2012 4:46:00 7/1/2012 4:18:00 6 1 4 0.467
J219 3581364 7/1/2012 8:17:00 7/1/2012 4:20:00 1 1 3 ICD10AM 3.950
J050 366328 7/1/2012 7:39:00 7/1/2012 4:29:00 4 1 4 ICD10AM 3.167
3189346 7/1/2012 5:12:00 7/1/2012 4:50:00 6 1 4 0.367
Verifying the data qualities.
The above data set is the accurate and no of the data that is beyond the data set or it is an outlier
however the data is having the appropriate data integrity constraints.
Analysis Plan
Data analysis plan.
The data collected from the Emergency department is going to be used in the various
decisions makings and suggestions to improve the performance.
Paraphrase This Document
Need a fresh take? Get an instant paraphrase of this document with our AI Paraphraser
Analysis of emergency department dataset 8
The analysis plan will have the type of statistical operations to be carried out and their
justifications together with the possible assumptions made.
However the following are the statistical operations done :
i. Mean –This is the average of the age of the patients,waiting time, clinic time
spent and the departure time.
ii. Maximum-This is the maximum of the age of the patients, patient’s waiting time,
patients’ clinic time spent and patients’ the departure time.
iii. Minimum- This is the minimum of the age of the patients, patient’s waiting time,
patients’ clinic time spent and patients’ the departure time.
iv. Totals- This is the total of the age of the patients, patient’s waiting time, patients’
clinic time spent and patients’ the departure time
v. Modes-The mode was used to show the most treated type of illness or condition in
the emergency department.
However the only few assumptions made during the data analysis was:
i. The patient’s age was not beyond 25 years.
ii. The patient’s record was captured once.
iii. There was only one doctor in the emergency department.
iv. The diagnosis equipment that was used was only one.
v. All data collected was pure and accurate.
Individual
Bibliography
Below are some of the bibliography used:
Grace,.B.,(2006). Sturctural Equation Modeling and Natural Systems. Cambridge University
Press,volume.1
Bollen, K., (2014). Interpreting the results from multiple regression and structural equation
models. Bulletin of the Ecological Society of America ,volume. 1.
Data construction
Analysis of emergency department dataset 9
The emergency department is serving the patients as their clients who are the
patients ,however the data dictionary below will be used for the purpose of data constructions
where all the attributes are clearly indicated as follows:
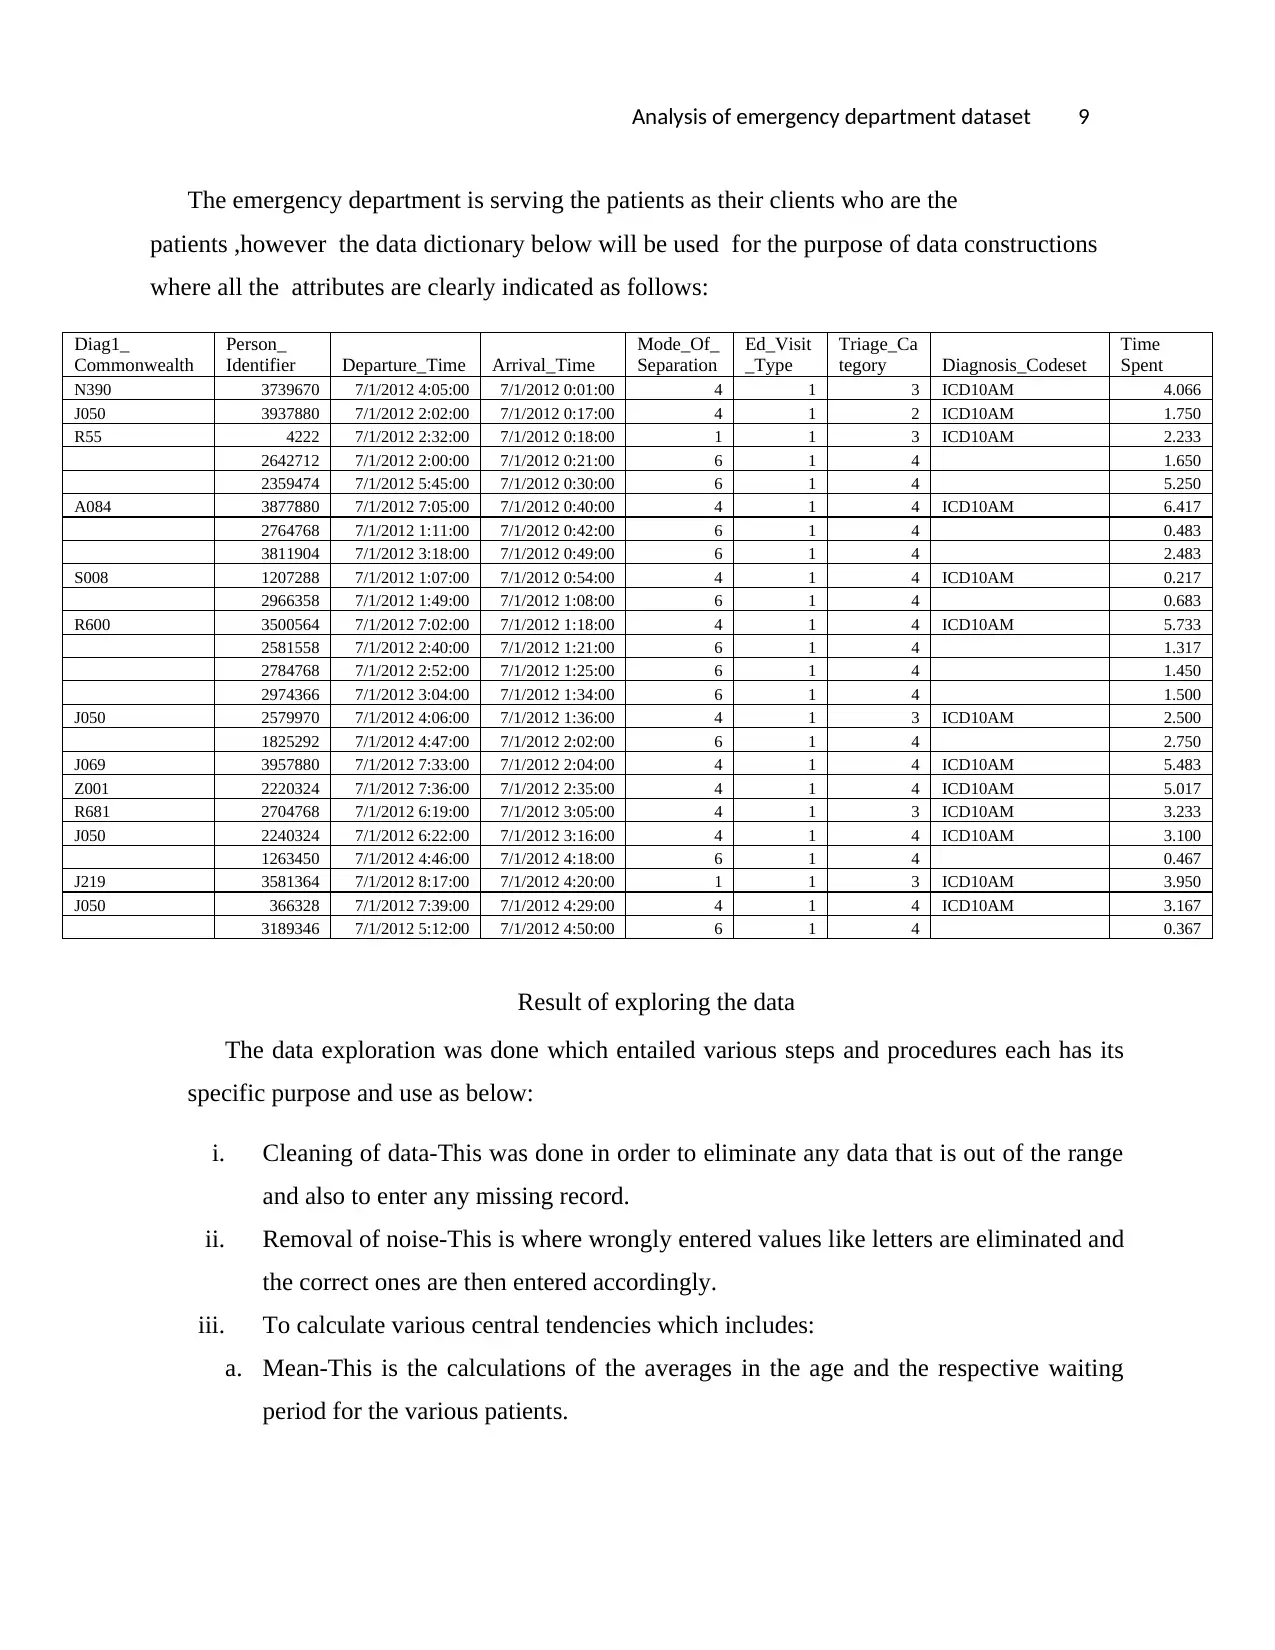
Diag1_
Commonwealth
Person_
Identifier Departure_Time Arrival_Time
Mode_Of_
Separation
Ed_Visit
_Type
Triage_Ca
tegory Diagnosis_Codeset
Time
Spent
N390 3739670 7/1/2012 4:05:00 7/1/2012 0:01:00 4 1 3 ICD10AM 4.066
J050 3937880 7/1/2012 2:02:00 7/1/2012 0:17:00 4 1 2 ICD10AM 1.750
R55 4222 7/1/2012 2:32:00 7/1/2012 0:18:00 1 1 3 ICD10AM 2.233
2642712 7/1/2012 2:00:00 7/1/2012 0:21:00 6 1 4 1.650
2359474 7/1/2012 5:45:00 7/1/2012 0:30:00 6 1 4 5.250
A084 3877880 7/1/2012 7:05:00 7/1/2012 0:40:00 4 1 4 ICD10AM 6.417
2764768 7/1/2012 1:11:00 7/1/2012 0:42:00 6 1 4 0.483
3811904 7/1/2012 3:18:00 7/1/2012 0:49:00 6 1 4 2.483
S008 1207288 7/1/2012 1:07:00 7/1/2012 0:54:00 4 1 4 ICD10AM 0.217
2966358 7/1/2012 1:49:00 7/1/2012 1:08:00 6 1 4 0.683
R600 3500564 7/1/2012 7:02:00 7/1/2012 1:18:00 4 1 4 ICD10AM 5.733
2581558 7/1/2012 2:40:00 7/1/2012 1:21:00 6 1 4 1.317
2784768 7/1/2012 2:52:00 7/1/2012 1:25:00 6 1 4 1.450
2974366 7/1/2012 3:04:00 7/1/2012 1:34:00 6 1 4 1.500
J050 2579970 7/1/2012 4:06:00 7/1/2012 1:36:00 4 1 3 ICD10AM 2.500
1825292 7/1/2012 4:47:00 7/1/2012 2:02:00 6 1 4 2.750
J069 3957880 7/1/2012 7:33:00 7/1/2012 2:04:00 4 1 4 ICD10AM 5.483
Z001 2220324 7/1/2012 7:36:00 7/1/2012 2:35:00 4 1 4 ICD10AM 5.017
R681 2704768 7/1/2012 6:19:00 7/1/2012 3:05:00 4 1 3 ICD10AM 3.233
J050 2240324 7/1/2012 6:22:00 7/1/2012 3:16:00 4 1 4 ICD10AM 3.100
1263450 7/1/2012 4:46:00 7/1/2012 4:18:00 6 1 4 0.467
J219 3581364 7/1/2012 8:17:00 7/1/2012 4:20:00 1 1 3 ICD10AM 3.950
J050 366328 7/1/2012 7:39:00 7/1/2012 4:29:00 4 1 4 ICD10AM 3.167
3189346 7/1/2012 5:12:00 7/1/2012 4:50:00 6 1 4 0.367
Result of exploring the data
The data exploration was done which entailed various steps and procedures each has its
specific purpose and use as below:
i. Cleaning of data-This was done in order to eliminate any data that is out of the range
and also to enter any missing record.
ii. Removal of noise-This is where wrongly entered values like letters are eliminated and
the correct ones are then entered accordingly.
iii. To calculate various central tendencies which includes:
a. Mean-This is the calculations of the averages in the age and the respective waiting
period for the various patients.
The emergency department is serving the patients as their clients who are the
patients ,however the data dictionary below will be used for the purpose of data constructions
where all the attributes are clearly indicated as follows:
Diag1_
Commonwealth
Person_
Identifier Departure_Time Arrival_Time
Mode_Of_
Separation
Ed_Visit
_Type
Triage_Ca
tegory Diagnosis_Codeset
Time
Spent
N390 3739670 7/1/2012 4:05:00 7/1/2012 0:01:00 4 1 3 ICD10AM 4.066
J050 3937880 7/1/2012 2:02:00 7/1/2012 0:17:00 4 1 2 ICD10AM 1.750
R55 4222 7/1/2012 2:32:00 7/1/2012 0:18:00 1 1 3 ICD10AM 2.233
2642712 7/1/2012 2:00:00 7/1/2012 0:21:00 6 1 4 1.650
2359474 7/1/2012 5:45:00 7/1/2012 0:30:00 6 1 4 5.250
A084 3877880 7/1/2012 7:05:00 7/1/2012 0:40:00 4 1 4 ICD10AM 6.417
2764768 7/1/2012 1:11:00 7/1/2012 0:42:00 6 1 4 0.483
3811904 7/1/2012 3:18:00 7/1/2012 0:49:00 6 1 4 2.483
S008 1207288 7/1/2012 1:07:00 7/1/2012 0:54:00 4 1 4 ICD10AM 0.217
2966358 7/1/2012 1:49:00 7/1/2012 1:08:00 6 1 4 0.683
R600 3500564 7/1/2012 7:02:00 7/1/2012 1:18:00 4 1 4 ICD10AM 5.733
2581558 7/1/2012 2:40:00 7/1/2012 1:21:00 6 1 4 1.317
2784768 7/1/2012 2:52:00 7/1/2012 1:25:00 6 1 4 1.450
2974366 7/1/2012 3:04:00 7/1/2012 1:34:00 6 1 4 1.500
J050 2579970 7/1/2012 4:06:00 7/1/2012 1:36:00 4 1 3 ICD10AM 2.500
1825292 7/1/2012 4:47:00 7/1/2012 2:02:00 6 1 4 2.750
J069 3957880 7/1/2012 7:33:00 7/1/2012 2:04:00 4 1 4 ICD10AM 5.483
Z001 2220324 7/1/2012 7:36:00 7/1/2012 2:35:00 4 1 4 ICD10AM 5.017
R681 2704768 7/1/2012 6:19:00 7/1/2012 3:05:00 4 1 3 ICD10AM 3.233
J050 2240324 7/1/2012 6:22:00 7/1/2012 3:16:00 4 1 4 ICD10AM 3.100
1263450 7/1/2012 4:46:00 7/1/2012 4:18:00 6 1 4 0.467
J219 3581364 7/1/2012 8:17:00 7/1/2012 4:20:00 1 1 3 ICD10AM 3.950
J050 366328 7/1/2012 7:39:00 7/1/2012 4:29:00 4 1 4 ICD10AM 3.167
3189346 7/1/2012 5:12:00 7/1/2012 4:50:00 6 1 4 0.367
Result of exploring the data
The data exploration was done which entailed various steps and procedures each has its
specific purpose and use as below:
i. Cleaning of data-This was done in order to eliminate any data that is out of the range
and also to enter any missing record.
ii. Removal of noise-This is where wrongly entered values like letters are eliminated and
the correct ones are then entered accordingly.
iii. To calculate various central tendencies which includes:
a. Mean-This is the calculations of the averages in the age and the respective waiting
period for the various patients.
⊘ This is a preview!⊘
Do you want full access?
Subscribe today to unlock all pages.
Trusted by 1+ million students worldwide
Analysis of emergency department dataset 10
b. Mode-This is used to identify the most occurrence emergency incidences that are
handled by the emergency department.
c. Maximum-This is used to identify the maximum values of all variables used in the
data dictionary.
d. Minimum- This is used to identify the maximum values of all variables used in the
data dictionary.
The below are the steps that are used to perform the exploration of the data for the emergency
department as follows :
Variable Identification
The data set has a set of variables which will be used to do analysis of the processes in the
emergency department and the respective time.
Below are the variables to be used:
Diag1_
Commonwealth
Person_
Identifier Departure_Time Arrival_Time
Mode_Of_
Separation
Ed_Visit
_Type
Triage_Ca
tegory Diagnosis_Codeset
Time
Spent
N390 3739670 7/1/2012 4:05:00 7/1/2012 0:01:00 4 1 3 ICD10AM 4.066
J050 3937880 7/1/2012 2:02:00 7/1/2012 0:17:00 4 1 2 ICD10AM 1.750
R55 4222 7/1/2012 2:32:00 7/1/2012 0:18:00 1 1 3 ICD10AM 2.233
2642712 7/1/2012 2:00:00 7/1/2012 0:21:00 6 1 4 1.650
2359474 7/1/2012 5:45:00 7/1/2012 0:30:00 6 1 4 5.250
A084 3877880 7/1/2012 7:05:00 7/1/2012 0:40:00 4 1 4 ICD10AM 6.417
2764768 7/1/2012 1:11:00 7/1/2012 0:42:00 6 1 4 0.483
3811904 7/1/2012 3:18:00 7/1/2012 0:49:00 6 1 4 2.483
S008 1207288 7/1/2012 1:07:00 7/1/2012 0:54:00 4 1 4 ICD10AM 0.217
2966358 7/1/2012 1:49:00 7/1/2012 1:08:00 6 1 4 0.683
R600 3500564 7/1/2012 7:02:00 7/1/2012 1:18:00 4 1 4 ICD10AM 5.733
2581558 7/1/2012 2:40:00 7/1/2012 1:21:00 6 1 4 1.317
2784768 7/1/2012 2:52:00 7/1/2012 1:25:00 6 1 4 1.450
2974366 7/1/2012 3:04:00 7/1/2012 1:34:00 6 1 4 1.500
J050 2579970 7/1/2012 4:06:00 7/1/2012 1:36:00 4 1 3 ICD10AM 2.500
1825292 7/1/2012 4:47:00 7/1/2012 2:02:00 6 1 4 2.750
J069 3957880 7/1/2012 7:33:00 7/1/2012 2:04:00 4 1 4 ICD10AM 5.483
Z001 2220324 7/1/2012 7:36:00 7/1/2012 2:35:00 4 1 4 ICD10AM 5.017
R681 2704768 7/1/2012 6:19:00 7/1/2012 3:05:00 4 1 3 ICD10AM 3.233
J050 2240324 7/1/2012 6:22:00 7/1/2012 3:16:00 4 1 4 ICD10AM 3.100
1263450 7/1/2012 4:46:00 7/1/2012 4:18:00 6 1 4 0.467
J219 3581364 7/1/2012 8:17:00 7/1/2012 4:20:00 1 1 3 ICD10AM 3.950
J050 366328 7/1/2012 7:39:00 7/1/2012 4:29:00 4 1 4 ICD10AM 3.167
3189346 7/1/2012 5:12:00 7/1/2012 4:50:00 6 1 4 0.367
Paraphrase This Document
Need a fresh take? Get an instant paraphrase of this document with our AI Paraphraser
Analysis of emergency department dataset 11
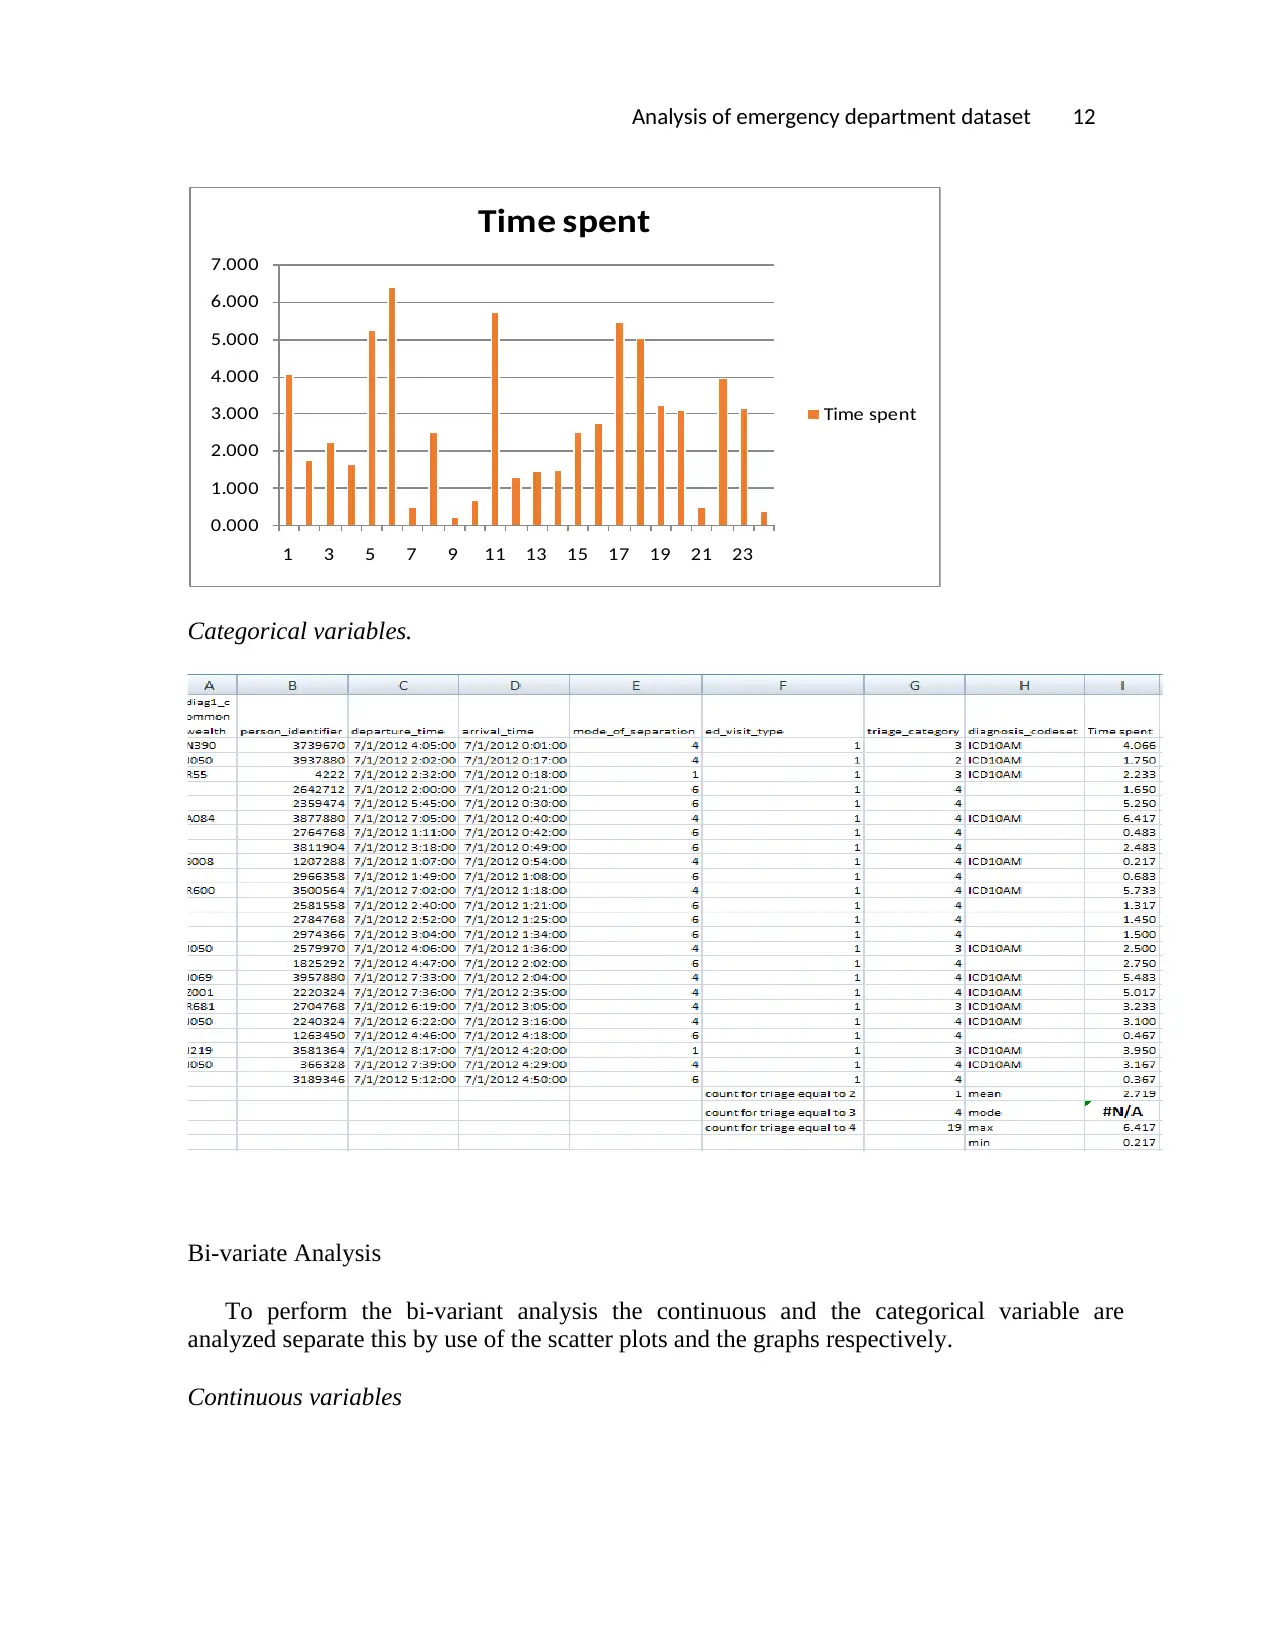
Type of variables Data types Variable categories
Prediactor variable
Diag1_Commonwealth
Person_Identifier
Departure_Time
Arrival_Time
Mode_Of_Separation
Ed_Visit_Type
Triage_Category
Diagnosis_Codeset
Target variable
Time Spent
Character
Diag1_Commonwealth
Diagnosis_Codeset
DateTime
Departure_Time
Arrival_Time
Numerical
Person_Identifier
Mode_Of_Separation
Ed_Visit_Type
Triage_Category
Time Spent
Categorical
Diag1_Commonwealth
Diagnosis_Codeset
Person_Identifier
Mode_Of_Separation
Ed_Visit_Type
Triage_Category
Continuous
Departure_Time
Arrival_Time
Time Spent
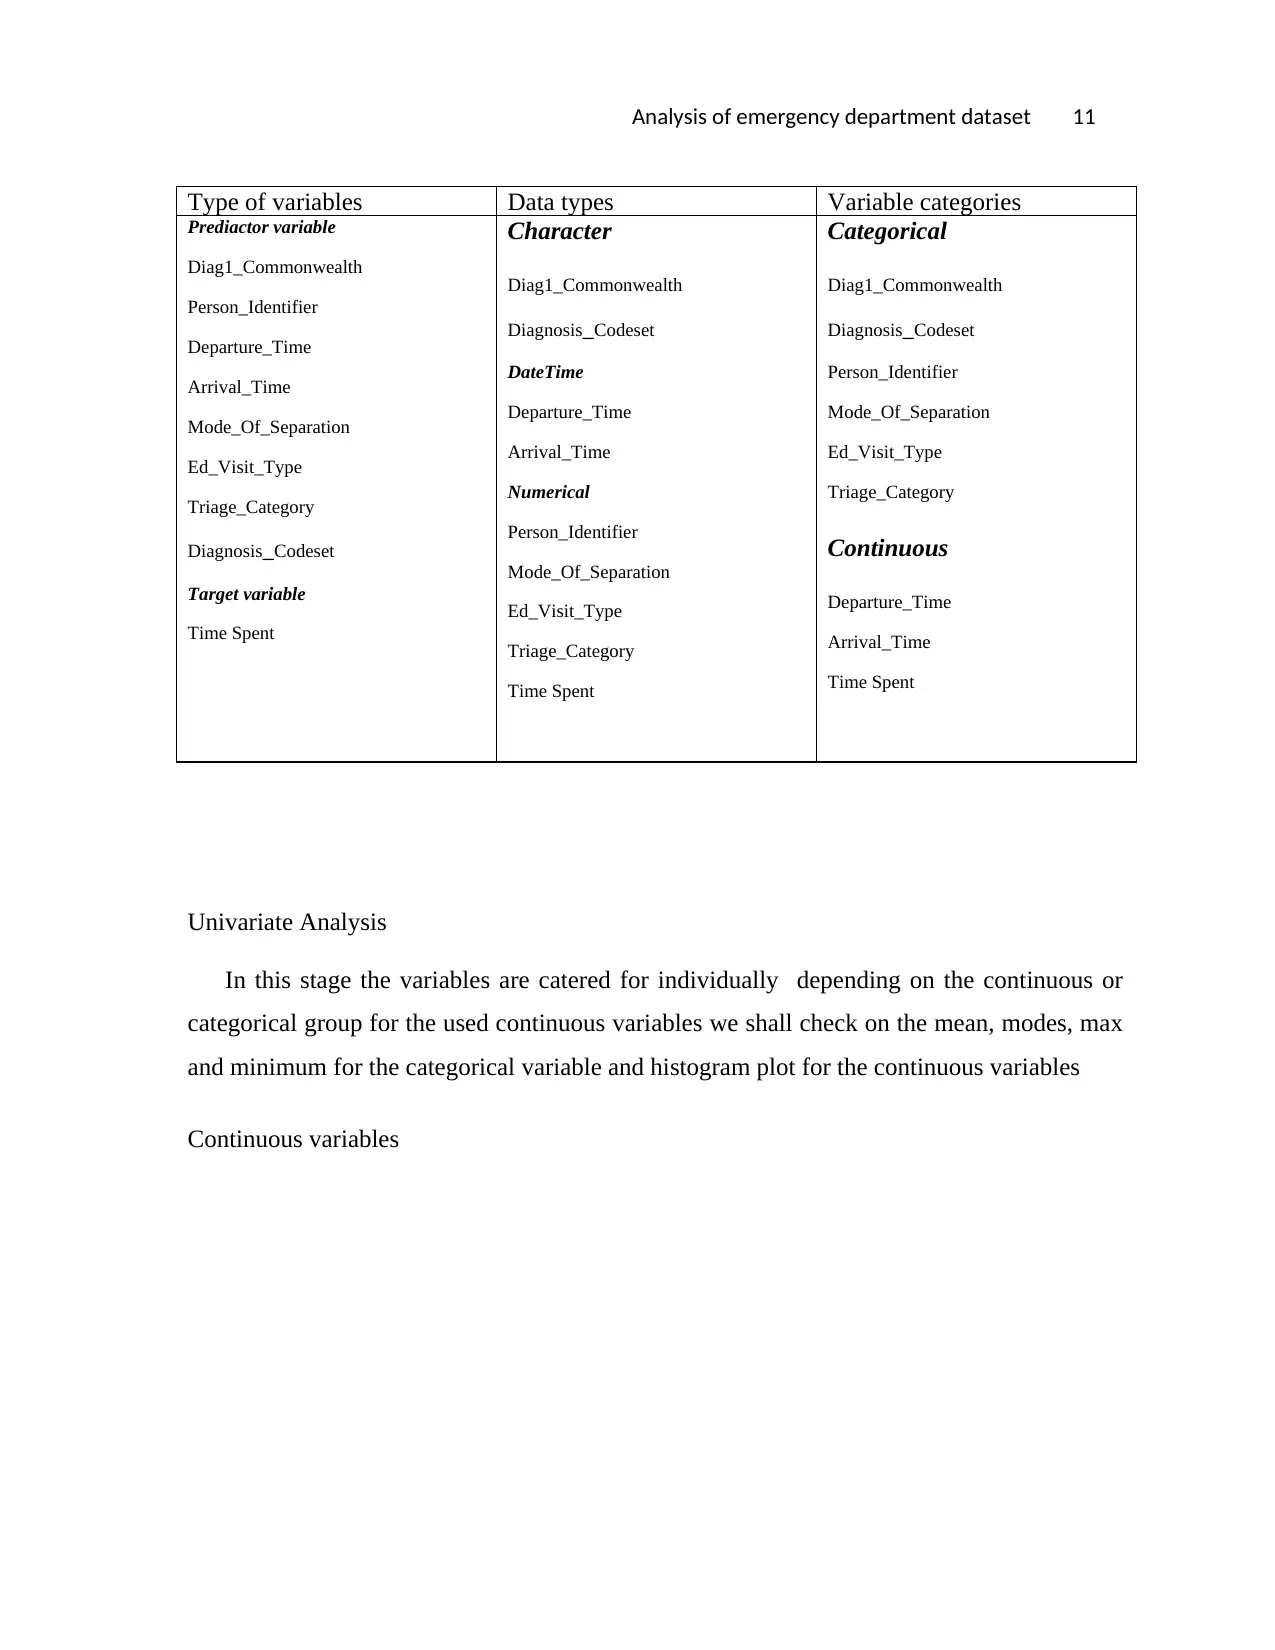
Univariate Analysis
In this stage the variables are catered for individually depending on the continuous or
categorical group for the used continuous variables we shall check on the mean, modes, max
and minimum for the categorical variable and histogram plot for the continuous variables
Continuous variables
Type of variables Data types Variable categories
Prediactor variable
Diag1_Commonwealth
Person_Identifier
Departure_Time
Arrival_Time
Mode_Of_Separation
Ed_Visit_Type
Triage_Category
Diagnosis_Codeset
Target variable
Time Spent
Character
Diag1_Commonwealth
Diagnosis_Codeset
DateTime
Departure_Time
Arrival_Time
Numerical
Person_Identifier
Mode_Of_Separation
Ed_Visit_Type
Triage_Category
Time Spent
Categorical
Diag1_Commonwealth
Diagnosis_Codeset
Person_Identifier
Mode_Of_Separation
Ed_Visit_Type
Triage_Category
Continuous
Departure_Time
Arrival_Time
Time Spent
Univariate Analysis
In this stage the variables are catered for individually depending on the continuous or
categorical group for the used continuous variables we shall check on the mean, modes, max
and minimum for the categorical variable and histogram plot for the continuous variables
Continuous variables
Analysis of emergency department dataset 12
0.000
1.000
2.000
3.000
4.000
5.000
6.000
7.000
1 3 5 7 9 11 13 15 17 19 21 23
Time spent
Time spent
Categorical variables.
Bi-variate Analysis
To perform the bi-variant analysis the continuous and the categorical variable are
analyzed separate this by use of the scatter plots and the graphs respectively.
Continuous variables
⊘ This is a preview!⊘
Do you want full access?
Subscribe today to unlock all pages.
Trusted by 1+ million students worldwide
1 out of 20
Related Documents


Your All-in-One AI-Powered Toolkit for Academic Success.
+13062052269
info@desklib.com
Available 24*7 on WhatsApp / Email
![[object Object]](/_next/static/media/star-bottom.7253800d.svg)
Unlock your academic potential
Copyright © 2020–2026 A2Z Services. All Rights Reserved. Developed and managed by ZUCOL.