Analysis of Mortality in Emergency General Surgery Admissions
VerifiedAdded on 2022/11/28
|11
|3204
|81
Project
AI Summary
This project presents a retrospective observational study analyzing factors influencing mortality in emergency general surgery admissions. The study utilized data collected from February 2011 to December 2017, encompassing 25 variables including patient demographics, comorbidities, length of hospital stay, admission diagnoses, surgical interventions, in-hospital complications, and mortality information. The analysis employed logistic regression, with both univariate and multivariate approaches, to identify statistically significant predictors of mortality. Key findings indicate that age (specifically, being older than 60) and the presence of complications during surgery are significant predictors of mortality. The research also explores the impact of being operative and endoscopic. The study concludes that healthcare providers should focus on managing complications and the care of elderly patients to improve survival rates in emergency general surgery.
Foundations of Data Science Assignment 1
Foundations of Data Science Assignment
Mortality in Emergency General Surgery admissions: A retrospective observational study
Name
Course Number
Date
Faculty Name
Foundations of Data Science Assignment
Mortality in Emergency General Surgery admissions: A retrospective observational study
Name
Course Number
Date
Faculty Name
Paraphrase This Document
Need a fresh take? Get an instant paraphrase of this document with our AI Paraphraser
Foundations of Data Science Assignment 2
Abstract
Mortality in emergency general surgery admission is still of concern and is mostly caused by
patient specific and health care dependent factors. Some of these factors include type of
condition and severity, age among other factors. Quality data can be used to estimate the effect
of these factors. Quality evidence from research can be used to inform policies regarding the
emergency general surgery admission, hence improving survival chances of the patients. In this
paper, retrospective data has been analysed to evaluate factors influencing mortality in
emergency general surgery admission. Logistic regression approach was used and univariate and
multivariate analysis were performed. The unadjusted estimates of age, being operative,
experiencing complications and being endoscopic were found to be statistically significant
predictors of mortality. Including these four variable into a multiple logistic regression model,
the adjusted estimates of being operative and endoscopic were not statistically significant. In
conclusion, being older than 60 and experiencing complications during surgery are statistically
significant predictors of mortality in an emergency general surgery admission.
Mortality in Emergency General Surgery admissions: A retrospective observational study
Introduction
Mortality in hospitals is worrying especially in areas where there no capacity and capability to
undertake general emergency surgical health services. In some countries, especially in low and
middle income countries, patients have to travel long distances to access emergency surgery,
which leads to increase in mortality. For this matter, hospital offering general surgical services
and admissions are sometimes overwhelmed by patients in need of the services. These challenges
are not only faced in the developing countries but also in the developing countries. In countries
such as England, the National Health Service had recorded that emergencies take up a significant
percentage of the general surgical admission. In regards to the dynamics of emergency cases,
health care centres have put in place stringent frameworks to improve ensure quality service
provision, in turn reduce the mortality levels.
On the other side, there are patient specific factors which determine survival chances, amongst
which is the severity of the condition. In emergency surgery cases, mortality might occur during
the surgery procedure or after being admitted. In-hospital complications and infections are also
rampant causes of hospital mortality. In some occasions, patients who are thought to be
progressing well and let to go home, end up dying either due to dose mismanagement or
infections. Also, some cases of readmission are observed and so on. Understanding the dynamics
of the causes of mortality in emergency general surgery admission would enhance the possibility
of improving the healthcare services, hence improving the survival chance of the patients.
Some of the patient specific factors which might influence the surgery outcome include age, the
type of admission, type of diagnosis, and severity of the condition among other factors. For
instance, older people might be more at risk to die due to the general ability of the body tissues to
reconstruct and fight infections. Also, some admissions might be fresh cases while other being
re-admitted from a low or high rank hospitals. All these factors might determine the outcome of
an emergency surgery patient. Other than death, the patient end up being rehabilitated to restore
natural stature due to deformations or lose of capabilities. For example, an accident patient which
a broken leg might have to go through physiotherapy session to achieve a walking restoration. In
Foundations of Data Science Assignment 3
this report, retrospectively collection information about emergency general surgery admissions
will be used to estimate the factors associated with death.
Data
The data used in this report was collected for an approximate period of 7 years between February
2011 and December 2017. The data consists of 25 variables which cover patient demographics,
comorbidities, length of hospital stay admission diagnosis, in-hospital complications, surgical
interventions and mortality information. The outcome variable for this report is death, which has
been recorded as a dummy variable. Other variables such as Diagnosis text have been recorded
as a text. However, dummy variables can be extracted from this variable to enhance modelling or
mortality.
Methods
A number of data science methods have been applied on this data to tidy for effect and
meaningful analysis. Further, descriptive analysis which include frequencies, measures of central
tendency and dispersion was conducted (Trochim, 2006). Further, bivariate and multivariate
logistic models have been fitted to evaluate the factors influencing mortality on emergency
general admissions.
Results and Discussion
Descriptive statistics
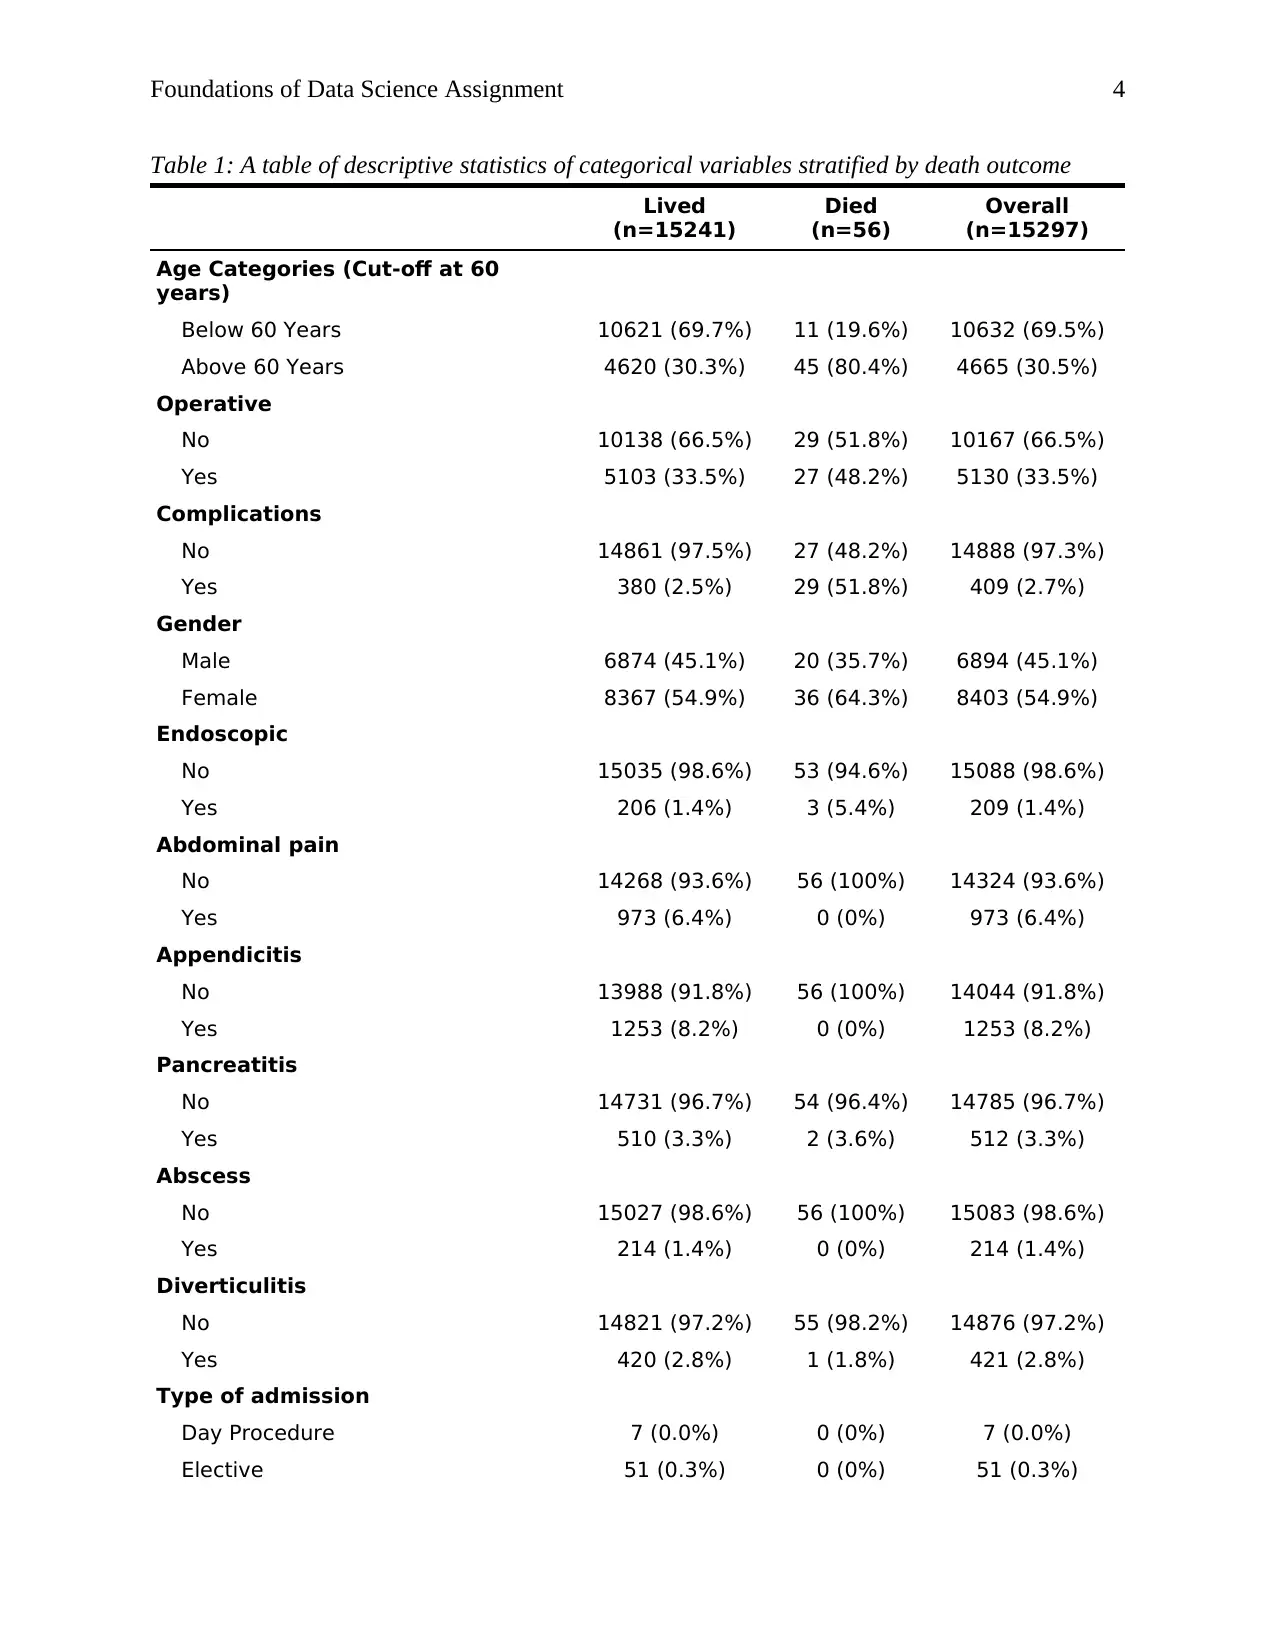
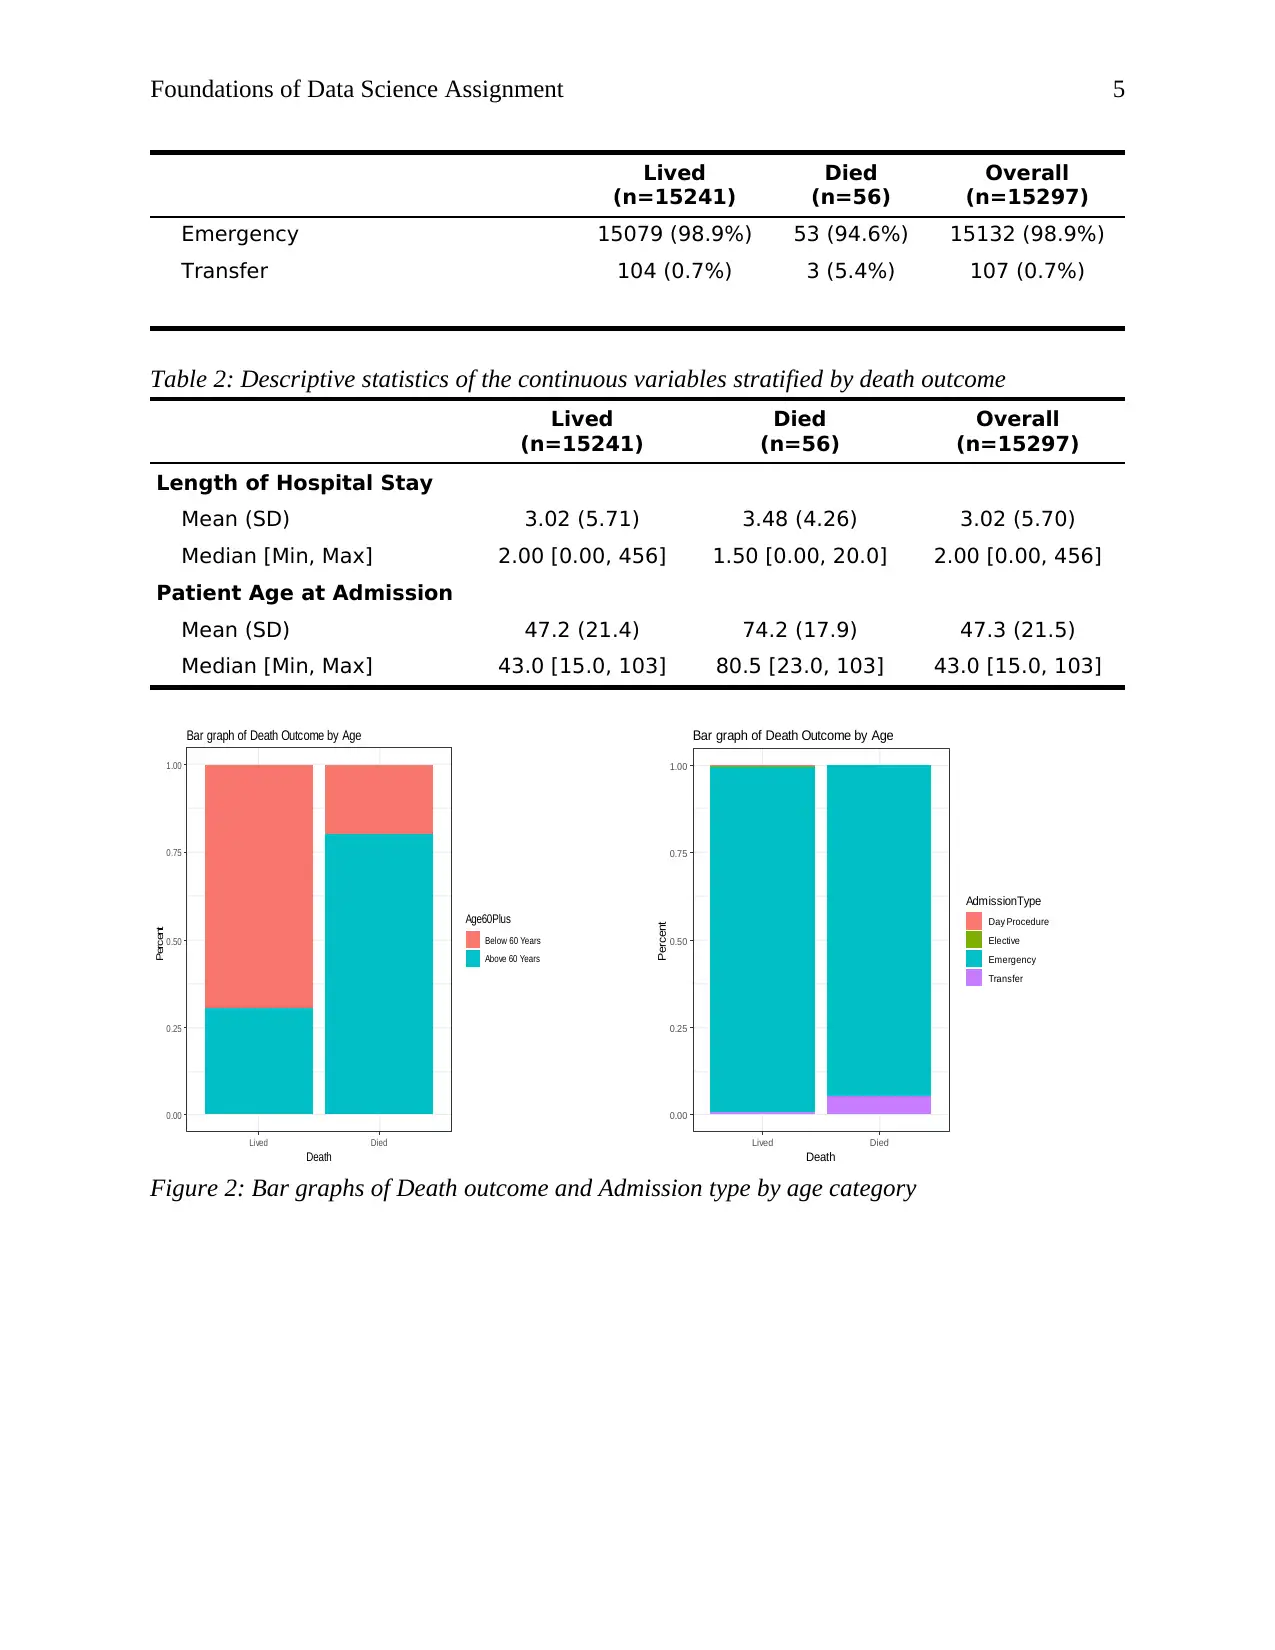
Using the retrospective data, we find that the number of patients who died were 56 (0.4%) of all
the patients. In table 1, we observe that approximately 80% of the patients who died were above
60 years of age. The frequencies of being operative and having complications or not were not
very different among the patients who died. On average, patients who died stayed in the hospital
shorter and were significantly older that their counterparts.
abdosubacute
crohns
c ons tipation
partiallif
gastroenteritis
epigastric
incisional
back
vomiting
lap
gallstone
inguinal
uti
inves tigation
renal
biliary
pilonidal body
sebaceous
alcoholic
chronic
rif
repair
mesenteric
pain
rupture
c holangitis
abcess
nonspecific
cyst
caecal
axillary
umbilical
gastritis
epiploic
upper
bleed
ovarian
metastatic
anal
pyelonephritis
choledocholithiasis
diverticulitis
sbo
hernia
flank
left
cholelithiasis
perianal
inf ection
bleeding
colitis
ileitis
enteritis
ischaemic
appendicectomy
disease
cancer
recurrent
secondary
small
abscess
inf ected
pelv ic
term inal wall
cholecystitis
ulcer
sinus incarcerated
gastric
post
sided
colic
luq
perforated
infective
groin
perf orat ion
ruptured
collection
appendicitis
thigh
obstruction
haem at om a
wound
adenitis
jaundice
right
volvulus
sigmoid
femoral
perineal
cellulitis
duodenal
f istula
buttock
abdominal
bowel
adhesiv e
pancreatitis
urinary
ruq
acute
lower
breast
band
m ass
foreign
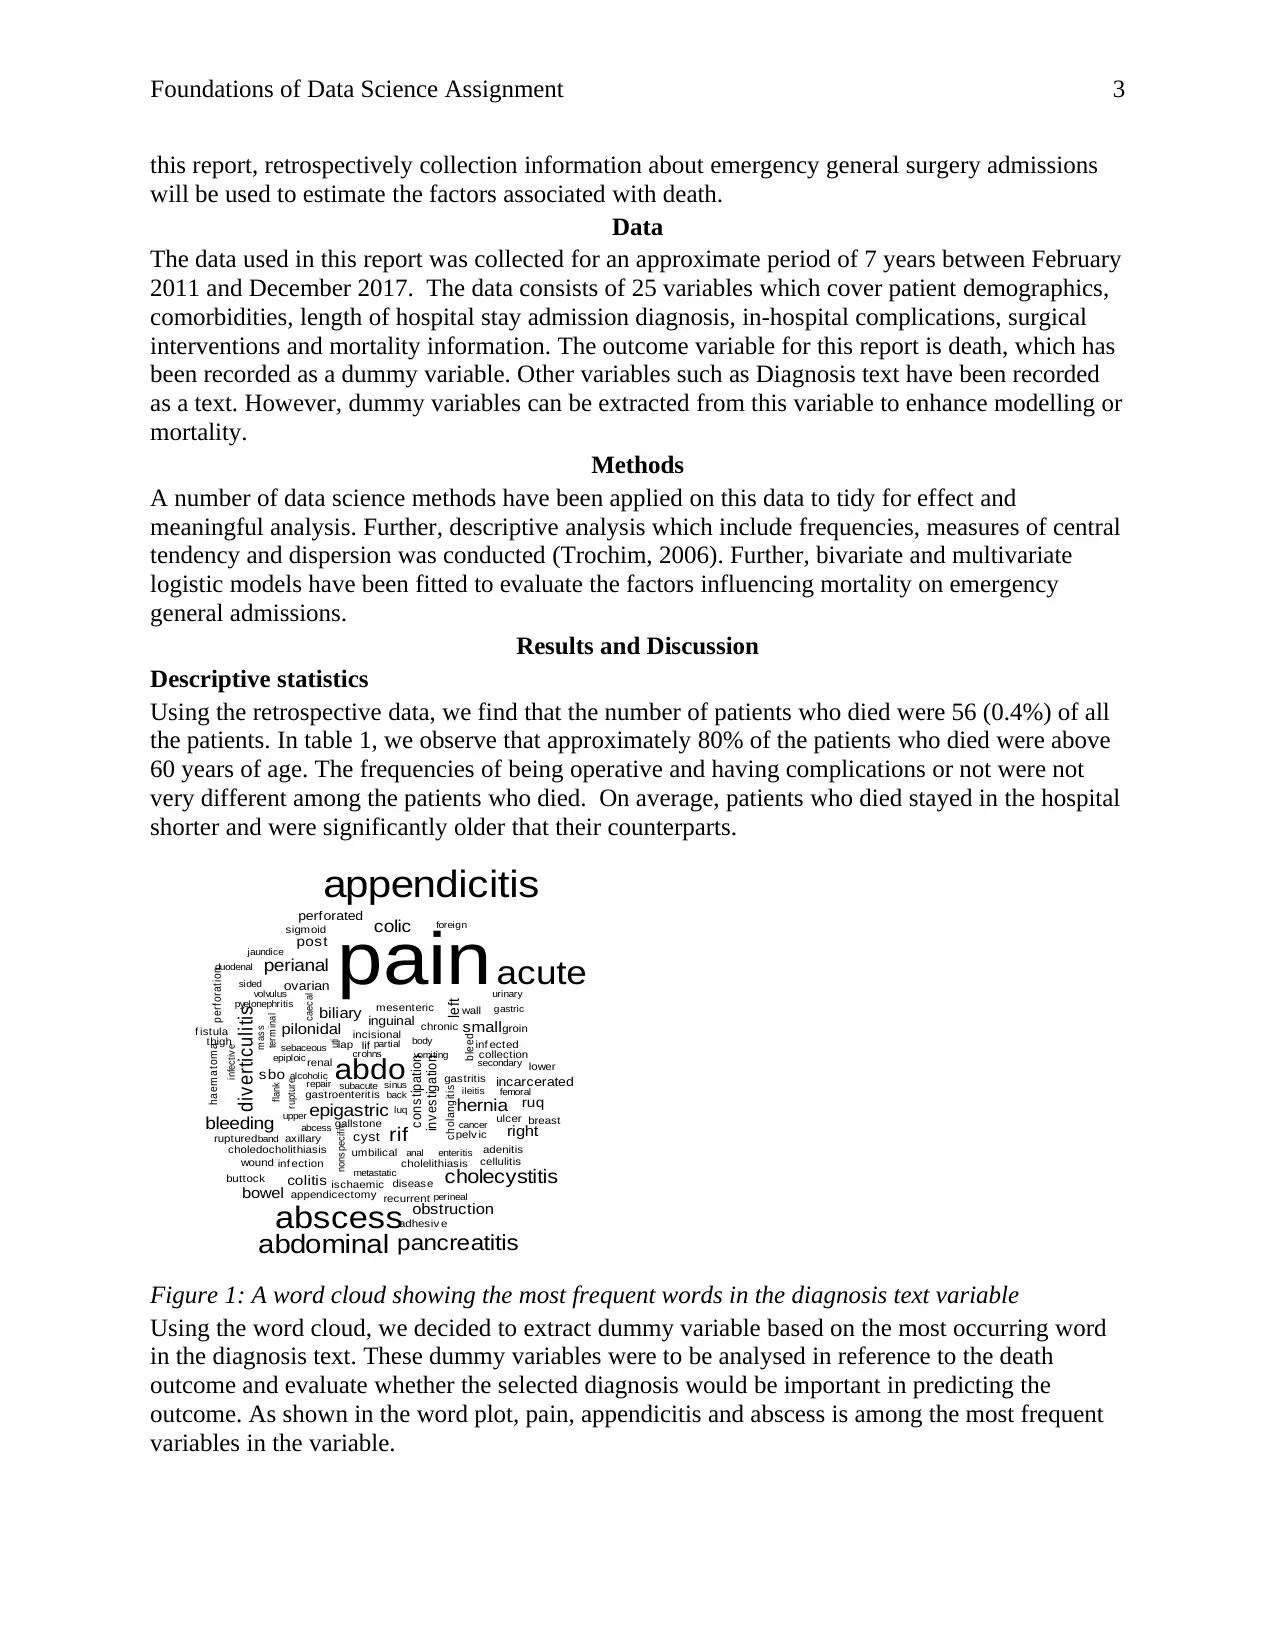
Figure 1: A word cloud showing the most frequent words in the diagnosis text variable
Using the word cloud, we decided to extract dummy variable based on the most occurring word
in the diagnosis text. These dummy variables were to be analysed in reference to the death
outcome and evaluate whether the selected diagnosis would be important in predicting the
outcome. As shown in the word plot, pain, appendicitis and abscess is among the most frequent
variables in the variable.
this report, retrospectively collection information about emergency general surgery admissions
will be used to estimate the factors associated with death.
Data
The data used in this report was collected for an approximate period of 7 years between February
2011 and December 2017. The data consists of 25 variables which cover patient demographics,
comorbidities, length of hospital stay admission diagnosis, in-hospital complications, surgical
interventions and mortality information. The outcome variable for this report is death, which has
been recorded as a dummy variable. Other variables such as Diagnosis text have been recorded
as a text. However, dummy variables can be extracted from this variable to enhance modelling or
mortality.
Methods
A number of data science methods have been applied on this data to tidy for effect and
meaningful analysis. Further, descriptive analysis which include frequencies, measures of central
tendency and dispersion was conducted (Trochim, 2006). Further, bivariate and multivariate
logistic models have been fitted to evaluate the factors influencing mortality on emergency
general admissions.
Results and Discussion
Descriptive statistics
Using the retrospective data, we find that the number of patients who died were 56 (0.4%) of all
the patients. In table 1, we observe that approximately 80% of the patients who died were above
60 years of age. The frequencies of being operative and having complications or not were not
very different among the patients who died. On average, patients who died stayed in the hospital
shorter and were significantly older that their counterparts.
abdosubacute
crohns
c ons tipation
partiallif
gastroenteritis
epigastric
incisional
back
vomiting
lap
gallstone
inguinal
uti
inves tigation
renal
biliary
pilonidal body
sebaceous
alcoholic
chronic
rif
repair
mesenteric
pain
rupture
c holangitis
abcess
nonspecific
cyst
caecal
axillary
umbilical
gastritis
epiploic
upper
bleed
ovarian
metastatic
anal
pyelonephritis
choledocholithiasis
diverticulitis
sbo
hernia
flank
left
cholelithiasis
perianal
inf ection
bleeding
colitis
ileitis
enteritis
ischaemic
appendicectomy
disease
cancer
recurrent
secondary
small
abscess
inf ected
pelv ic
term inal wall
cholecystitis
ulcer
sinus incarcerated
gastric
post
sided
colic
luq
perforated
infective
groin
perf orat ion
ruptured
collection
appendicitis
thigh
obstruction
haem at om a
wound
adenitis
jaundice
right
volvulus
sigmoid
femoral
perineal
cellulitis
duodenal
f istula
buttock
abdominal
bowel
adhesiv e
pancreatitis
urinary
ruq
acute
lower
breast
band
m ass
foreign
Figure 1: A word cloud showing the most frequent words in the diagnosis text variable
Using the word cloud, we decided to extract dummy variable based on the most occurring word
in the diagnosis text. These dummy variables were to be analysed in reference to the death
outcome and evaluate whether the selected diagnosis would be important in predicting the
outcome. As shown in the word plot, pain, appendicitis and abscess is among the most frequent
variables in the variable.
⊘ This is a preview!⊘
Do you want full access?
Subscribe today to unlock all pages.
Trusted by 1+ million students worldwide
Foundations of Data Science Assignment 4
Table 1: A table of descriptive statistics of categorical variables stratified by death outcome
Lived
(n=15241)
Died
(n=56)
Overall
(n=15297)
Age Categories (Cut-off at 60
years)
Below 60 Years 10621 (69.7%) 11 (19.6%) 10632 (69.5%)
Above 60 Years 4620 (30.3%) 45 (80.4%) 4665 (30.5%)
Operative
No 10138 (66.5%) 29 (51.8%) 10167 (66.5%)
Yes 5103 (33.5%) 27 (48.2%) 5130 (33.5%)
Complications
No 14861 (97.5%) 27 (48.2%) 14888 (97.3%)
Yes 380 (2.5%) 29 (51.8%) 409 (2.7%)
Gender
Male 6874 (45.1%) 20 (35.7%) 6894 (45.1%)
Female 8367 (54.9%) 36 (64.3%) 8403 (54.9%)
Endoscopic
No 15035 (98.6%) 53 (94.6%) 15088 (98.6%)
Yes 206 (1.4%) 3 (5.4%) 209 (1.4%)
Abdominal pain
No 14268 (93.6%) 56 (100%) 14324 (93.6%)
Yes 973 (6.4%) 0 (0%) 973 (6.4%)
Appendicitis
No 13988 (91.8%) 56 (100%) 14044 (91.8%)
Yes 1253 (8.2%) 0 (0%) 1253 (8.2%)
Pancreatitis
No 14731 (96.7%) 54 (96.4%) 14785 (96.7%)
Yes 510 (3.3%) 2 (3.6%) 512 (3.3%)
Abscess
No 15027 (98.6%) 56 (100%) 15083 (98.6%)
Yes 214 (1.4%) 0 (0%) 214 (1.4%)
Diverticulitis
No 14821 (97.2%) 55 (98.2%) 14876 (97.2%)
Yes 420 (2.8%) 1 (1.8%) 421 (2.8%)
Type of admission
Day Procedure 7 (0.0%) 0 (0%) 7 (0.0%)
Elective 51 (0.3%) 0 (0%) 51 (0.3%)
Paraphrase This Document
Need a fresh take? Get an instant paraphrase of this document with our AI Paraphraser
Foundations of Data Science Assignment 5
Lived
(n=15241)
Died
(n=56)
Overall
(n=15297)
Emergency 15079 (98.9%) 53 (94.6%) 15132 (98.9%)
Transfer 104 (0.7%) 3 (5.4%) 107 (0.7%)
Table 2: Descriptive statistics of the continuous variables stratified by death outcome
Lived
(n=15241)
Died
(n=56)
Overall
(n=15297)
Length of Hospital Stay
Mean (SD) 3.02 (5.71) 3.48 (4.26) 3.02 (5.70)
Median [Min, Max] 2.00 [0.00, 456] 1.50 [0.00, 20.0] 2.00 [0.00, 456]
Patient Age at Admission
Mean (SD) 47.2 (21.4) 74.2 (17.9) 47.3 (21.5)
Median [Min, Max] 43.0 [15.0, 103] 80.5 [23.0, 103] 43.0 [15.0, 103]
0.00
0.25
0.50
0.75
1.00
Lived Died
Death
Percent Age60Plus
Below 60 Years
Above 60 Years
Bar graph of Death Outcome by Age
0.00
0.25
0.50
0.75
1.00
Lived Died
Death
Percent
AdmissionType
Day Procedure
Elective
Emergency
Transfer
Bar graph of Death Outcome by Age
Figure 2: Bar graphs of Death outcome and Admission type by age category
Lived
(n=15241)
Died
(n=56)
Overall
(n=15297)
Emergency 15079 (98.9%) 53 (94.6%) 15132 (98.9%)
Transfer 104 (0.7%) 3 (5.4%) 107 (0.7%)
Table 2: Descriptive statistics of the continuous variables stratified by death outcome
Lived
(n=15241)
Died
(n=56)
Overall
(n=15297)
Length of Hospital Stay
Mean (SD) 3.02 (5.71) 3.48 (4.26) 3.02 (5.70)
Median [Min, Max] 2.00 [0.00, 456] 1.50 [0.00, 20.0] 2.00 [0.00, 456]
Patient Age at Admission
Mean (SD) 47.2 (21.4) 74.2 (17.9) 47.3 (21.5)
Median [Min, Max] 43.0 [15.0, 103] 80.5 [23.0, 103] 43.0 [15.0, 103]
0.00
0.25
0.50
0.75
1.00
Lived Died
Death
Percent Age60Plus
Below 60 Years
Above 60 Years
Bar graph of Death Outcome by Age
0.00
0.25
0.50
0.75
1.00
Lived Died
Death
Percent
AdmissionType
Day Procedure
Elective
Emergency
Transfer
Bar graph of Death Outcome by Age
Figure 2: Bar graphs of Death outcome and Admission type by age category
Foundations of Data Science Assignment 6
25
50
75
100
Lived Died
Death
Age at admission
Age at admission boxplot by death outcome
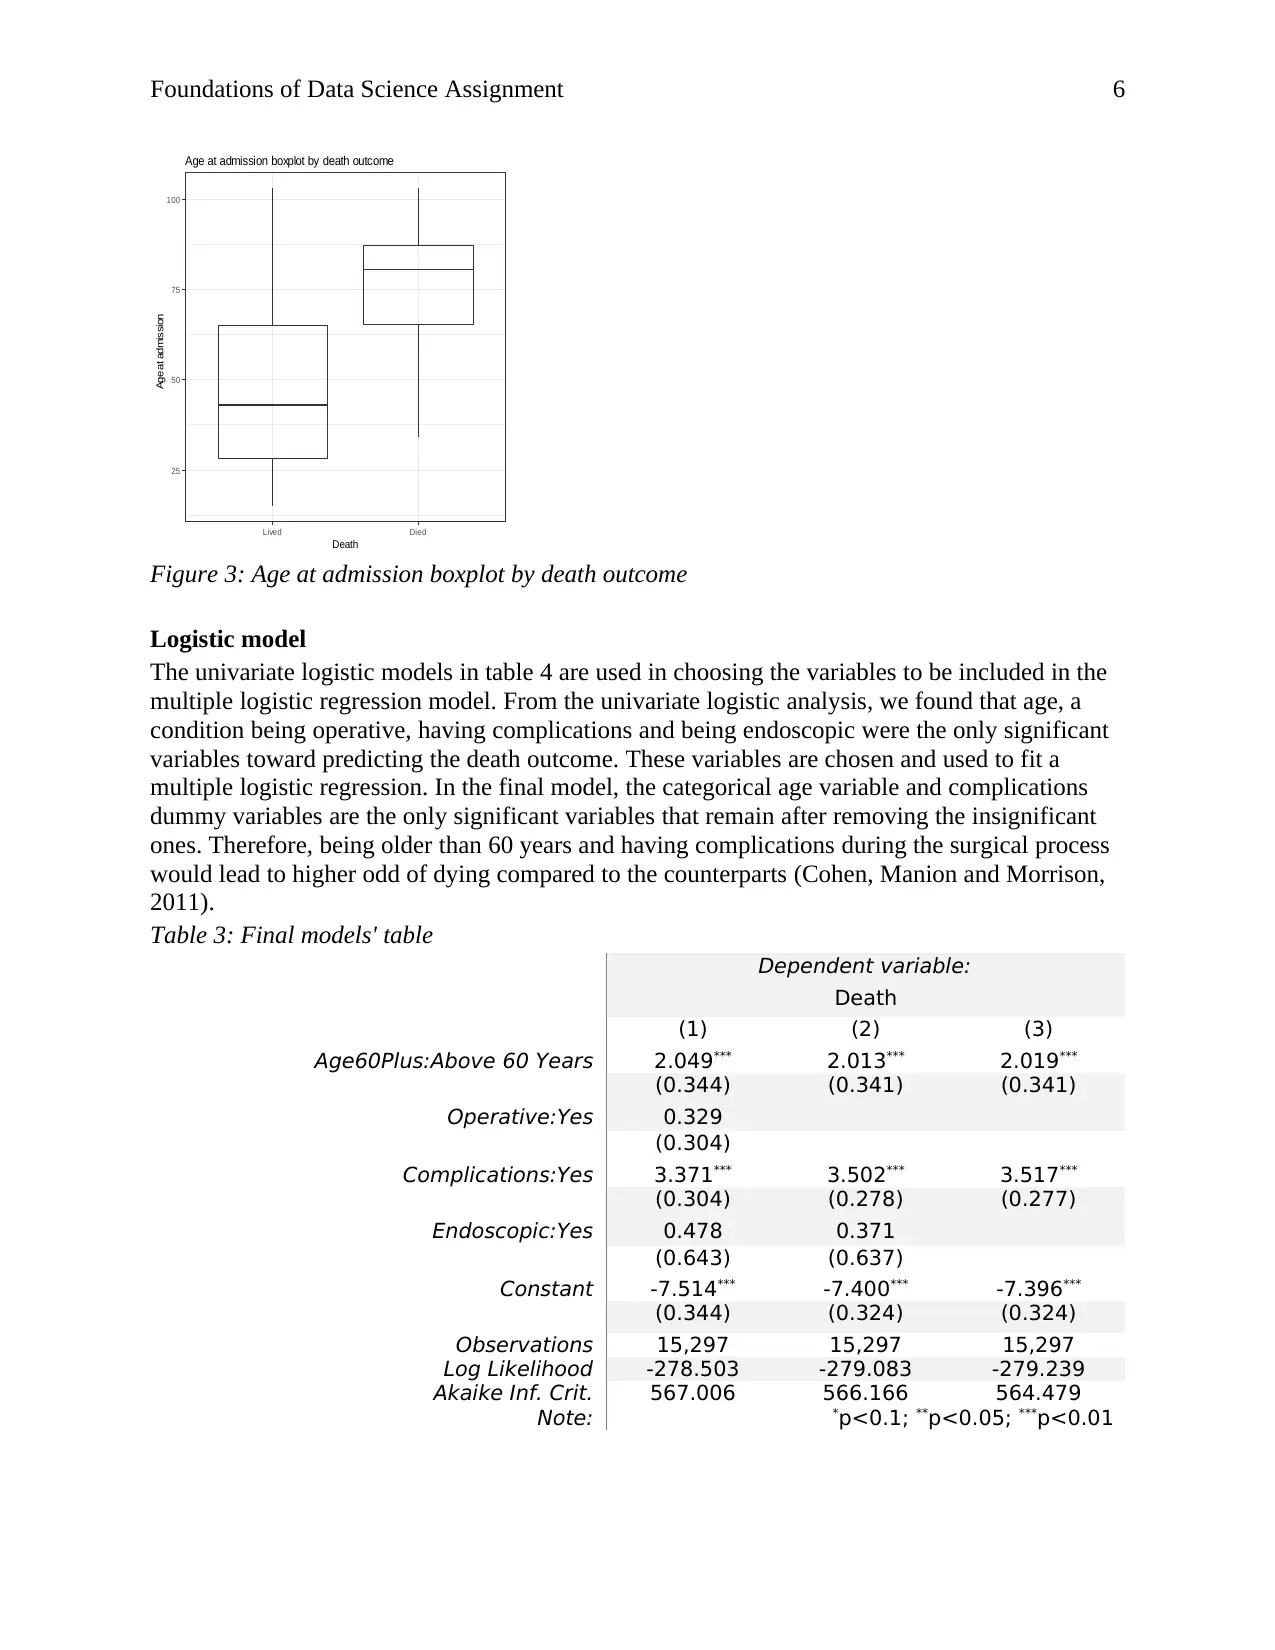
Figure 3: Age at admission boxplot by death outcome
Logistic model
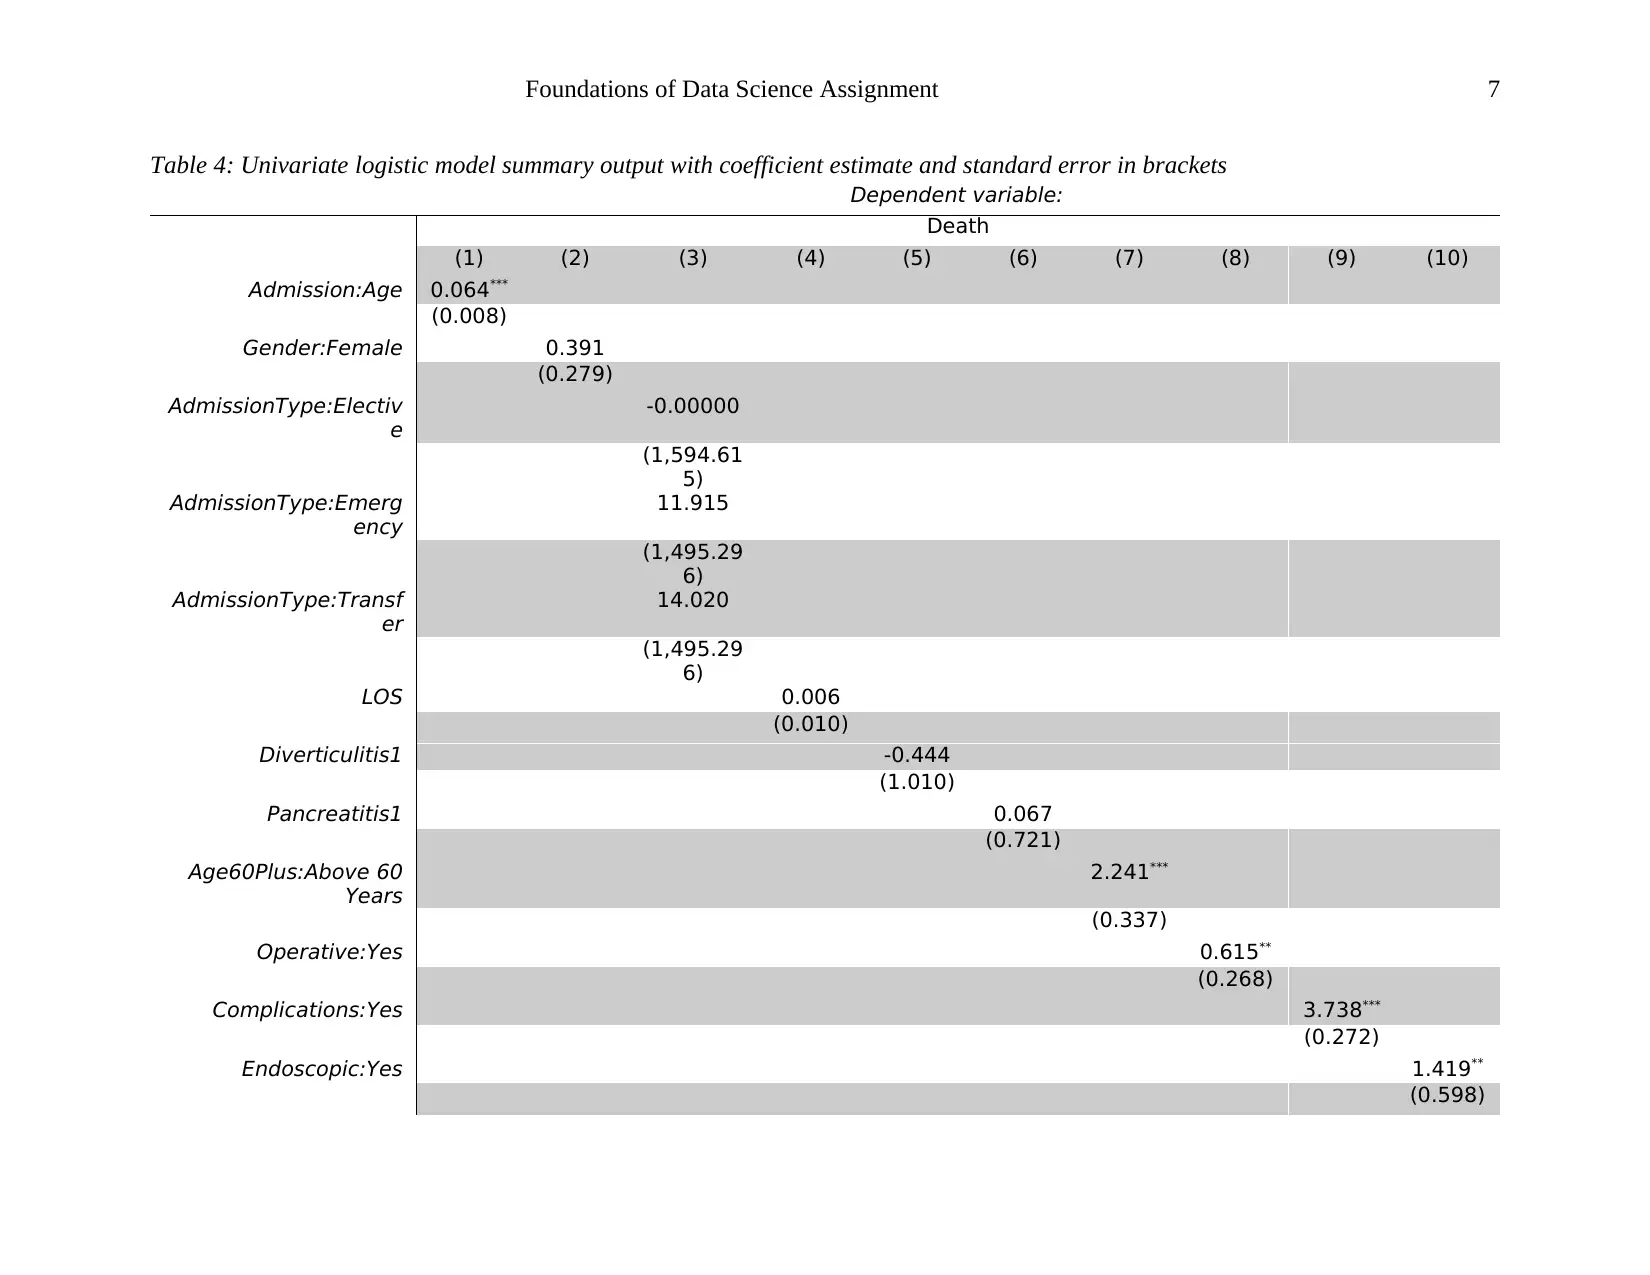
The univariate logistic models in table 4 are used in choosing the variables to be included in the
multiple logistic regression model. From the univariate logistic analysis, we found that age, a
condition being operative, having complications and being endoscopic were the only significant
variables toward predicting the death outcome. These variables are chosen and used to fit a
multiple logistic regression. In the final model, the categorical age variable and complications
dummy variables are the only significant variables that remain after removing the insignificant
ones. Therefore, being older than 60 years and having complications during the surgical process
would lead to higher odd of dying compared to the counterparts (Cohen, Manion and Morrison,
2011).
Table 3: Final models' table
Dependent variable:
Death
(1) (2) (3)
Age60Plus:Above 60 Years 2.049*** 2.013*** 2.019***
(0.344) (0.341) (0.341)
Operative:Yes 0.329
(0.304)
Complications:Yes 3.371*** 3.502*** 3.517***
(0.304) (0.278) (0.277)
Endoscopic:Yes 0.478 0.371
(0.643) (0.637)
Constant -7.514*** -7.400*** -7.396***
(0.344) (0.324) (0.324)
Observations 15,297 15,297 15,297
Log Likelihood -278.503 -279.083 -279.239
Akaike Inf. Crit. 567.006 566.166 564.479
Note: *p<0.1; **p<0.05; ***p<0.01
25
50
75
100
Lived Died
Death
Age at admission
Age at admission boxplot by death outcome
Figure 3: Age at admission boxplot by death outcome
Logistic model
The univariate logistic models in table 4 are used in choosing the variables to be included in the
multiple logistic regression model. From the univariate logistic analysis, we found that age, a
condition being operative, having complications and being endoscopic were the only significant
variables toward predicting the death outcome. These variables are chosen and used to fit a
multiple logistic regression. In the final model, the categorical age variable and complications
dummy variables are the only significant variables that remain after removing the insignificant
ones. Therefore, being older than 60 years and having complications during the surgical process
would lead to higher odd of dying compared to the counterparts (Cohen, Manion and Morrison,
2011).
Table 3: Final models' table
Dependent variable:
Death
(1) (2) (3)
Age60Plus:Above 60 Years 2.049*** 2.013*** 2.019***
(0.344) (0.341) (0.341)
Operative:Yes 0.329
(0.304)
Complications:Yes 3.371*** 3.502*** 3.517***
(0.304) (0.278) (0.277)
Endoscopic:Yes 0.478 0.371
(0.643) (0.637)
Constant -7.514*** -7.400*** -7.396***
(0.344) (0.324) (0.324)
Observations 15,297 15,297 15,297
Log Likelihood -278.503 -279.083 -279.239
Akaike Inf. Crit. 567.006 566.166 564.479
Note: *p<0.1; **p<0.05; ***p<0.01
⊘ This is a preview!⊘
Do you want full access?
Subscribe today to unlock all pages.
Trusted by 1+ million students worldwide
Foundations of Data Science Assignment 7
Table 4: Univariate logistic model summary output with coefficient estimate and standard error in brackets
Dependent variable:
Death
(1) (2) (3) (4) (5) (6) (7) (8) (9) (10)
Admission:Age 0.064***
(0.008)
Gender:Female 0.391
(0.279)
AdmissionType:Electiv
e
-0.00000
(1,594.61
5)
AdmissionType:Emerg
ency
11.915
(1,495.29
6)
AdmissionType:Transf
er
14.020
(1,495.29
6)
LOS 0.006
(0.010)
Diverticulitis1 -0.444
(1.010)
Pancreatitis1 0.067
(0.721)
Age60Plus:Above 60
Years
2.241***
(0.337)
Operative:Yes 0.615**
(0.268)
Complications:Yes 3.738***
(0.272)
Endoscopic:Yes 1.419**
(0.598)
Paraphrase This Document
Need a fresh take? Get an instant paraphrase of this document with our AI Paraphraser
Foundations of Data Science Assignment 8
Constant -
9.598***
-
5.840***
-17.566 -
5.624***
-
5.596***
-
5.609***
-
6.873***
-
5.857***
-
6.311***
-
5.648***
(0.628) (0.224) (1,495.29
6)
(0.138) (0.135) (0.136) (0.302) (0.186) (0.193) (0.138)
Observations 15,297 15,297 15,297 15,297 15,297 15,297 15,297 15,297 15,297 15,297
Log Likelihood -
326.05
1
-
369.04
9
-366.264 -
369.96
6
-
369.94
9
-
370.05
6
-
340.24
1
-
367.48
6
-
302.10
5
-
368.13
9
Akaike Inf. Crit. 656.10
1
742.09
8
740.528 743.93
3
743.89
8
744.11
3
684.48
1
738.97
1
608.21
0
740.27
7
Note: *p<0.1; **p<0.05; ***p<0.01
Foundations of Data Science Assignment 9
Conclusion
In conclusion, dying as a result of emergency general surgery admission is significantly
predicted by being older than 60 years or the condition being endoscopic, having complications
or being operative. Finally, death is also predicted significantly by the procedure having
complications and the patient being older than 60 years.
⊘ This is a preview!⊘
Do you want full access?
Subscribe today to unlock all pages.
Trusted by 1+ million students worldwide
Foundations of Data Science Assignment 10
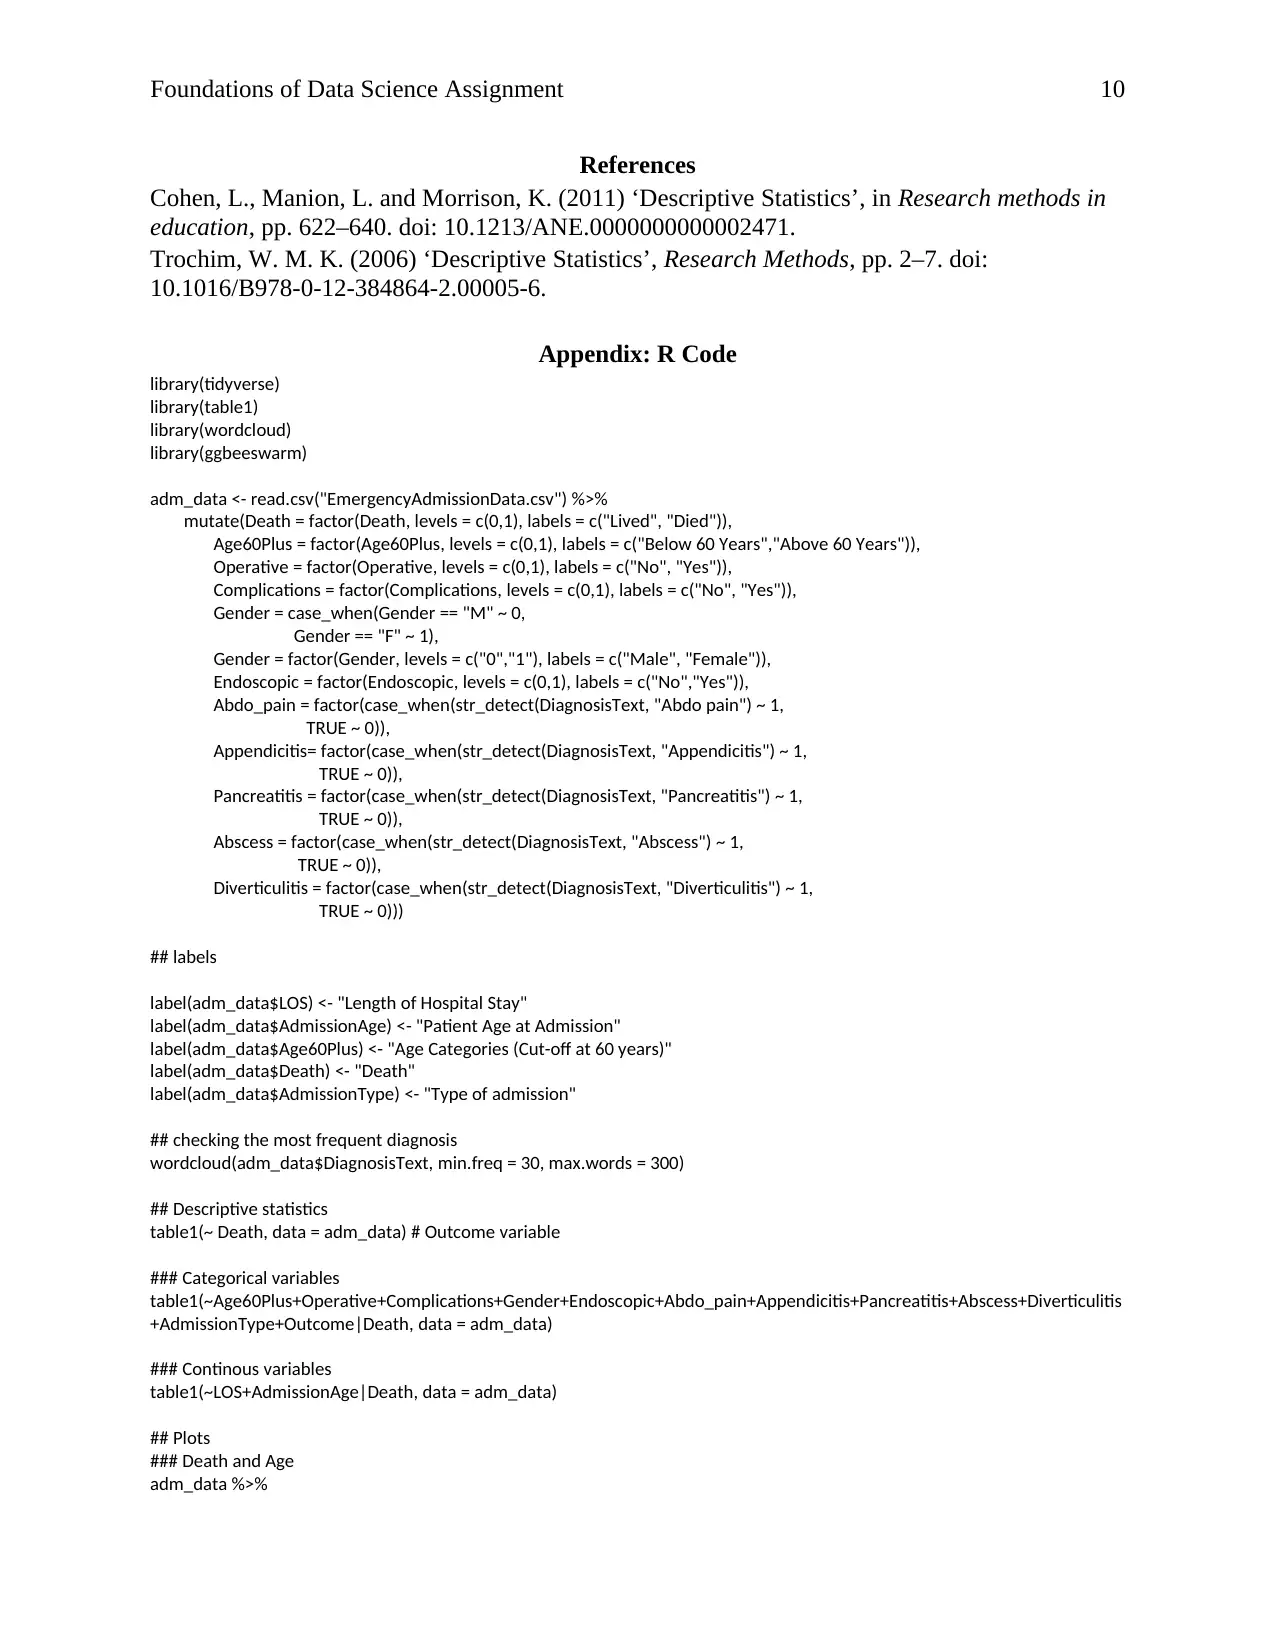
References
Cohen, L., Manion, L. and Morrison, K. (2011) ‘Descriptive Statistics’, in Research methods in
education, pp. 622–640. doi: 10.1213/ANE.0000000000002471.
Trochim, W. M. K. (2006) ‘Descriptive Statistics’, Research Methods, pp. 2–7. doi:
10.1016/B978-0-12-384864-2.00005-6.
Appendix: R Code
library(tidyverse)
library(table1)
library(wordcloud)
library(ggbeeswarm)
adm_data <- read.csv("EmergencyAdmissionData.csv") %>%
mutate(Death = factor(Death, levels = c(0,1), labels = c("Lived", "Died")),
Age60Plus = factor(Age60Plus, levels = c(0,1), labels = c("Below 60 Years","Above 60 Years")),
Operative = factor(Operative, levels = c(0,1), labels = c("No", "Yes")),
Complications = factor(Complications, levels = c(0,1), labels = c("No", "Yes")),
Gender = case_when(Gender == "M" ~ 0,
Gender == "F" ~ 1),
Gender = factor(Gender, levels = c("0","1"), labels = c("Male", "Female")),
Endoscopic = factor(Endoscopic, levels = c(0,1), labels = c("No","Yes")),
Abdo_pain = factor(case_when(str_detect(DiagnosisText, "Abdo pain") ~ 1,
TRUE ~ 0)),
Appendicitis= factor(case_when(str_detect(DiagnosisText, "Appendicitis") ~ 1,
TRUE ~ 0)),
Pancreatitis = factor(case_when(str_detect(DiagnosisText, "Pancreatitis") ~ 1,
TRUE ~ 0)),
Abscess = factor(case_when(str_detect(DiagnosisText, "Abscess") ~ 1,
TRUE ~ 0)),
Diverticulitis = factor(case_when(str_detect(DiagnosisText, "Diverticulitis") ~ 1,
TRUE ~ 0)))
## labels
label(adm_data$LOS) <- "Length of Hospital Stay"
label(adm_data$AdmissionAge) <- "Patient Age at Admission"
label(adm_data$Age60Plus) <- "Age Categories (Cut-off at 60 years)"
label(adm_data$Death) <- "Death"
label(adm_data$AdmissionType) <- "Type of admission"
## checking the most frequent diagnosis
wordcloud(adm_data$DiagnosisText, min.freq = 30, max.words = 300)
## Descriptive statistics
table1(~ Death, data = adm_data) # Outcome variable
### Categorical variables
table1(~Age60Plus+Operative+Complications+Gender+Endoscopic+Abdo_pain+Appendicitis+Pancreatitis+Abscess+Diverticulitis
+AdmissionType+Outcome|Death, data = adm_data)
### Continous variables
table1(~LOS+AdmissionAge|Death, data = adm_data)
## Plots
### Death and Age
adm_data %>%
Paraphrase This Document
Need a fresh take? Get an instant paraphrase of this document with our AI Paraphraser
Foundations of Data Science Assignment 11
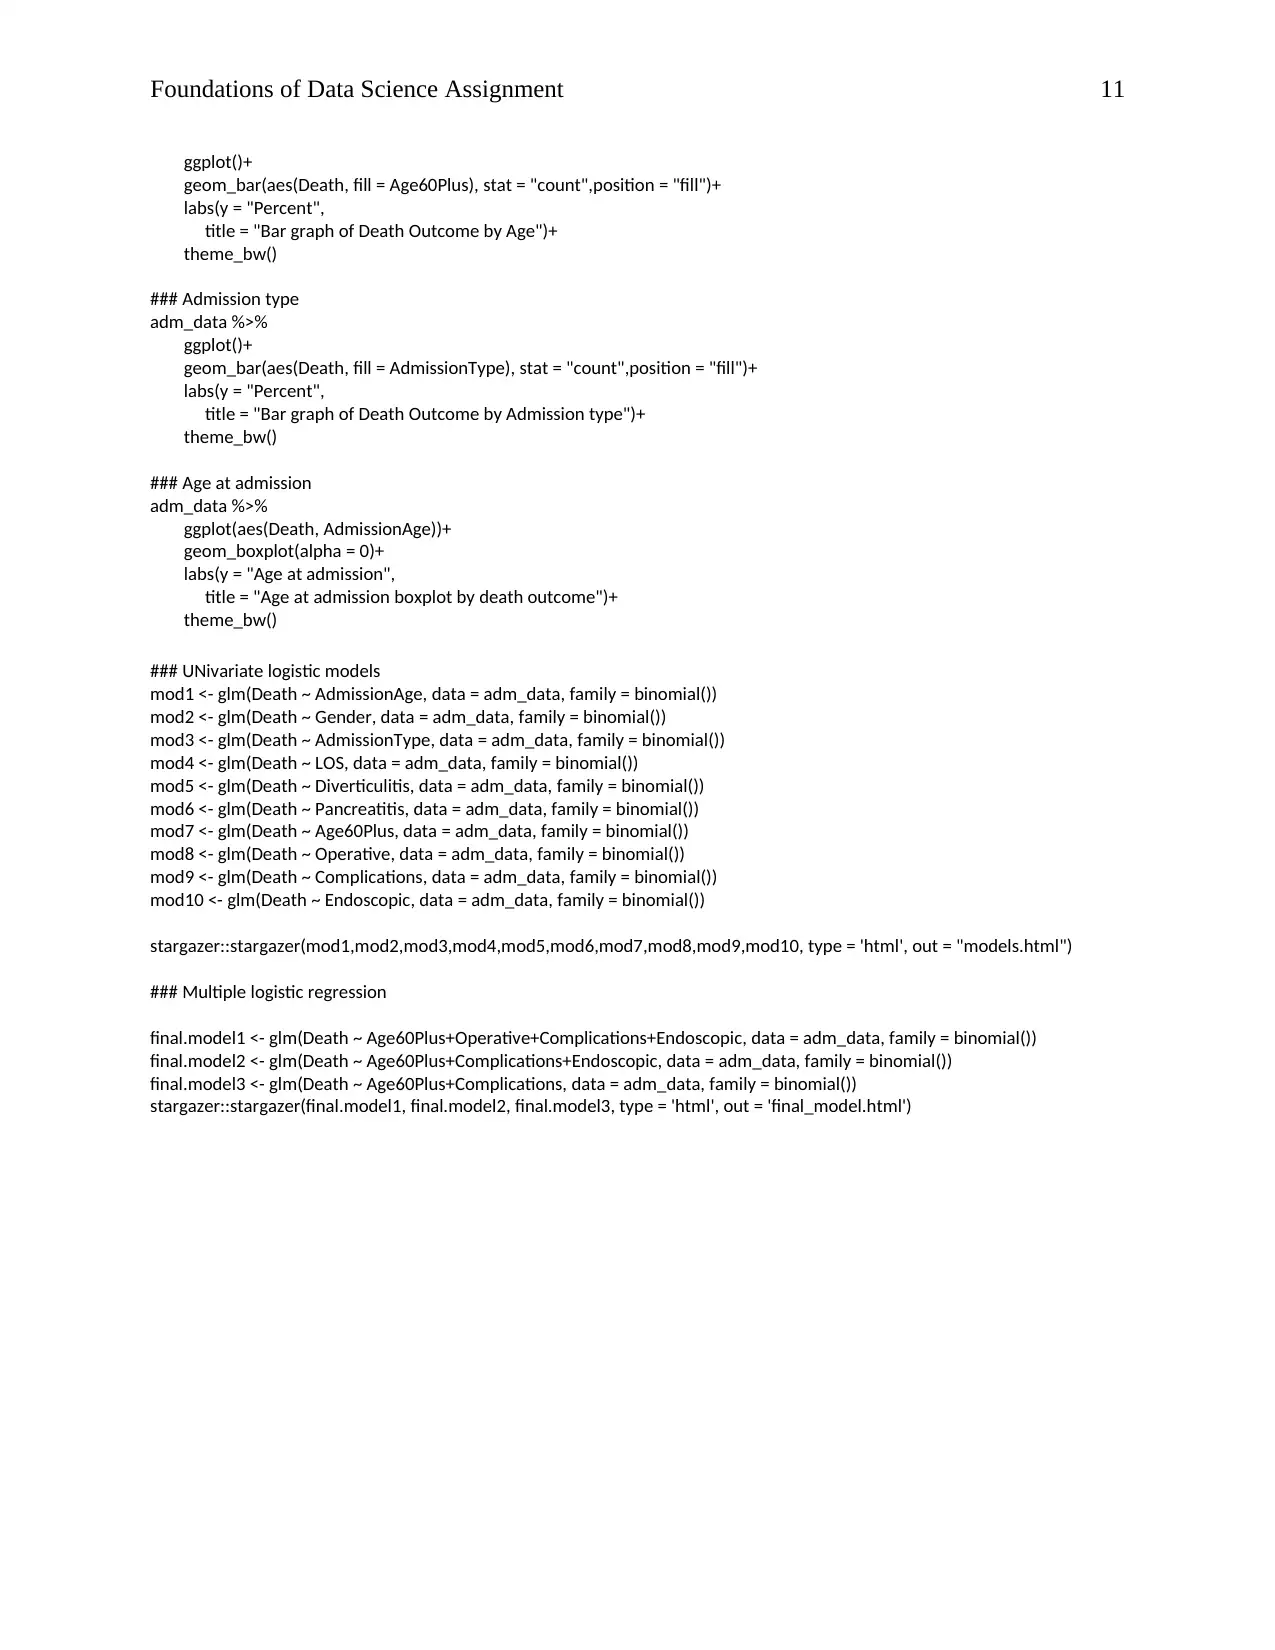
ggplot()+
geom_bar(aes(Death, fill = Age60Plus), stat = "count",position = "fill")+
labs(y = "Percent",
title = "Bar graph of Death Outcome by Age")+
theme_bw()
### Admission type
adm_data %>%
ggplot()+
geom_bar(aes(Death, fill = AdmissionType), stat = "count",position = "fill")+
labs(y = "Percent",
title = "Bar graph of Death Outcome by Admission type")+
theme_bw()
### Age at admission
adm_data %>%
ggplot(aes(Death, AdmissionAge))+
geom_boxplot(alpha = 0)+
labs(y = "Age at admission",
title = "Age at admission boxplot by death outcome")+
theme_bw()
### UNivariate logistic models
mod1 <- glm(Death ~ AdmissionAge, data = adm_data, family = binomial())
mod2 <- glm(Death ~ Gender, data = adm_data, family = binomial())
mod3 <- glm(Death ~ AdmissionType, data = adm_data, family = binomial())
mod4 <- glm(Death ~ LOS, data = adm_data, family = binomial())
mod5 <- glm(Death ~ Diverticulitis, data = adm_data, family = binomial())
mod6 <- glm(Death ~ Pancreatitis, data = adm_data, family = binomial())
mod7 <- glm(Death ~ Age60Plus, data = adm_data, family = binomial())
mod8 <- glm(Death ~ Operative, data = adm_data, family = binomial())
mod9 <- glm(Death ~ Complications, data = adm_data, family = binomial())
mod10 <- glm(Death ~ Endoscopic, data = adm_data, family = binomial())
stargazer::stargazer(mod1,mod2,mod3,mod4,mod5,mod6,mod7,mod8,mod9,mod10, type = 'html', out = "models.html")
### Multiple logistic regression
final.model1 <- glm(Death ~ Age60Plus+Operative+Complications+Endoscopic, data = adm_data, family = binomial())
final.model2 <- glm(Death ~ Age60Plus+Complications+Endoscopic, data = adm_data, family = binomial())
final.model3 <- glm(Death ~ Age60Plus+Complications, data = adm_data, family = binomial())
stargazer::stargazer(final.model1, final.model2, final.model3, type = 'html', out = 'final_model.html')
ggplot()+
geom_bar(aes(Death, fill = Age60Plus), stat = "count",position = "fill")+
labs(y = "Percent",
title = "Bar graph of Death Outcome by Age")+
theme_bw()
### Admission type
adm_data %>%
ggplot()+
geom_bar(aes(Death, fill = AdmissionType), stat = "count",position = "fill")+
labs(y = "Percent",
title = "Bar graph of Death Outcome by Admission type")+
theme_bw()
### Age at admission
adm_data %>%
ggplot(aes(Death, AdmissionAge))+
geom_boxplot(alpha = 0)+
labs(y = "Age at admission",
title = "Age at admission boxplot by death outcome")+
theme_bw()
### UNivariate logistic models
mod1 <- glm(Death ~ AdmissionAge, data = adm_data, family = binomial())
mod2 <- glm(Death ~ Gender, data = adm_data, family = binomial())
mod3 <- glm(Death ~ AdmissionType, data = adm_data, family = binomial())
mod4 <- glm(Death ~ LOS, data = adm_data, family = binomial())
mod5 <- glm(Death ~ Diverticulitis, data = adm_data, family = binomial())
mod6 <- glm(Death ~ Pancreatitis, data = adm_data, family = binomial())
mod7 <- glm(Death ~ Age60Plus, data = adm_data, family = binomial())
mod8 <- glm(Death ~ Operative, data = adm_data, family = binomial())
mod9 <- glm(Death ~ Complications, data = adm_data, family = binomial())
mod10 <- glm(Death ~ Endoscopic, data = adm_data, family = binomial())
stargazer::stargazer(mod1,mod2,mod3,mod4,mod5,mod6,mod7,mod8,mod9,mod10, type = 'html', out = "models.html")
### Multiple logistic regression
final.model1 <- glm(Death ~ Age60Plus+Operative+Complications+Endoscopic, data = adm_data, family = binomial())
final.model2 <- glm(Death ~ Age60Plus+Complications+Endoscopic, data = adm_data, family = binomial())
final.model3 <- glm(Death ~ Age60Plus+Complications, data = adm_data, family = binomial())
stargazer::stargazer(final.model1, final.model2, final.model3, type = 'html', out = 'final_model.html')
1 out of 11
Related Documents


Your All-in-One AI-Powered Toolkit for Academic Success.
+13062052269
info@desklib.com
Available 24*7 on WhatsApp / Email
![[object Object]](/_next/static/media/star-bottom.7253800d.svg)
Unlock your academic potential
Copyright © 2020–2026 A2Z Services. All Rights Reserved. Developed and managed by ZUCOL.