A Comparative Analysis of Investment Opportunities in Emerging Markets

Verified

Added on  2020/04/01

|22
|3870
|370
Report
AI Summary
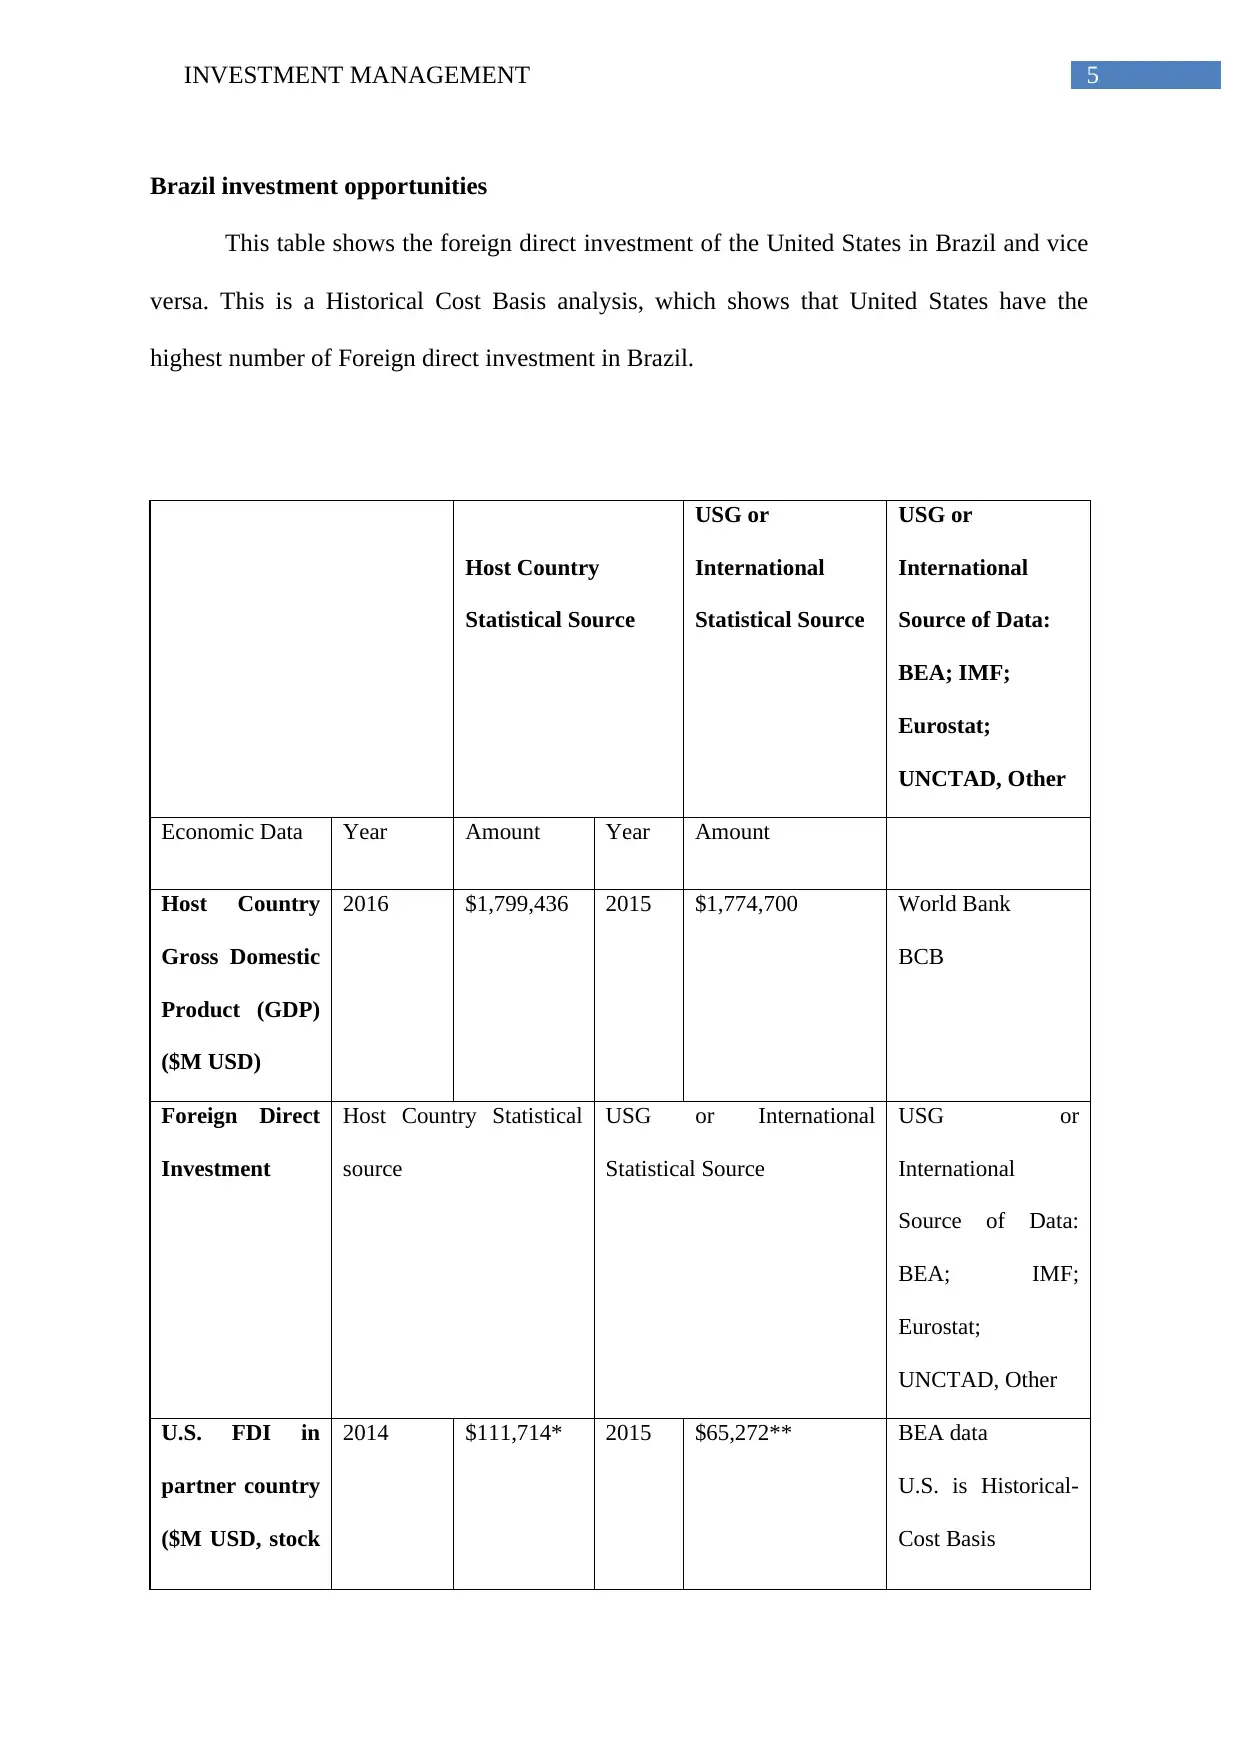
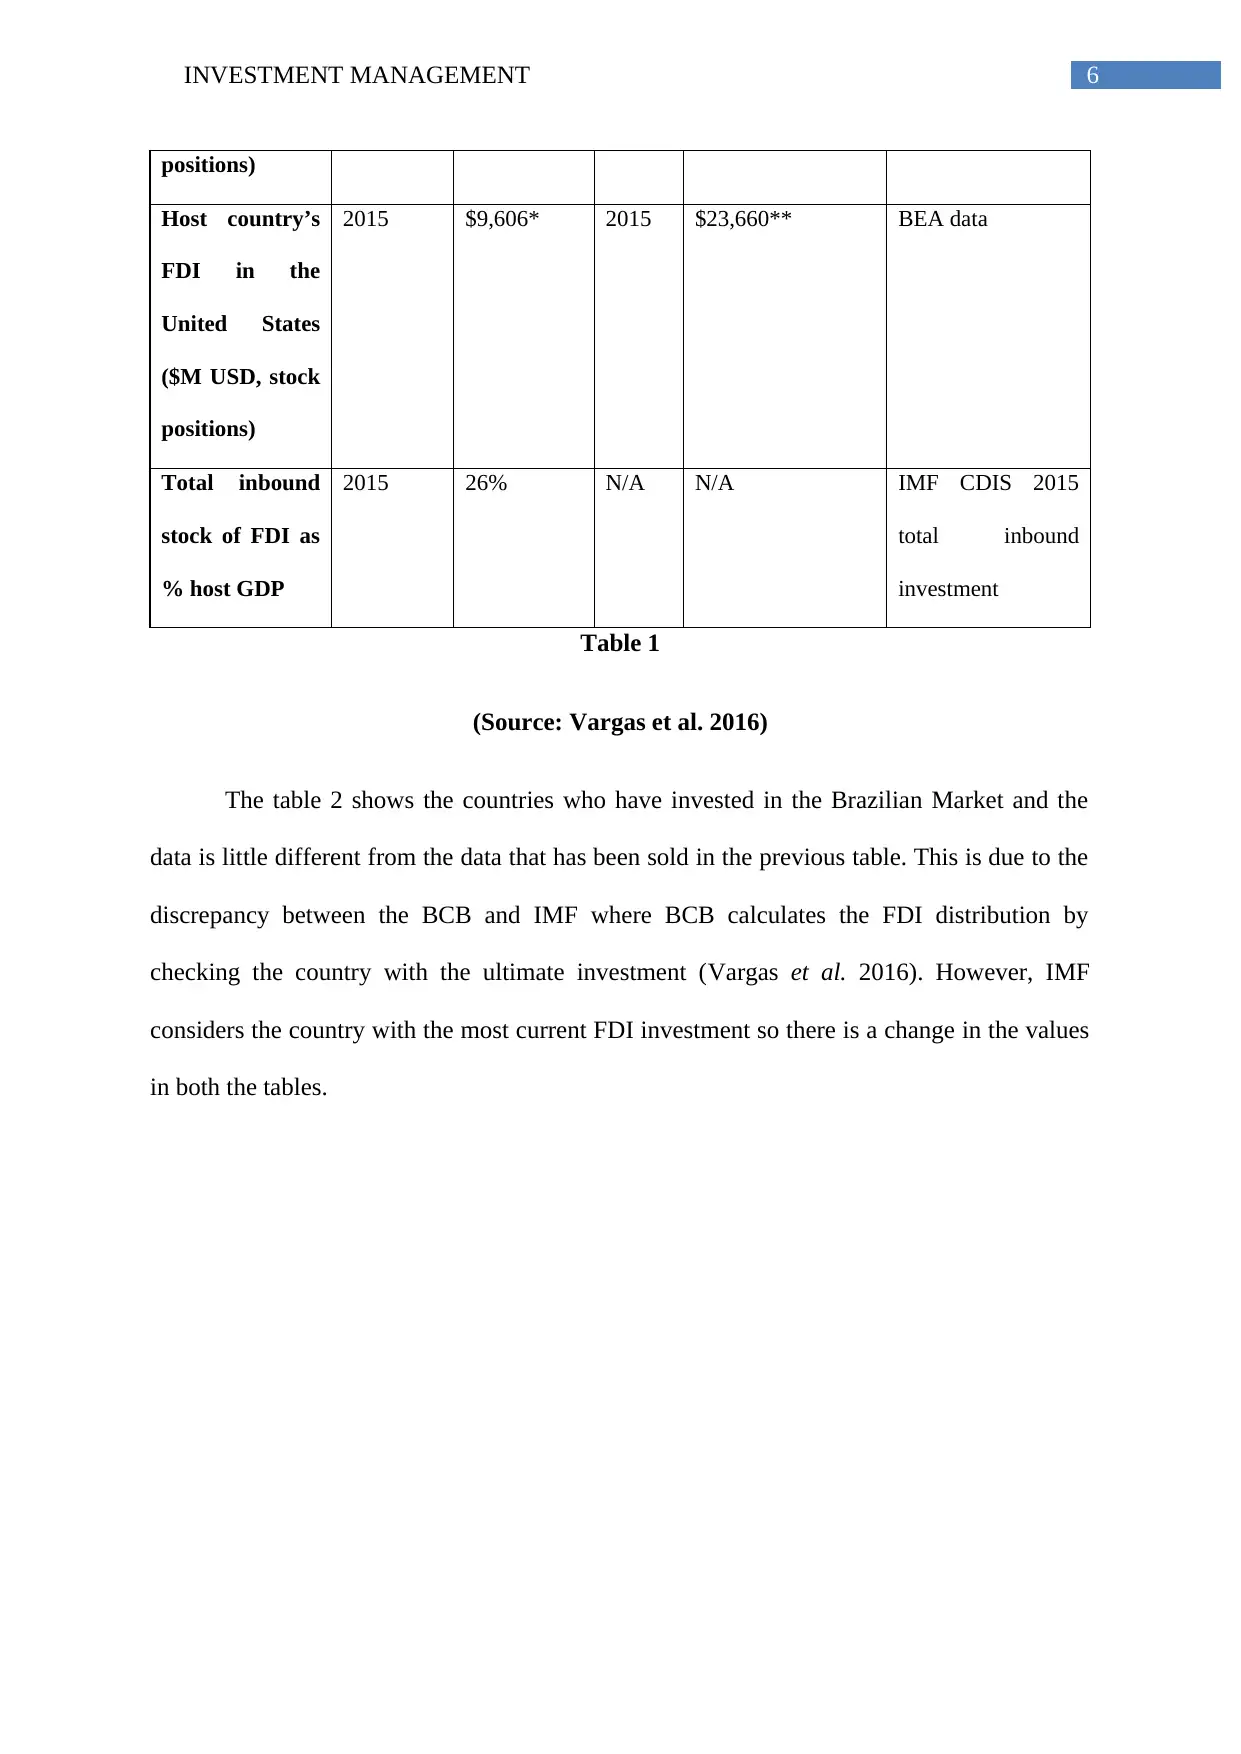
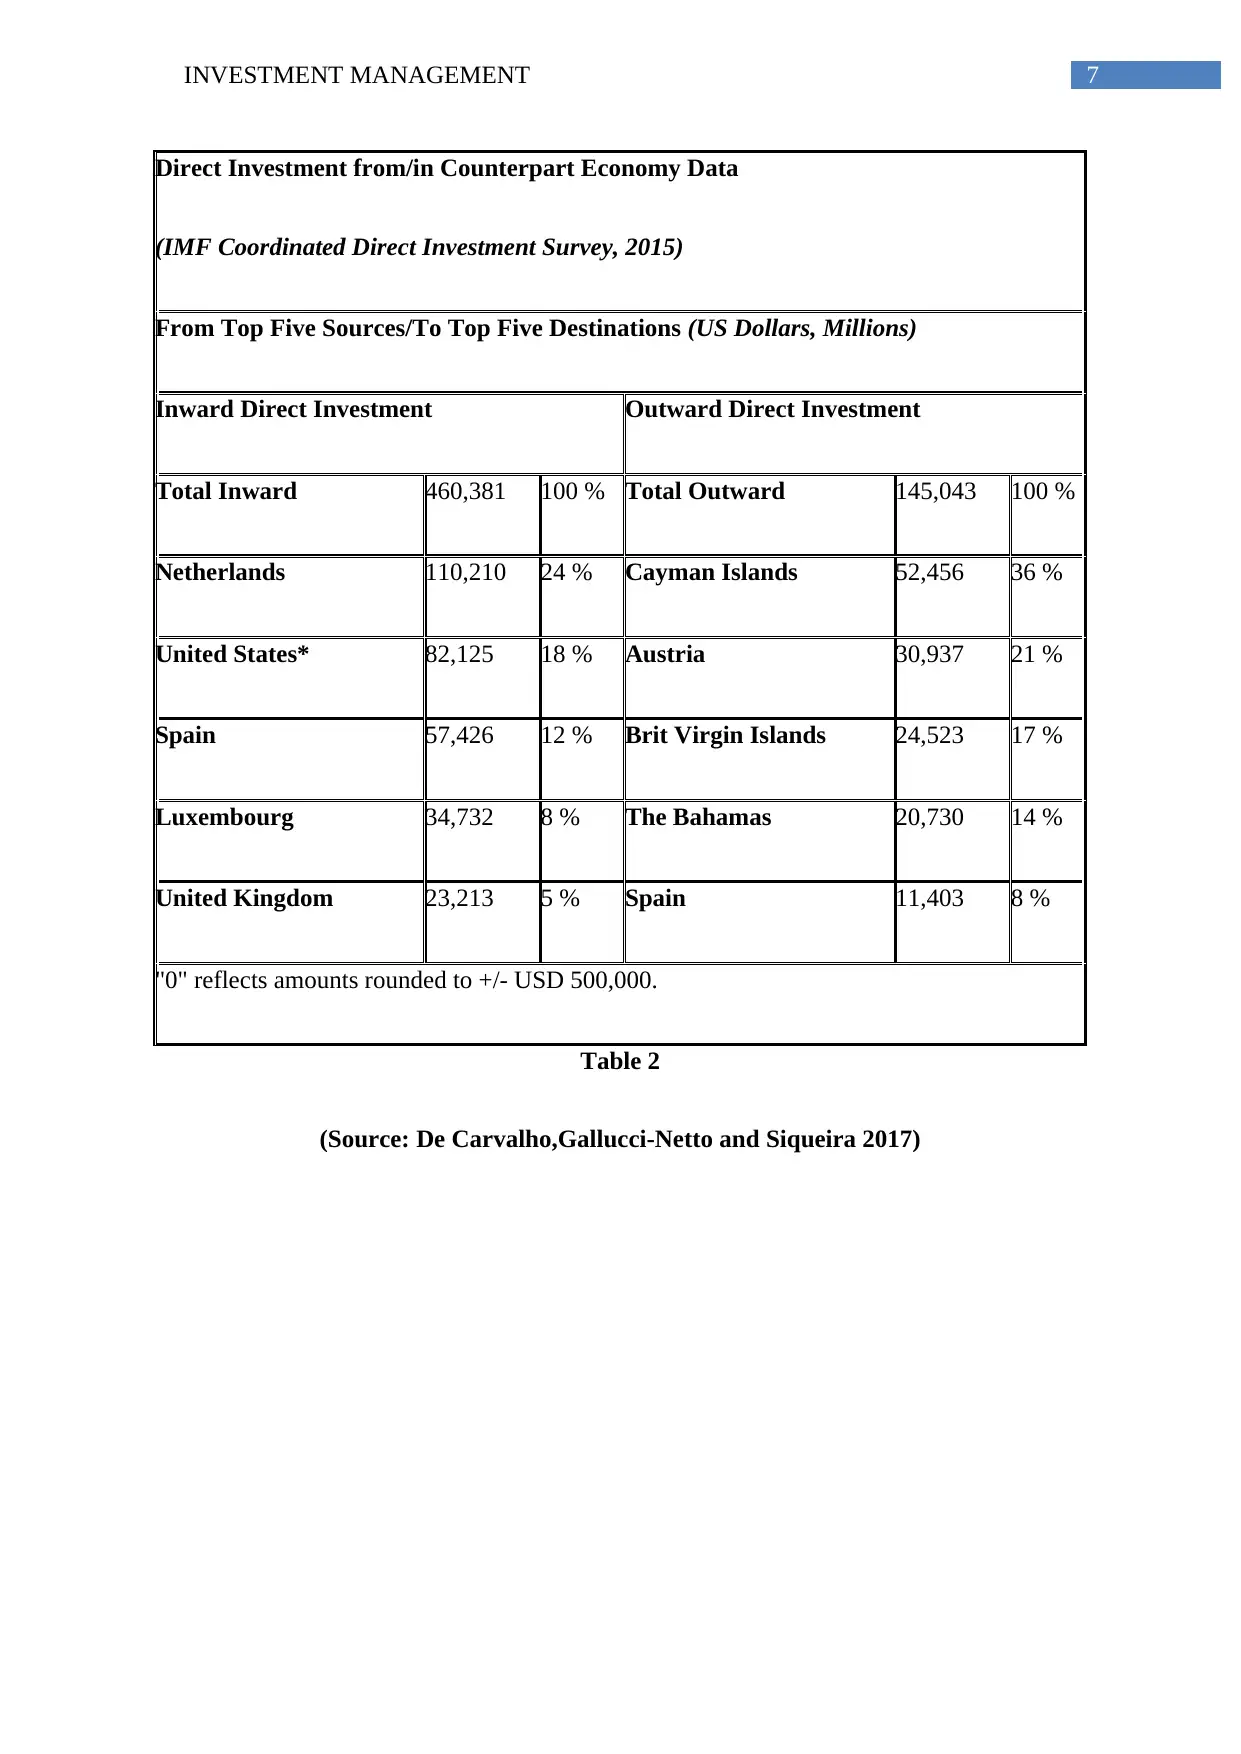
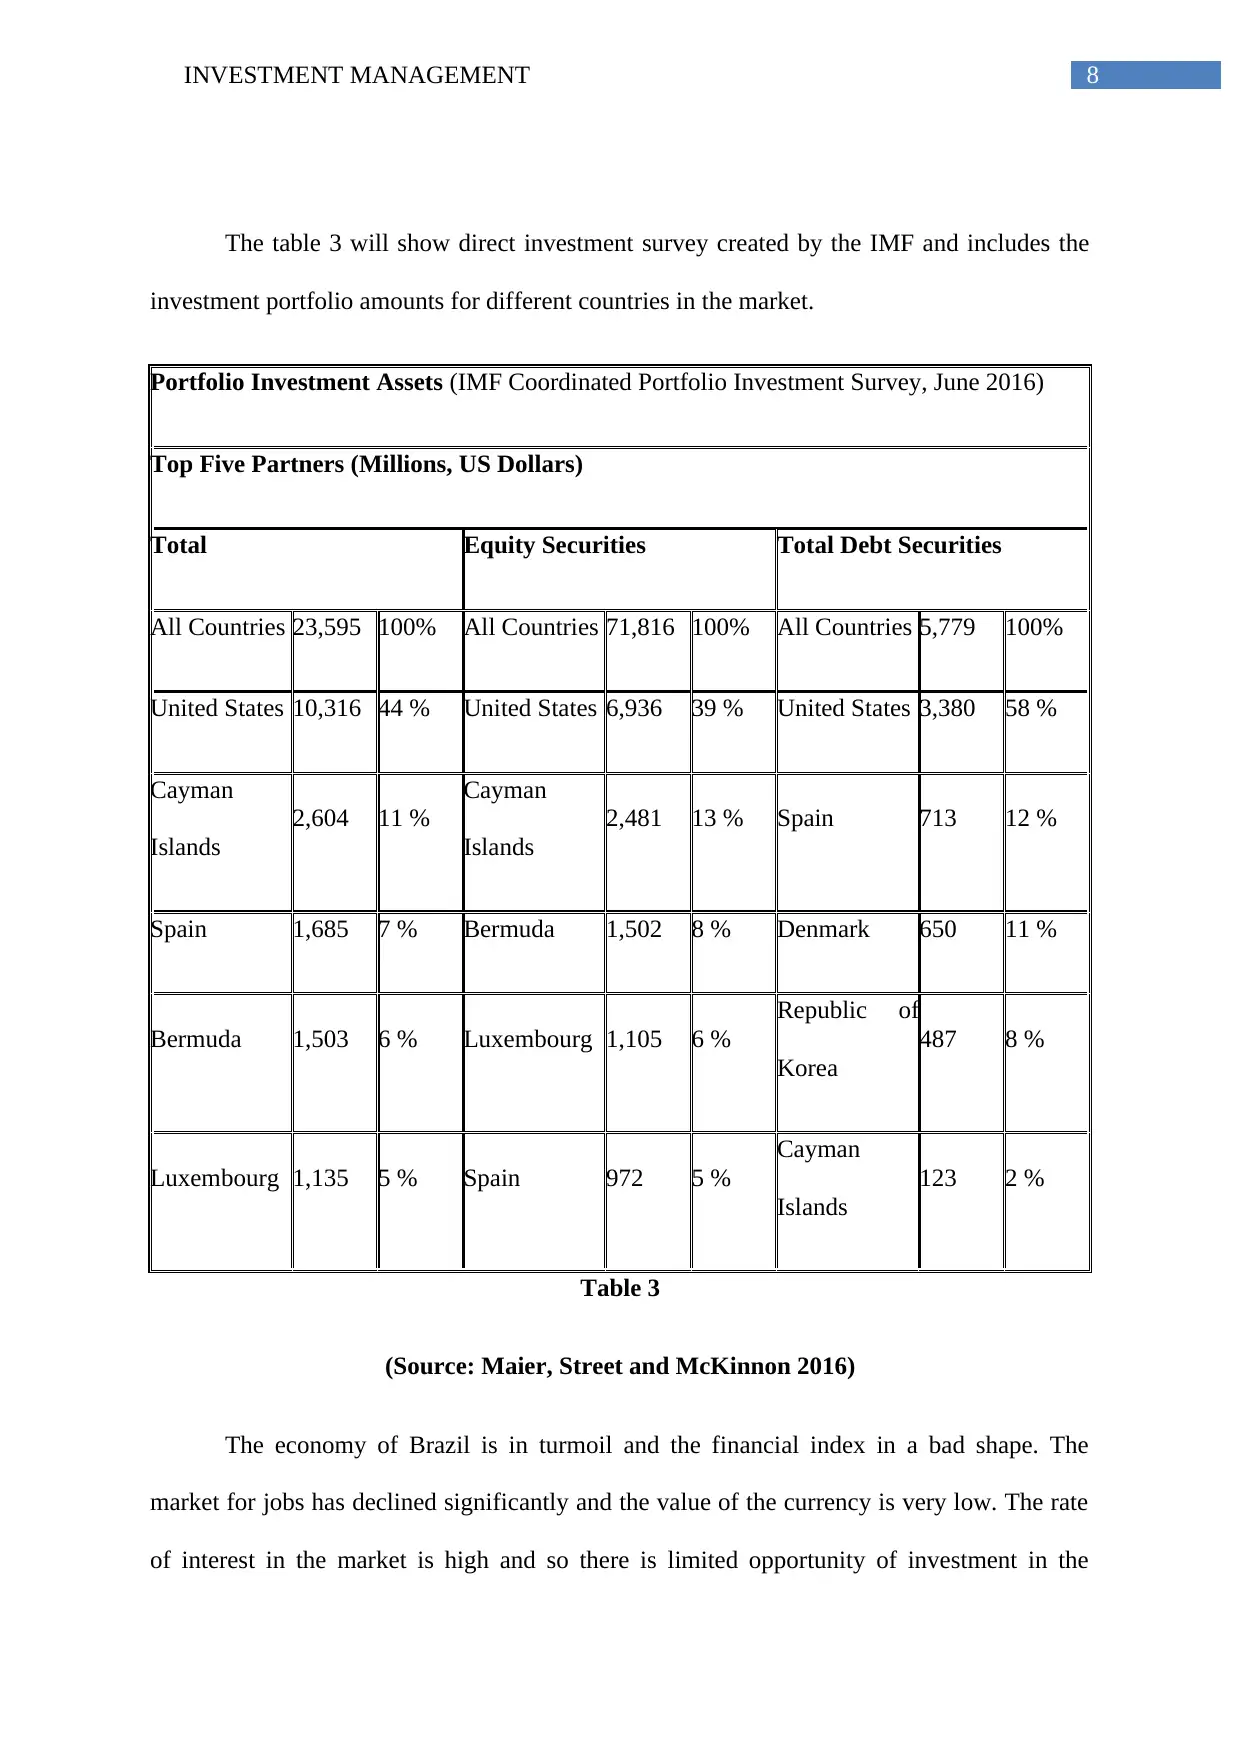
This report provides a detailed analysis of investment opportunities in the emerging markets of Brazil, Russia, India, and China. It examines the economic landscapes, foreign direct investment trends, and portfolio investment scenarios within each country. The report includes tables illustrating key financial data such as GDP, FDI inflows and outflows, and portfolio investment assets, offering a comparative view of each market. It discusses the specific opportunities and challenges within each economy, including the impact of currency fluctuations, interest rates, and political stability. The analysis identifies China as the most suitable market for Australian investors based on its economic growth. Finally, the report touches upon the development of a balanced investment portfolio for the chosen market, providing a comprehensive overview for potential investors.
Document Page
Running head: INVESTMENT MANAGEMENT
Investment management
Name of the student
Name of the university
Author note
tabler-icon-diamond-filled.svg

Paraphrase This Document

Need a fresh take? Get an instant paraphrase of this document with our AI Paraphraser
Document Page
1INVESTMENT MANAGEMENT
Executive Summary
This is a study, which will portray the investment opportunities in the emerging
markets. The countries that have been selected for analyzing the investment opportunities are
Brazil, Russia, India and China. These four countries are emerging in nature and is grabbing
the attention of the foreign investors because of the lucrative setup of these market
economies. Brazil is one of the largest economies in the continent of Latin America and
exporters of energy. The market economy of the country is dependent on the oil and natural
gas market. Similarly, Russia is also dependent on their oil reserves and has faced a lot of
challenges in making a transition from the economy that is planned to a free market economy.
The GDP of the country has progressed immensely and the country is among the largest
economies in the world. India is one of the largest economies and one of the market leaders
of the manufacturing industry. India has made commendable growth in the service sectors as
they provide quality labours at cheap prices. China is the largest member of the BRIC in
terms of GDP and size. China is one of the fastest growing economies in Asia and the foreign
companies are making an effort to build relationship with this Chinese government to make
an entry in to foreign market. Thus, form the above report it can be concluded that the
Chinese market is the most suitable market for Australian investors. The three other emerging
economies are also growing but the economic growth of China is far greater than the other
nations. This is the right time to capitalize on the market situation and the investors will have
to make sure that they analyze the market thoroughly before entering the Chinese market.
Document Page
2INVESTMENT MANAGEMENT
Table of Contents
Introduction................................................................................................................................3
Market analysis..........................................................................................................................3
Brazil investment opportunities.............................................................................................4
Russia investment opportunities............................................................................................8
India Investment opportunities.............................................................................................12
Investment opportunities in China.......................................................................................15
Suitable market.........................................................................................................................17
Balanced portfolio....................................................................................................................17
Conclusion................................................................................................................................18
Reference..................................................................................................................................19
Document Page
3INVESTMENT MANAGEMENT
Introduction
This is a study, which will portray the investment opportunities in the emerging
markets. The countries that have been selected for analyzing the investment opportunities are
Brazil, Russia, India and China. These four countries are emerging in nature and is grabbing
the attention of the foreign investors because of the lucrative setup of these market
economies. Brazil is one of the largest economies in the continent of Latin America and
exporters of energy. The market economy of the country is dependent on the oil and natural
gas market (AlMulali, Solarin and Ozturk 2016). Similarly, Russia is also dependent on their
oil reserves and has faced a lot of challenges in making a transition from the economy that is
planned to a free market economy. The GDP of the country has progressed immensely and
the country is among the largest economies in the world (Yang et al. 2017). India is one of
the largest economies and one of the market leaders of the manufacturing industry. India has
made commendable growth in the service sectors as they provide quality labours at cheap
prices (Negi and Prakash 2016). China is the largest member of the BRIC in terms of GDP
and size. China is one of the fastest growing economies in Asia and the foreign companies
are making an effort to build relationship with this Chinese government to make an entry in
to foreign market (Wang et al. 2016.). The report will consist of analysis of all the emerging
countries, which will help, in identifying the investment opportunities and selecting a suitable
market for the investors in Australia. Finally, the report will conclude with the development
of the balanced portfolio for the chosen market.
Market analysis
The market analysis will consist of the portfolio investment opportunities in the
countries of Brazil, Russia, India and China.
tabler-icon-diamond-filled.svg

Paraphrase This Document

Need a fresh take? Get an instant paraphrase of this document with our AI Paraphraser
Document Page
4INVESTMENT MANAGEMENT
Document Page
5INVESTMENT MANAGEMENT
Brazil investment opportunities
This table shows the foreign direct investment of the United States in Brazil and vice
versa. This is a Historical Cost Basis analysis, which shows that United States have the
highest number of Foreign direct investment in Brazil.
Host Country
Statistical Source
USG or
International
Statistical Source
USG or
International
Source of Data:
BEA; IMF;
Eurostat;
UNCTAD, Other
Economic Data Year Amount Year Amount
Host Country
Gross Domestic
Product (GDP)
($M USD)
2016 $1,799,436 2015 $1,774,700 World Bank
BCB
Foreign Direct
Investment
Host Country Statistical
source
USG or International
Statistical Source
USG or
International
Source of Data:
BEA; IMF;
Eurostat;
UNCTAD, Other
U.S. FDI in
partner country
($M USD, stock
2014 $111,714* 2015 $65,272** BEA data
U.S. is Historical-
Cost Basis
Document Page
6INVESTMENT MANAGEMENT
positions)
Host country’s
FDI in the
United States
($M USD, stock
positions)
2015 $9,606* 2015 $23,660** BEA data
Total inbound
stock of FDI as
% host GDP
2015 26% N/A N/A IMF CDIS 2015
total inbound
investment
Table 1
(Source: Vargas et al. 2016)
The table 2 shows the countries who have invested in the Brazilian Market and the
data is little different from the data that has been sold in the previous table. This is due to the
discrepancy between the BCB and IMF where BCB calculates the FDI distribution by
checking the country with the ultimate investment (Vargas et al. 2016). However, IMF
considers the country with the most current FDI investment so there is a change in the values
in both the tables.
tabler-icon-diamond-filled.svg

Paraphrase This Document

Need a fresh take? Get an instant paraphrase of this document with our AI Paraphraser
Document Page
7INVESTMENT MANAGEMENT
Direct Investment from/in Counterpart Economy Data
(IMF Coordinated Direct Investment Survey, 2015)
From Top Five Sources/To Top Five Destinations (US Dollars, Millions)
Inward Direct Investment Outward Direct Investment
Total Inward 460,381 100 % Total Outward 145,043 100 %
Netherlands 110,210 24 % Cayman Islands 52,456 36 %
United States* 82,125 18 % Austria 30,937 21 %
Spain 57,426 12 % Brit Virgin Islands 24,523 17 %
Luxembourg 34,732 8 % The Bahamas 20,730 14 %
United Kingdom 23,213 5 % Spain 11,403 8 %
"0" reflects amounts rounded to +/- USD 500,000.
Table 2
(Source: De Carvalho,Gallucci-Netto and Siqueira 2017)
Document Page
8INVESTMENT MANAGEMENT
The table 3 will show direct investment survey created by the IMF and includes the
investment portfolio amounts for different countries in the market.
Portfolio Investment Assets (IMF Coordinated Portfolio Investment Survey, June 2016)
Top Five Partners (Millions, US Dollars)
Total Equity Securities Total Debt Securities
All Countries 23,595 100% All Countries 71,816 100% All Countries 5,779 100%
United States 10,316 44 % United States 6,936 39 % United States 3,380 58 %
Cayman
Islands
2,604 11 %
Cayman
Islands
2,481 13 % Spain 713 12 %
Spain 1,685 7 % Bermuda 1,502 8 % Denmark 650 11 %
Bermuda 1,503 6 % Luxembourg 1,105 6 %
Republic of
Korea
487 8 %
Luxembourg 1,135 5 % Spain 972 5 %
Cayman
Islands
123 2 %
Table 3
(Source: Maier, Street and McKinnon 2016)
The economy of Brazil is in turmoil and the financial index in a bad shape. The
market for jobs has declined significantly and the value of the currency is very low. The rate
of interest in the market is high and so there is limited opportunity of investment in the
Document Page
9INVESTMENT MANAGEMENT
market. However, many analysts suggest that that is the best investment opportunities for the
foreign investors. This is due to the fact that the currency of the country is weak and the
exchange rate has a high ratio. Dollar, pound and Euro are the currencies, which are
dominating the Brazilian market so this, can be considered to be the best opportunity for
selling (Maier, Street and McKinnon 2016). The export prices have decreased significantly
due to weak currency of the country and this has increased the export of the products from
the country. The banks are providing the consumers loans at higher rates so that they can gain
even higher return from the market. The international banks feel that the best possible
strategy is to invest in the emerging markets. The decision making of the foreign investor is
the factor, which will decide the amount of revenue they can generate from the emerging
markets.
Russia investment opportunities
The Table 4 shows the foreign direct investment of United States in Russia and vice
versa.
Host
Country
Statistical
Source*
USG or
International
Statistical
Source
USG or International
Source of Data:
BEA; IMF; Eurostat;
UNCTAD, Other
Economic Data Year Amount Year Amount
Host
Country
Gross Domestic
Product
2016 $1.232 2015 $1.331
tabler-icon-diamond-filled.svg

Paraphrase This Document

Need a fresh take? Get an instant paraphrase of this document with our AI Paraphraser
Document Page
10INVESTMENT MANAGEMENT
GDP) ($T
USD)
Foreign Direct
Investment
Host Country
Statistical Source*
USG or International
Statistical Source
USG or international
Source of Data: BEA;
IMF; Eurostat; UNCTAD,
Other
U.S. FDI in
partner country
($M USD, stock
positions)
2016 $2.95
billion
2015 $9.2
billion
Host country’s
FDI in the United
States ($M USD,
stock positions)
2016 $8.09
billion
2015 $4.6
billion
Total inbound
stock of FDI as %
host GDP
2016 0.2% 2015 0.7% N/A
Table 4
(Source: Kolupaev et al. 2015)
Document Page
11INVESTMENT MANAGEMENT
Direct Investment from/in Counterpart Economy Data
From Top Five Sources/To Top Five Destinations (US Dollars, Millions)
Inward Direct Investment
(2015)
Outward Direct Investment (2015)
Total Inward 257,287 100% Total Outward 286,583 100%
Cyprus 86,281 34% Cyprus 104,446 36%
Netherlands 32,368 13% Netherlands 57,461 20%
Bahamas 21,297 8% British Virgin Islands 33,501 12%
Bermuda 13,562 5% Austria 21,054 7%
Germany 13,523 5% Switzerland 16,456 6%
Table 5
(Source: Watson and Seetharam 2014)
This table shows the amount of investment made by the countries in which shows that
Cyprus is one of the leading traders of the foreign direct investment. This shows that the
Russian market is lucrative and is able to grab the attention of lot of foreign investors.
chevron_up_icon
1 out of 22
circle_padding
hide_on_mobile
zoom_out_icon
[object Object]