Corporate Finance Report: EMH, CAPM, and Portfolio Analysis
VerifiedAdded on 2020/06/03
|18
|4173
|96
Report
AI Summary
This report delves into the realm of corporate finance, focusing on the Efficient Market Hypothesis (EMH) and the Capital Asset Pricing Model (CAPM). It begins with a theoretical review of EMH, exploring its weak, semi-strong, and strong forms, and then examines CAPM, including the Security Market Line and its formula. A literature review critically assesses CAPM's effectiveness in the 21st century, followed by an application section that compares and contrasts different portfolios based on beta and return, using the Treynor and Sharpe ratios to evaluate performance. The report concludes with implications of the models and findings, offering insights into investment strategies and market dynamics. The report is a comprehensive analysis of financial models and their practical applications.

Corporate Finance
Paraphrase This Document
Need a fresh take? Get an instant paraphrase of this document with our AI Paraphraser
TABLE OF CONTENTS
INTRODUCTION...........................................................................................................................1
Theory: Review of fundamental features of Efficient Market Hypothesis (EMH) and CAPM:
................................................................................................................................................1
Literature Review: Critical review related to CAPM with discussing effectiveness of the
model in 21st century:.............................................................................................................2
Application: Implication of models and findings:..................................................................4
CONCLUSION AND RECOMMENDATIONS..........................................................................12
REFERENCES..............................................................................................................................13
APPENDIX....................................................................................................................................15
INTRODUCTION
Corporate finance is a division which cross-check the financial activities of a firm. It has
its eyes on optimising the value of shareholder's earnings via long term and short term planning
and using diverse strategies (Higgins, 2012). The area of corporate finance covers variables such
as capital investment to investment banking. This analysis tells about the way in which firm pays
for investment and its effects on shareholders' investment investments (Baker, Singleton and
Viet, 2011).
Theory: Review of fundamental features of Efficient Market Hypothesis (EMH) and CAPM:
Efficient Market Hypothesis: An optimum market is elaborated as a market, where
huge numbers of rational, profit optimisers actively competing with each effort to forecast future
values of individual securities, and where crucial information is available freely to all
participants (Damodaran, 2016). Efficient market hypothesis is related to the theory which
covered in financial economics that demonstrates the asset prices entirely and demonstrates all
the applicable information.
A key application is that which is not possible to “beat the market” regularly on a risk
adjusted basis as market prices need to only respond to the new or advanced information or
changes in discount rates (Brigham and Daves, 2012). EHM emphasised that the stocks are
always traded on fair price which was completely wrong and this has been changed by buying
undervalued inventory and selling the same inventory for the inflated prices. There are three
variables of hypothesis i.e. weak, semi-strong and strong.
In weak form efficiency, future stock prices are not able to forecasts by way of assessing
prices from the past data. Higher returns cannot be attained in the long run by implementing
investment strategies which are based on the historical share prices or other historical data.
Technical analysis tools do not usually make higher returns via few forms of fundamental
analysis which might render excessive returns (Chandra, 2011). This demonstrates that future
share price movements are identified wholly by information not covered in the price series.
Therefore, prices are required to adhere random walk (Dewally and Shao, 2014).
1
⊘ This is a preview!⊘
Do you want full access?
Subscribe today to unlock all pages.
Trusted by 1+ million students worldwide
Under semi-strong form of efficiency, This is applied that share price adjust in
accordance with publicly available new information, and in an unbiased fashion. So that no extra
return can be increased by trading on that information (Ling and Archer, 2012).
Strong form of efficiency, This is rightly observed that share price demonstrates entire
information and no one can gain higher returns. Strong form of efficiency cannot be possible,
except in the case where the laws are universally neglected (Ehrhardt and Brigham, 2016).
Capital asset pricing method: This is the tool which is used by the business analysts to
identify a theoretically adequately required rate of return of an asset, so that the firm can
incorporate decisions about adding assets to a strong diversified portfolio (Altman and
Hotchkiss, 2010).
The Security Market Line importantly graphs the results from capital asset pricing model.
X axis demonstrates the risk and y axis reflects the forecasted return (Brealey and et. al., 2012).
Market risk premium is identified from the slope of SML (Fan, Wei and Xu, 2011). The
connection between risk and return is plotted on the securities market line which demonstrates
forecasted return as a function of Beta. The formula of SML is:
Required return = Risk free rate + (beta coefficient × equity risk premium)
Under this, the risk is recognised by way of beta and return is known as the required rate
of return. It is also known as required rate of return (Flannery and Hankins, 2013).
Literature Review: Critical review related to CAPM with discussing effectiveness of the model
in 21st century:
The term beta in the CAPM is symbolizes the systematic risk of return that is used as
exposure of market (Saunders and Cornett, 2012). The portfolio frontier depicts every best
combination of assets in a portfolio. With the diversification in frontier line with an infinite or
positive value indicate every possible outcome for the company.
Effectiveness of CAPM model on 21th century:
As per Liang, (2011), CAPM is a model which helps in identification of the relationship
between risk and expected returns for assets. So, this model contributes in the determination of
risks which are associated with transactions and assets as well as their ability of generating
profits (Fracassi, 2016).
2
Paraphrase This Document
Need a fresh take? Get an instant paraphrase of this document with our AI Paraphraser
According to Arnold, 2013 This CAPM model is used by the investment bankers and
financial analysts in measurement of risks which are associated with the investments made by
them in different securities.
In the words of Chandra, 2011 early work of mean variances portfolio theory is provided
the foundation on which capital asset pricing model will be develop. There are mainly three key
assumptions are made which are associated with expected risk premium of an assets return. It
can be attaining by an effective analysis on complete market instead of common level (Grinblatt,
and Titman, 2016). The beta term in CAPM means that systematic risk of an assets return is
often said to be effective parts of market.
As per Higgins, 2012 the portfolios frontier depicts all every combination of assets in a
portfolio. With proper diversification can shift frontier to left and a reduction in risk for a
specific return.
In the opinion of Myers, 2012 if it has been assumed that investors are having
homogeneous mean-variances thought then all external parties can hold the contact portfolios
(Brigham and Houston, 2012). Every point on the line provide an economical finance that
investing in only risky assets. Some assumptions are:
Position of market is in equilibrium stage
Mean-variance investors
Consistent beliefs regarding the mean-variance (Pettit, 2011).
There are large number of effectiveness of CAPM model in 21th century which defines below:
This model is effective for investment bankers, financial analysts and accountants in
calculation of cost of equity and the risks which are associated with assets (Haas, 2014).
This also helps in calculation of NPV of future cash flows and the value of company.
This model is important for continuous learning and improve their finance career by
helpful in learning of these like, WACC, valuation methods, comparable company
analysis and finance modelling guide (Moles, Parrino and Kidwell, 2011).
Application: Implication of models and findings:
Finding of EMH:
It implies that future prices change is determine wholly by data not contained in the
prices series.
Investors are risk aversion they need to plan their investment in more effective manner.
3
It is correct to have present stock price which is already reflect past and present published
information those are available with them (Calomiris and Herring, 2013).
CAPM:
It is mainly providing information about risk and expected return a company is getting
during the year.
The equity market premium include foreseen return from the market as a entire low the
risk free rate of return (Almeida, Campello and Weisbach, 2011).
It is used to determine whether investors security is undervalued and overvalued.
Comparison CAPM with the market:
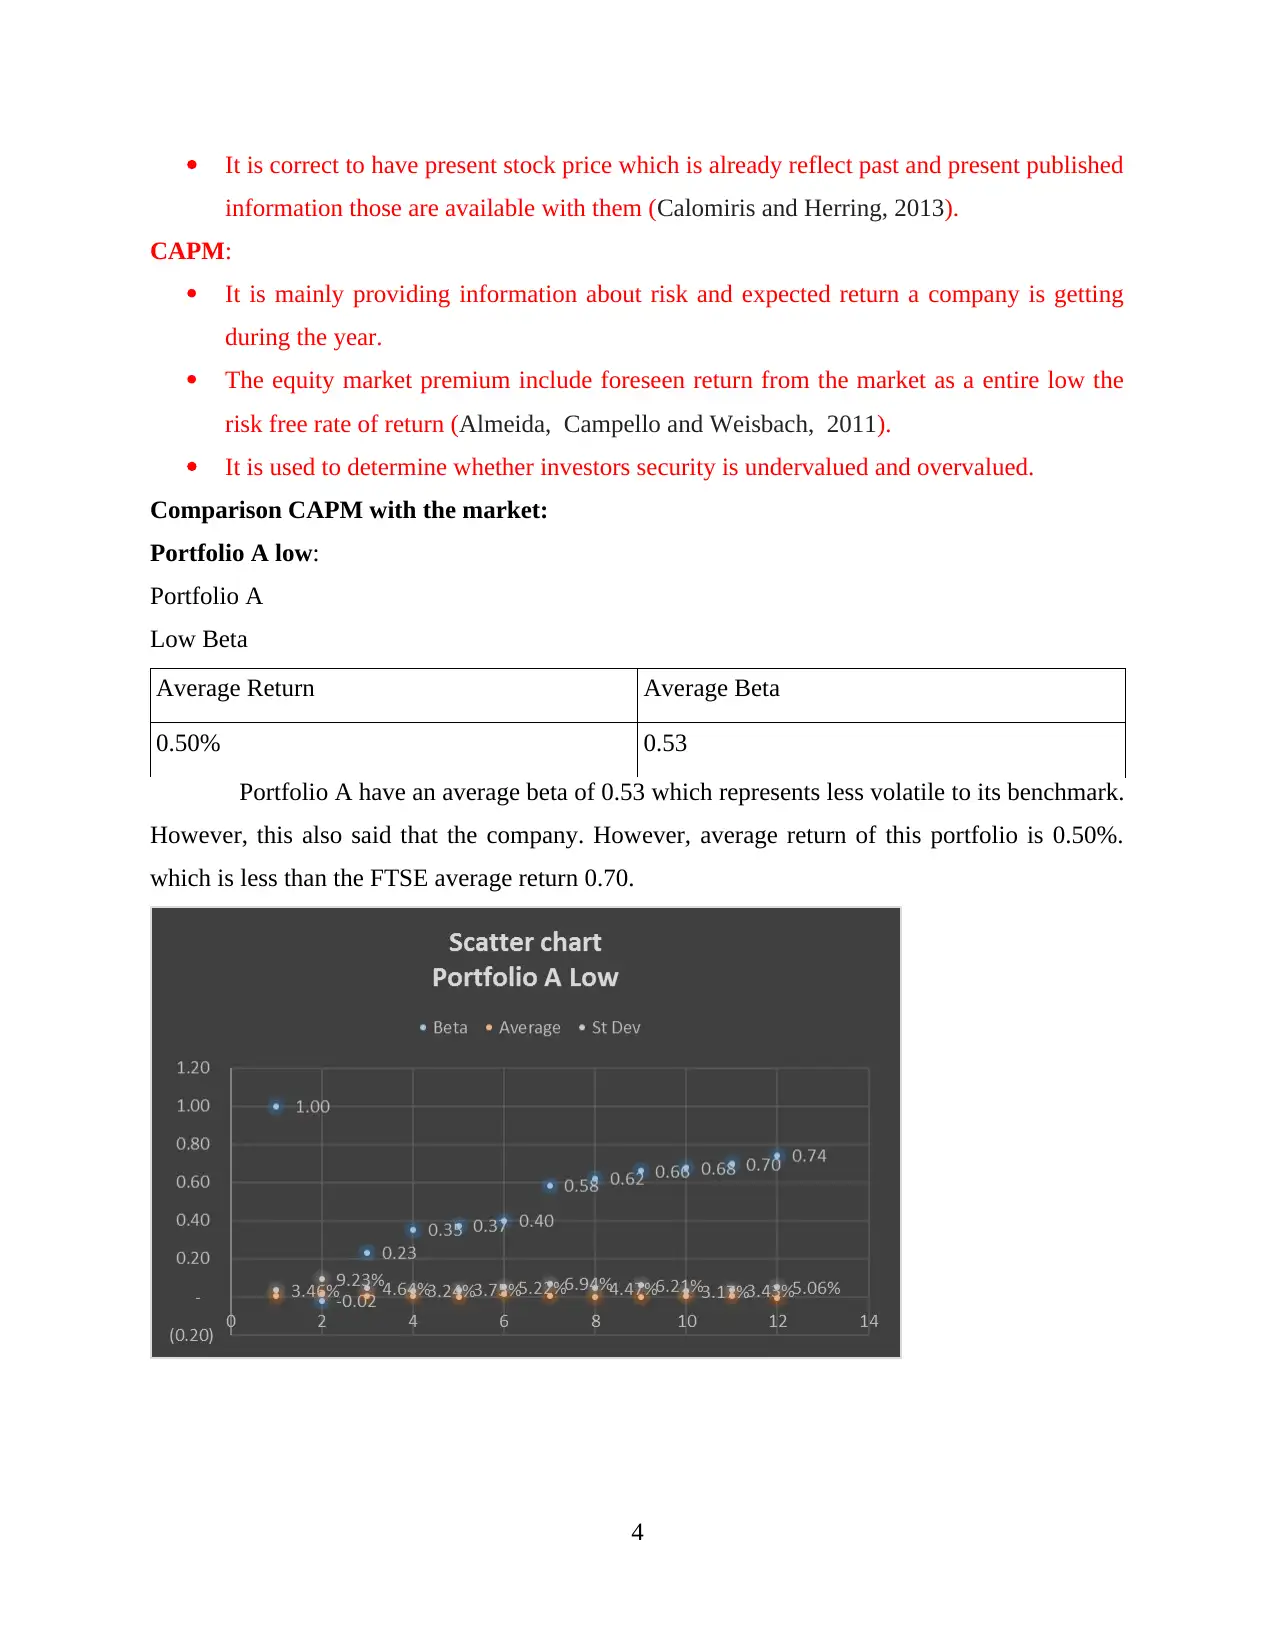
Portfolio A low:
Portfolio A
Low Beta
Average Return Average Beta
0.50% 0.53
Portfolio A have an average beta of 0.53 which represents less volatile to its benchmark.
However, this also said that the company. However, average return of this portfolio is 0.50%.
which is less than the FTSE average return 0.70.
4
information those are available with them (Calomiris and Herring, 2013).
CAPM:
It is mainly providing information about risk and expected return a company is getting
during the year.
The equity market premium include foreseen return from the market as a entire low the
risk free rate of return (Almeida, Campello and Weisbach, 2011).
It is used to determine whether investors security is undervalued and overvalued.
Comparison CAPM with the market:
Portfolio A low:
Portfolio A
Low Beta
Average Return Average Beta
0.50% 0.53
Portfolio A have an average beta of 0.53 which represents less volatile to its benchmark.
However, this also said that the company. However, average return of this portfolio is 0.50%.
which is less than the FTSE average return 0.70.
4
⊘ This is a preview!⊘
Do you want full access?
Subscribe today to unlock all pages.
Trusted by 1+ million students worldwide
From the above graph, this has been observed that the portfolio A is having 10 companies from
FTSE250. These are having less beta and standard deviation. Which represents that these
companies are having more return with less risk. This is presumed to be the best portfolio and
investors will tend to invest their money for buying this tool. The average return of this beta
0.50% and average beta of this portfolio is 0.53. TEP company’s beta is -0.2 which reflects the
least beta. Along-with this, standard deviation of this company is also least as compare to others
which is covered in this portfolio.
Justification:
This portfolio A is having lower return than the market. Hence, it is assuming to be the
underperforming portfolio. Thus, investors should not invest under Portfolio A due to the low
return then the market.
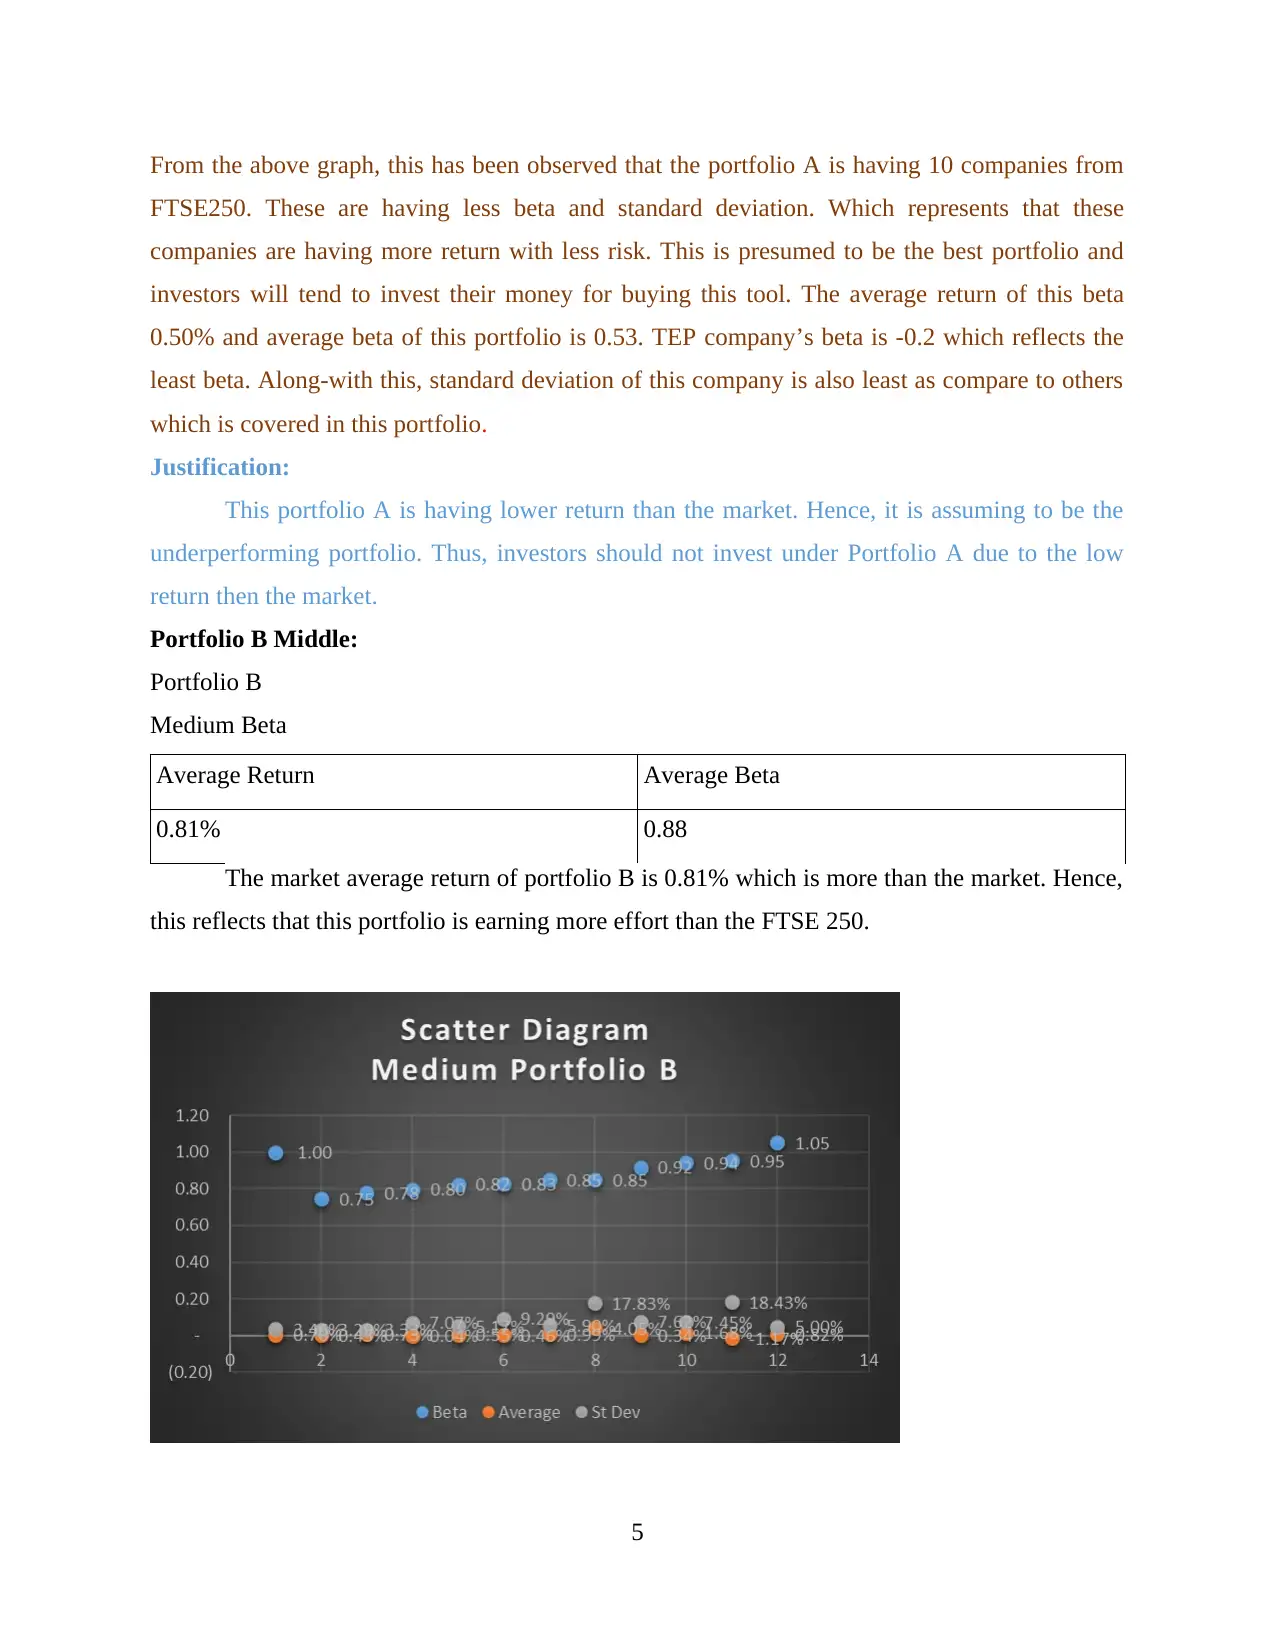
Portfolio B Middle:
Portfolio B
Medium Beta
Average Return Average Beta
0.81% 0.88
The market average return of portfolio B is 0.81% which is more than the market. Hence,
this reflects that this portfolio is earning more effort than the FTSE 250.
5
FTSE250. These are having less beta and standard deviation. Which represents that these
companies are having more return with less risk. This is presumed to be the best portfolio and
investors will tend to invest their money for buying this tool. The average return of this beta
0.50% and average beta of this portfolio is 0.53. TEP company’s beta is -0.2 which reflects the
least beta. Along-with this, standard deviation of this company is also least as compare to others
which is covered in this portfolio.
Justification:
This portfolio A is having lower return than the market. Hence, it is assuming to be the
underperforming portfolio. Thus, investors should not invest under Portfolio A due to the low
return then the market.
Portfolio B Middle:
Portfolio B
Medium Beta
Average Return Average Beta
0.81% 0.88
The market average return of portfolio B is 0.81% which is more than the market. Hence,
this reflects that this portfolio is earning more effort than the FTSE 250.
5
Paraphrase This Document
Need a fresh take? Get an instant paraphrase of this document with our AI Paraphraser
According the above graph, this has been observed that the 10 companies are selected from the
FTSE250 which are having the middle beta and standard deviation. TRY company is having 1.05
beta which represents that the company is having more risk than others. while, CAPC have
higher standard deviation in this portfolio. This portfolio has average return of 0.52 and while
this is having average Beta of 0.88. which reflects more return than the portfolio A.
Justification:
The portfolio B is having high rate with 81% of market share so it is more effective for
the investors to invest under this portfolio. They would get more positive outcomes from there
capital investment.
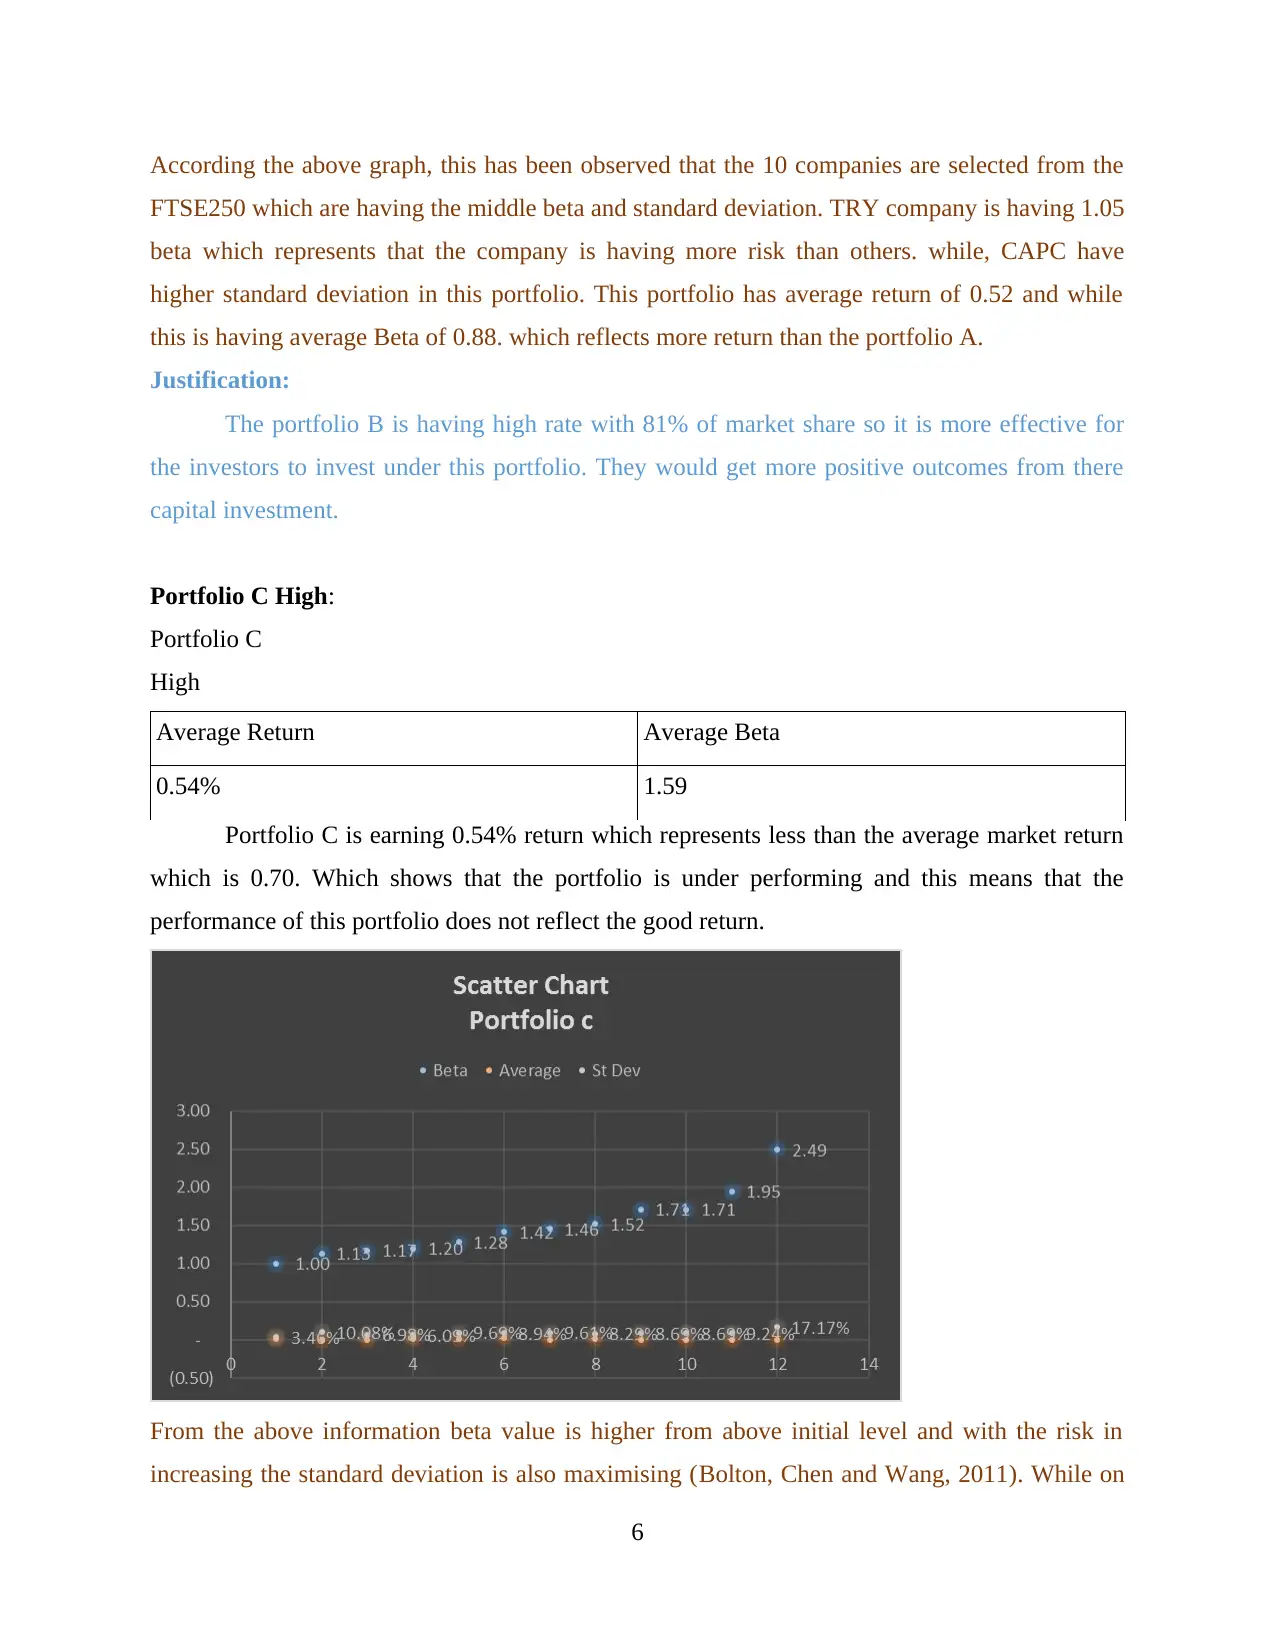
Portfolio C High:
Portfolio C
High
Average Return Average Beta
0.54% 1.59
Portfolio C is earning 0.54% return which represents less than the average market return
which is 0.70. Which shows that the portfolio is under performing and this means that the
performance of this portfolio does not reflect the good return.
From the above information beta value is higher from above initial level and with the risk in
increasing the standard deviation is also maximising (Bolton, Chen and Wang, 2011). While on
6
FTSE250 which are having the middle beta and standard deviation. TRY company is having 1.05
beta which represents that the company is having more risk than others. while, CAPC have
higher standard deviation in this portfolio. This portfolio has average return of 0.52 and while
this is having average Beta of 0.88. which reflects more return than the portfolio A.
Justification:
The portfolio B is having high rate with 81% of market share so it is more effective for
the investors to invest under this portfolio. They would get more positive outcomes from there
capital investment.
Portfolio C High:
Portfolio C
High
Average Return Average Beta
0.54% 1.59
Portfolio C is earning 0.54% return which represents less than the average market return
which is 0.70. Which shows that the portfolio is under performing and this means that the
performance of this portfolio does not reflect the good return.
From the above information beta value is higher from above initial level and with the risk in
increasing the standard deviation is also maximising (Bolton, Chen and Wang, 2011). While on
6
the other hand, this has been observed that 10 companies under this portfolio are having higher
beta and standard deviation which reflects the greater risk with the higher return. However,
OCDO have greater beta 2.49 which reflects higher risk along-with the greater return.
Justification:
The Portfolio C is having less average return and its beta risk is also above 1. Hence, the
investors are at highly risk if they are investing under this portfolio. As the market is more
volatile as compare to the return they are getting from the investment.
Overall comparison:
From the above three portfolios A, B and C. They are indicating low, medium and high
beta growth return. Out of them, portfolio B is more effective for the purpose of making
investment. It is so because they are generating more return from the market.
Trey nor Ratio: This is calculated by using below mentioned formula:
Average portfolio Return-Average risk free rate/ Beta of the portfolio.
Portfolio Low Medium High
Rf 0.25% 0.25% 0.25%
Rm 0.70% 0.70% 0.70%
Beta 0.53 0.88 1.59
CAPM
Return 0.49% 0.65% 0.97%
TREYNOR RATIO
TREYNOR Portfolio A Portfolio B Portfolio C
Ri 0.50% 0.52 0.54%
Rf 0.25% 0.25% 0.25%
Beta 0.53 0.88 1.59
Ratio 0.47% 0.38% 0.18%
Sharpe ratio: This is calculated by using under mentioned formula. Which is described as under:
Expected portfolio return- risk free rate of return/portfolio standard deviation
SHARPE
RATIO
SHARPE Portfolio D Portfolio E Portfolio F
7
⊘ This is a preview!⊘
Do you want full access?
Subscribe today to unlock all pages.
Trusted by 1+ million students worldwide
Rp 0.41% 0.70% 0.67
Rf 0.25% 0.25% 0.25%
Std Dev 4.05% 6.95% 9.65%
Ratio 4.01% 6.48% 9.06%
Impact of Sharpe and Tyrenor
In Sharpe ratio of a risk free assets is completely zero. Portfolios diversification having
negative correlation (Cao, Pan and Tian, 2011). In order to reduce the risk increase in Sharpe
ratio is more beneficial.
While, Traynor is rewarded as to volatility ratio. It consists of optimal risky portfolios
which is having passive market. It measures the risk premium compared to the portfolios beta.
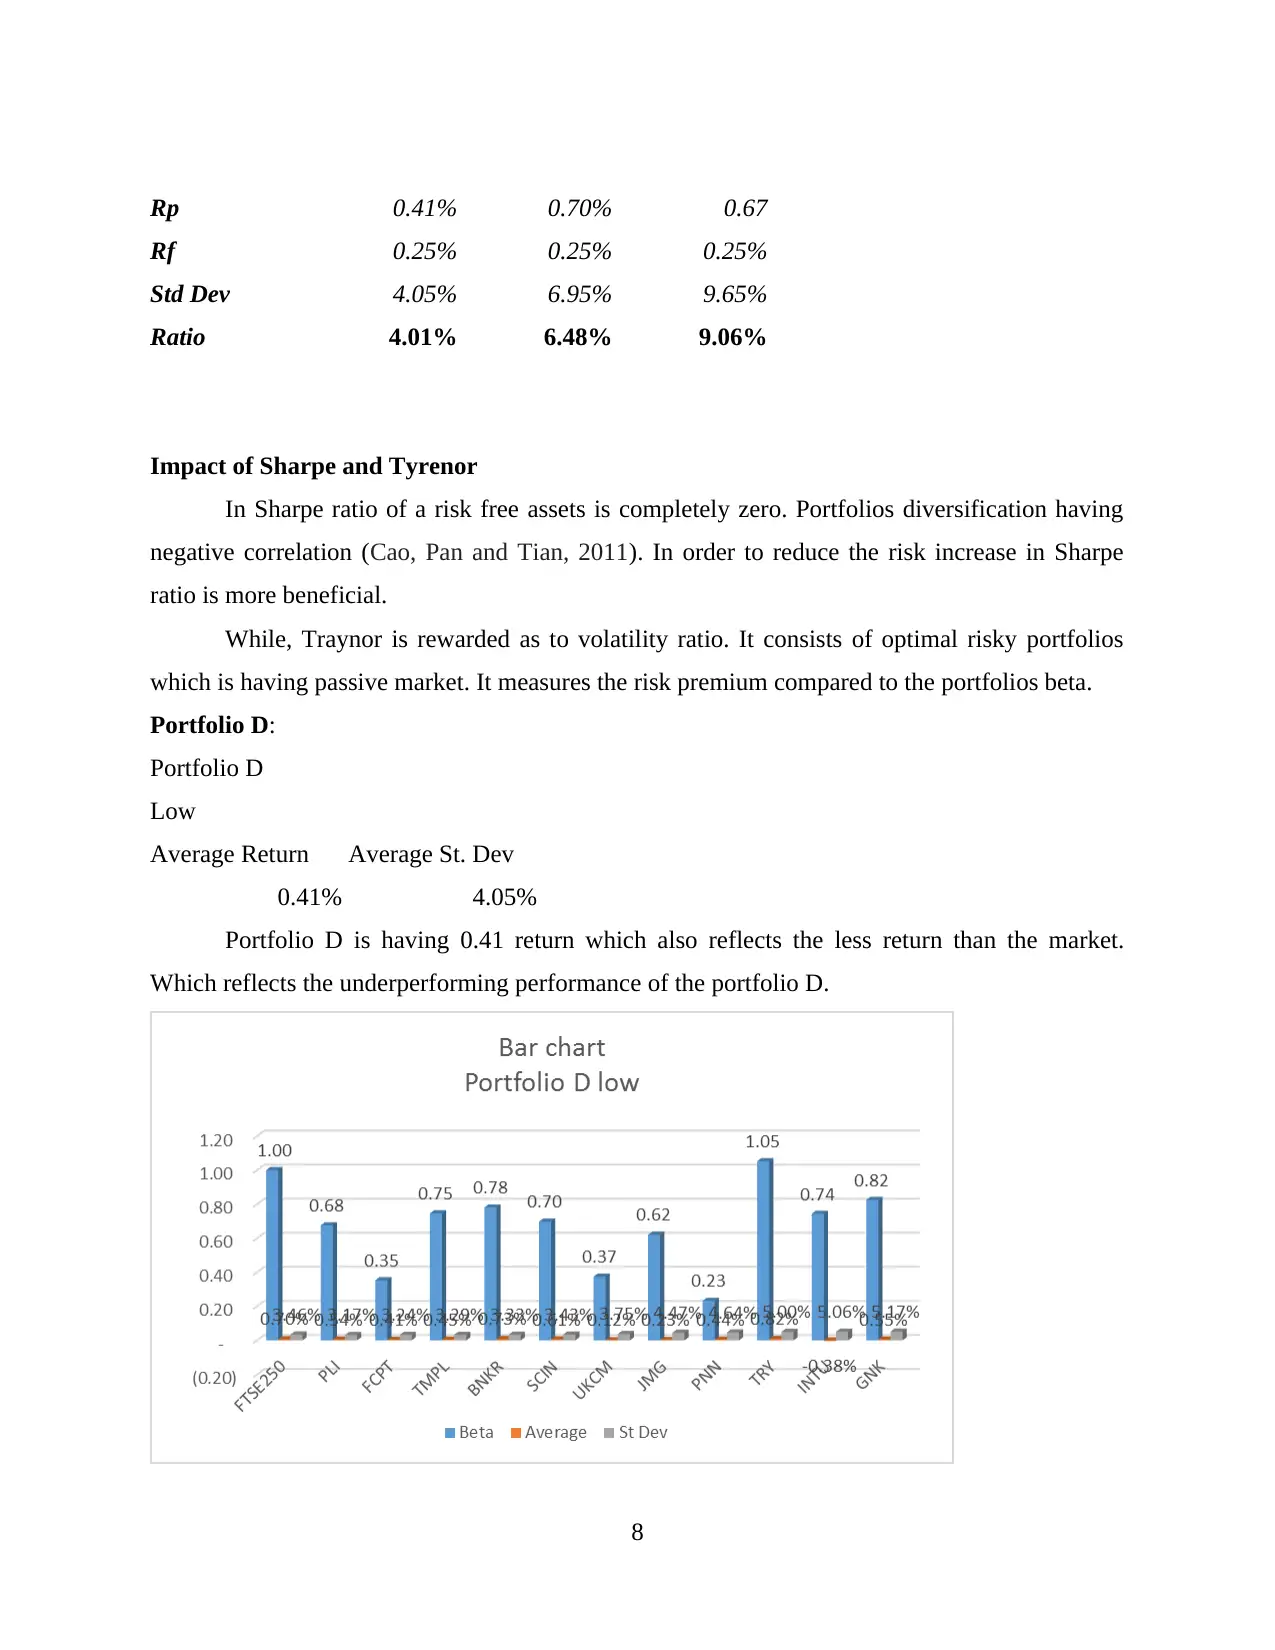
Portfolio D:
Portfolio D
Low
Average Return Average St. Dev
0.41% 4.05%
Portfolio D is having 0.41 return which also reflects the less return than the market.
Which reflects the underperforming performance of the portfolio D.
8
Rf 0.25% 0.25% 0.25%
Std Dev 4.05% 6.95% 9.65%
Ratio 4.01% 6.48% 9.06%
Impact of Sharpe and Tyrenor
In Sharpe ratio of a risk free assets is completely zero. Portfolios diversification having
negative correlation (Cao, Pan and Tian, 2011). In order to reduce the risk increase in Sharpe
ratio is more beneficial.
While, Traynor is rewarded as to volatility ratio. It consists of optimal risky portfolios
which is having passive market. It measures the risk premium compared to the portfolios beta.
Portfolio D:
Portfolio D
Low
Average Return Average St. Dev
0.41% 4.05%
Portfolio D is having 0.41 return which also reflects the less return than the market.
Which reflects the underperforming performance of the portfolio D.
8
Paraphrase This Document
Need a fresh take? Get an instant paraphrase of this document with our AI Paraphraser
In the above graphs, it has been seen that beta is more fluctuating as compare to standard
deviation. At every level the risk is minimising and it will increase profitability for the company.
The beta of TRY is higher as compare to other companies but standard deviation is at zero. The
average return of this portfolio D is having 0.41 average return which reflects average standard
deviation 4.05 (Mathuva, 2015).
Justification:
As the market return in lower than average standard deviation which is not perfect for the
investors to invest their capital. The chances of getting healthy return in very low because the
market is more volatile.
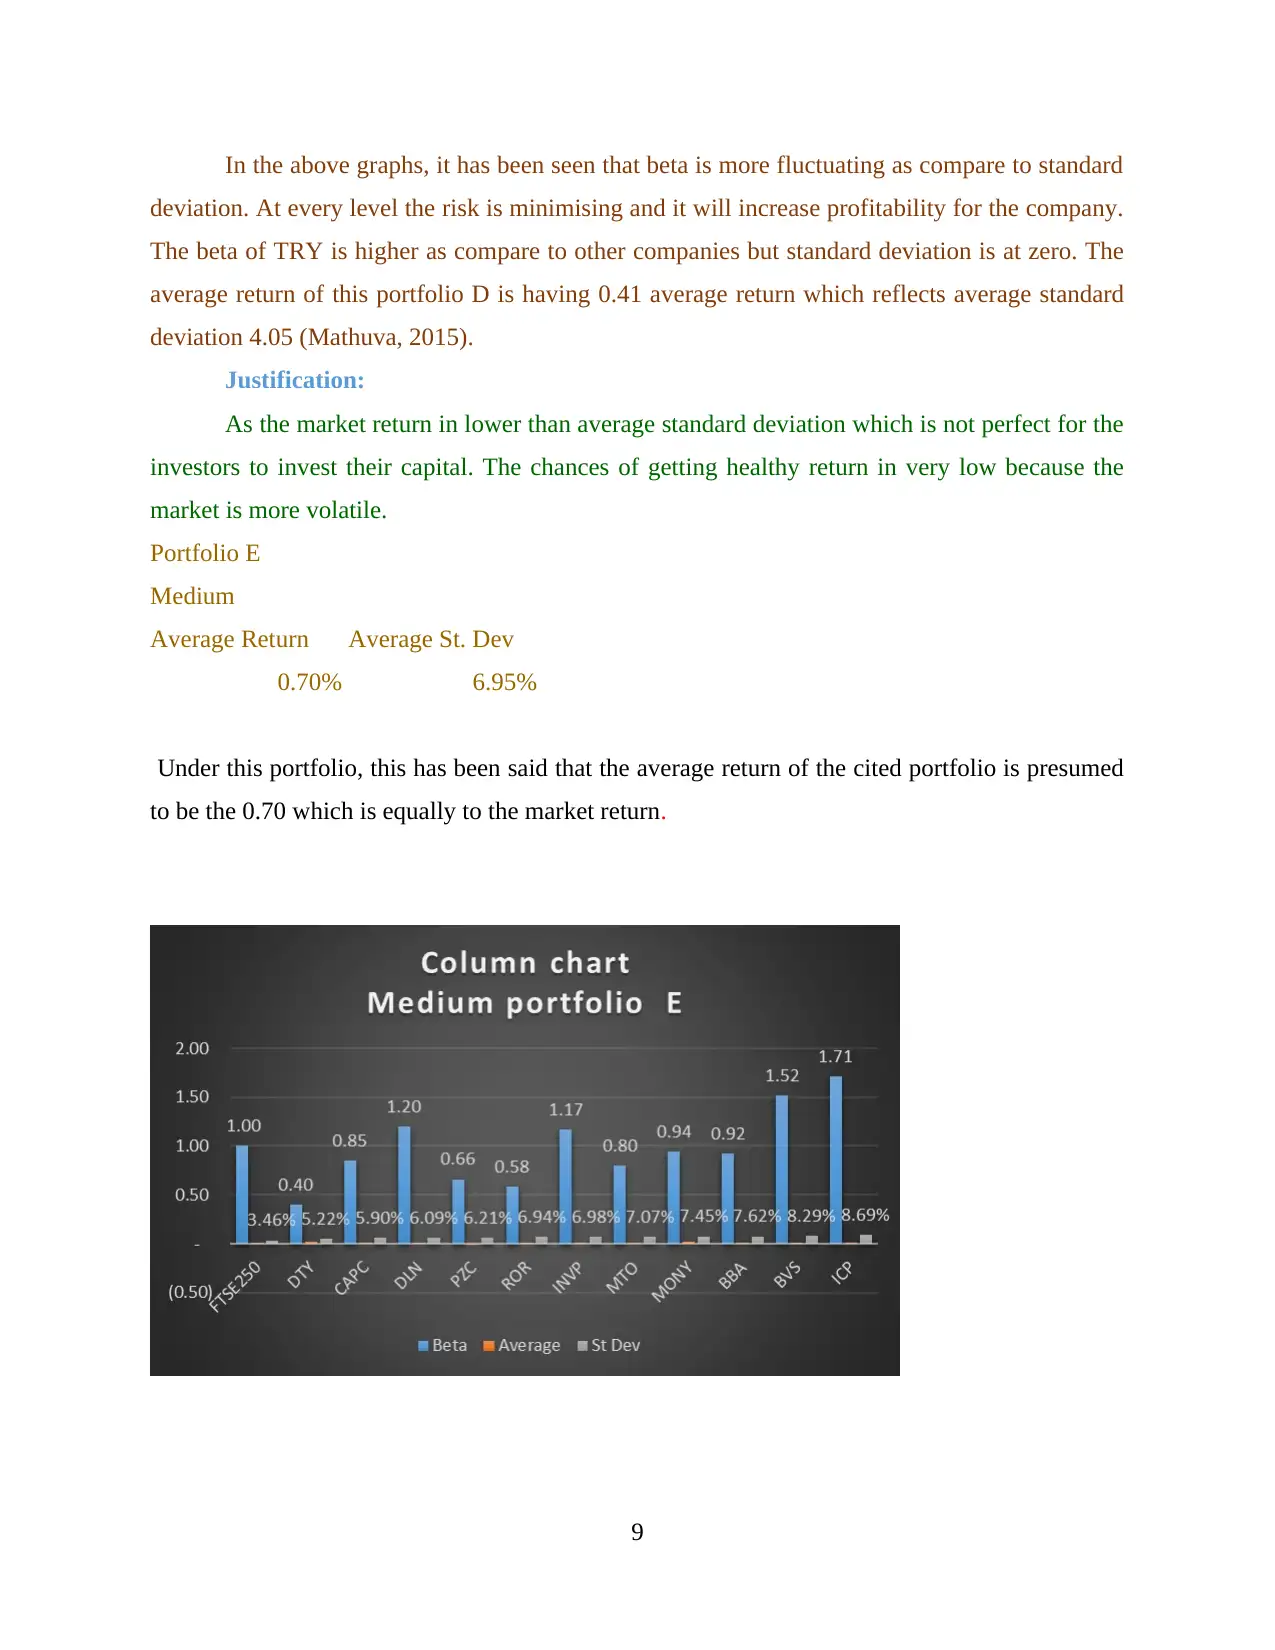
Portfolio E
Medium
Average Return Average St. Dev
0.70% 6.95%
Under this portfolio, this has been said that the average return of the cited portfolio is presumed
to be the 0.70 which is equally to the market return.
9
deviation. At every level the risk is minimising and it will increase profitability for the company.
The beta of TRY is higher as compare to other companies but standard deviation is at zero. The
average return of this portfolio D is having 0.41 average return which reflects average standard
deviation 4.05 (Mathuva, 2015).
Justification:
As the market return in lower than average standard deviation which is not perfect for the
investors to invest their capital. The chances of getting healthy return in very low because the
market is more volatile.
Portfolio E
Medium
Average Return Average St. Dev
0.70% 6.95%
Under this portfolio, this has been said that the average return of the cited portfolio is presumed
to be the 0.70 which is equally to the market return.
9
According to the above graph, it has been clearly seen that there is a huge deviation in the
beta risk with that made impact on the standard deviation of the company. The average return of
this portfolio is having average return of 0.70% and average standard deviation is about 6.95%.
Justification:
By observing the market return and average return is neutral so the investors have the
choice to either make investment or not. The growth and return earning chances can be equal at
each level of investment.
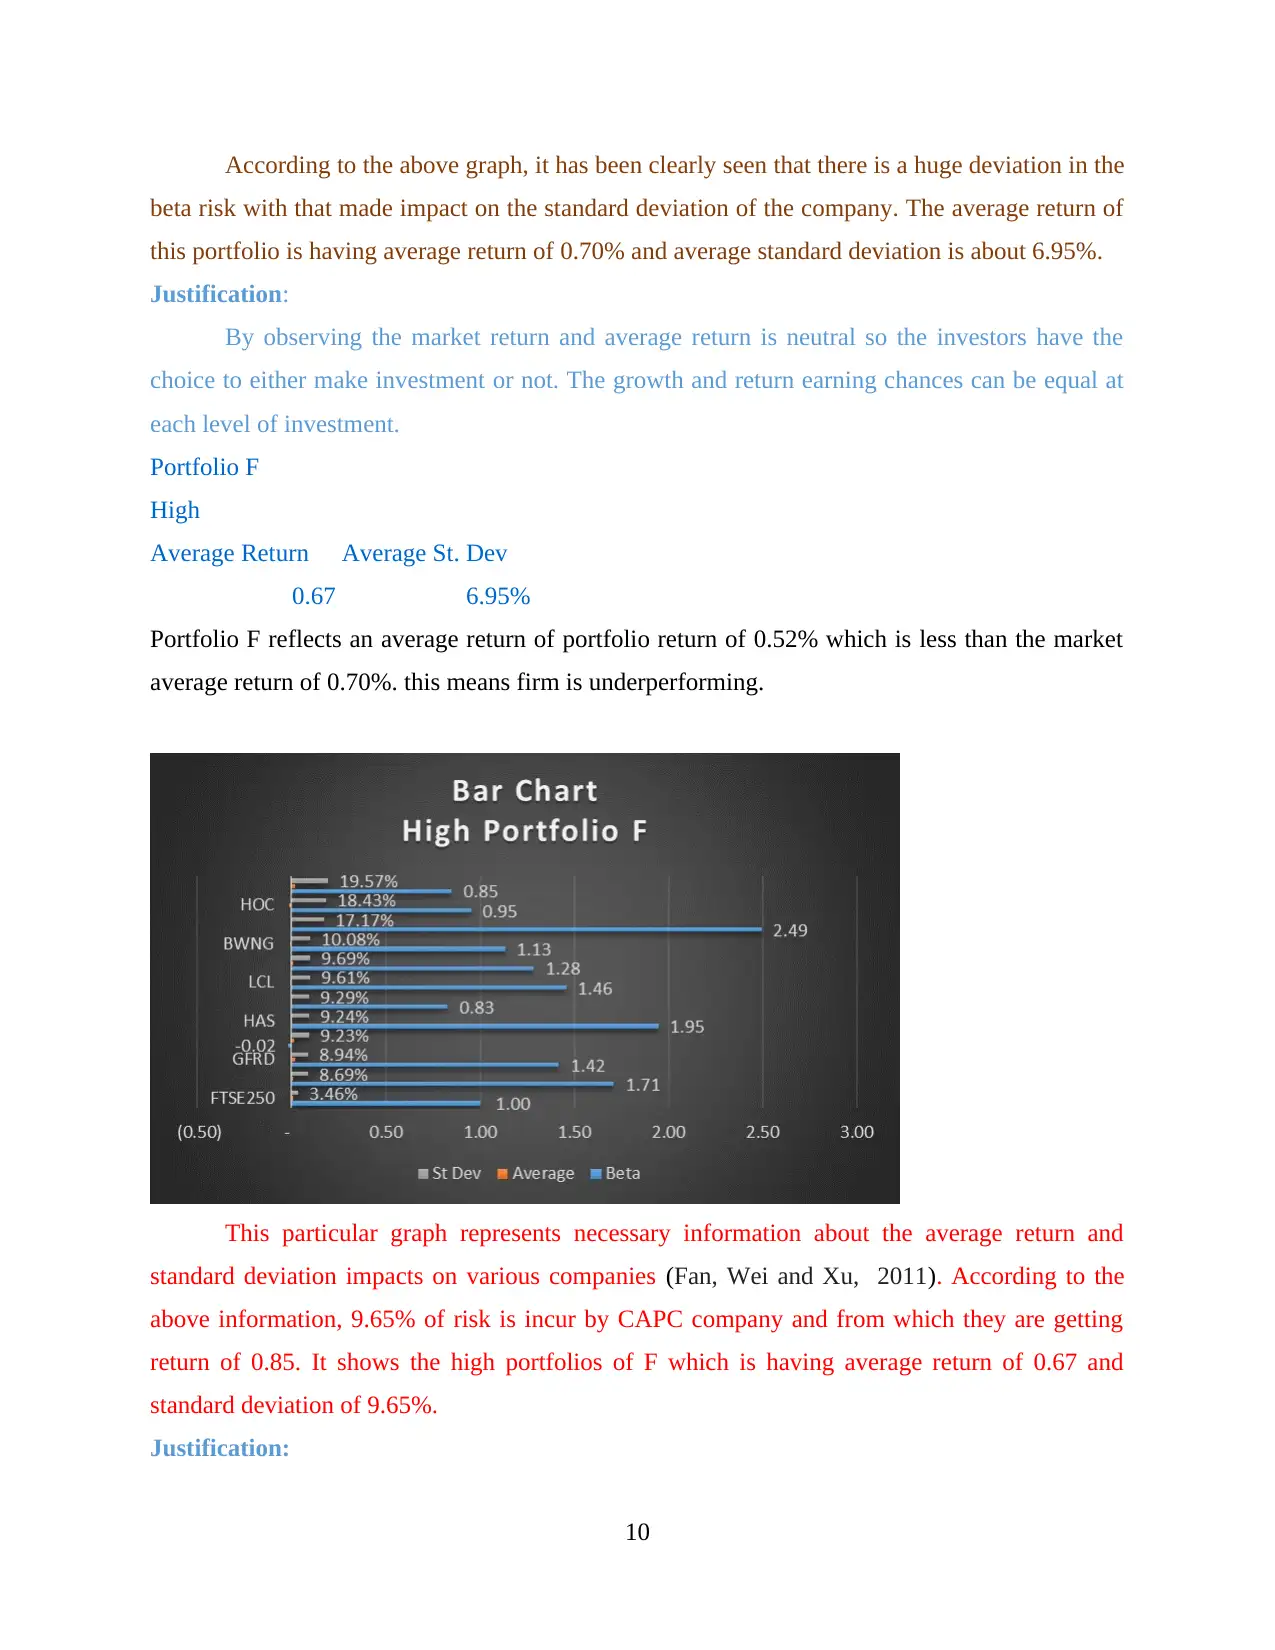
Portfolio F
High
Average Return Average St. Dev
0.67 6.95%
Portfolio F reflects an average return of portfolio return of 0.52% which is less than the market
average return of 0.70%. this means firm is underperforming.
This particular graph represents necessary information about the average return and
standard deviation impacts on various companies (Fan, Wei and Xu, 2011). According to the
above information, 9.65% of risk is incur by CAPC company and from which they are getting
return of 0.85. It shows the high portfolios of F which is having average return of 0.67 and
standard deviation of 9.65%.
Justification:
10
beta risk with that made impact on the standard deviation of the company. The average return of
this portfolio is having average return of 0.70% and average standard deviation is about 6.95%.
Justification:
By observing the market return and average return is neutral so the investors have the
choice to either make investment or not. The growth and return earning chances can be equal at
each level of investment.
Portfolio F
High
Average Return Average St. Dev
0.67 6.95%
Portfolio F reflects an average return of portfolio return of 0.52% which is less than the market
average return of 0.70%. this means firm is underperforming.
This particular graph represents necessary information about the average return and
standard deviation impacts on various companies (Fan, Wei and Xu, 2011). According to the
above information, 9.65% of risk is incur by CAPC company and from which they are getting
return of 0.85. It shows the high portfolios of F which is having average return of 0.67 and
standard deviation of 9.65%.
Justification:
10
⊘ This is a preview!⊘
Do you want full access?
Subscribe today to unlock all pages.
Trusted by 1+ million students worldwide
1 out of 18
Related Documents


Your All-in-One AI-Powered Toolkit for Academic Success.
+13062052269
info@desklib.com
Available 24*7 on WhatsApp / Email
![[object Object]](/_next/static/media/star-bottom.7253800d.svg)
Unlock your academic potential
Copyright © 2020–2026 A2Z Services. All Rights Reserved. Developed and managed by ZUCOL.