Analyzing the Financial Health of Empire Resources Ltd.
VerifiedAdded on 2020/05/16
|19
|2250
|104
AI Summary
Empire Resources Ltd. has faced significant financial challenges as reflected in its net losses over recent years. The analysis delves into critical financial metrics including Return on Assets (ROA) and Return on Equity (ROE), both indicating negative returns, signifying potential issues in asset management and equity value generation. Despite a relatively high debt portion with an average cost of capital at 2.41%, the WACC is notably impacted by the substantial negative cost of equity (-45.40%), leading to an overall negative WACC of -0.38506. The company's financial structure shows significant liabilities, with total assets valued at $5 million against a high debt level of $319 million. This assessment provides insights into Empire Resources Ltd.'s financial health and potential areas for strategic improvement.
RUNNING HEAD: Financial analysis of Empire Resources Ltd 1
Name of the student
Topic- Financial analysis of Empire Resources Ltd
University name
Name of the student
Topic- Financial analysis of Empire Resources Ltd
University name
Paraphrase This Document
Need a fresh take? Get an instant paraphrase of this document with our AI Paraphraser
Financial analysis of Empire Resources Ltd 2
Table of Contents
Introduction................................................................................................................................2
1. Ownership and governance structure..................................................................................2
2. Performance ratio analysis of Myer Holding Limited........................................................3
3. Movements in the share prices............................................................................................6
4.1 Graph of share price movement of Empire Resources Ltd..............................................6
4.2 Comparison of share price movement of Empire Resources Ltd with the all ordinary
index.......................................................................................................................................7
4. Announcements..................................................................................................................7
5. Research via internet...........................................................................................................8
6.1 The value of beta is calculated from the data fetch from Yahoo finance i.e. .15.............8
6.2 Computation of required rate of return by using CAPM method.....................................8
6.3 Determination of conservative investment.......................................................................9
6. Weighted Average Cost of Capital (WACC)...................................................................10
6.1 Cost of equity (calculated above using CAPM.........................................................10
7.2 Implications that a higher WACC on investment decision............................................10
7. Consideration of debt ratio for the company....................................................................10
8.1 Appear to stable..................................................................................................................10
8.2 Gearing ratio discussion.................................................................................................11
8. Divided policies of company............................................................................................11
9. Letter of recommendation.................................................................................................11
10. Conclusion.....................................................................................................................13
11. References.....................................................................................................................14
12. Appendix.......................................................................................................................15
Financial analysis of Empire Resources Ltd 3
Introduction
This report is based on the financial analysis of Empire Resources Ltd. There are
several financial tools such as bottom up analysis; ratio analysis and trend analysis have been
taken into consideration.
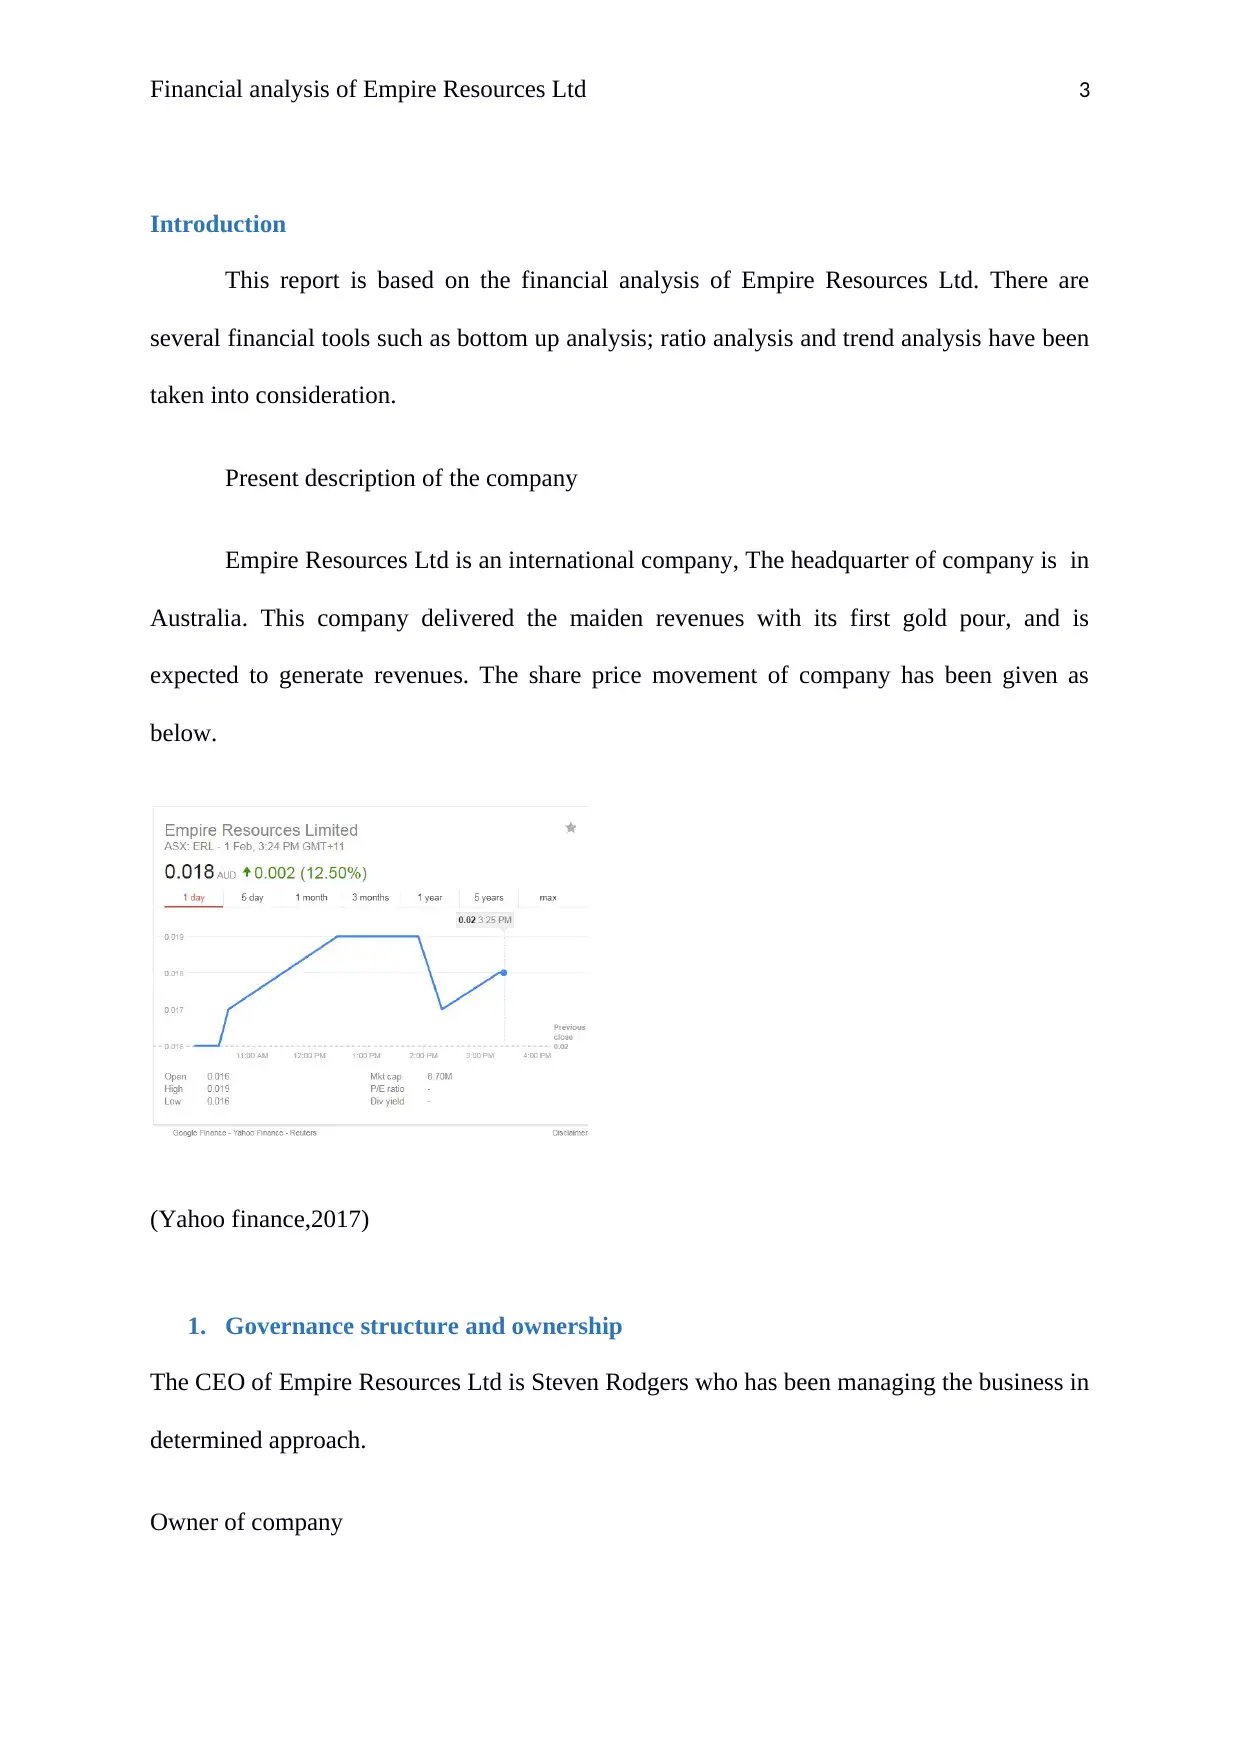
Present description of the company
Empire Resources Ltd is an international company, The headquarter of company is in
Australia. This company delivered the maiden revenues with its first gold pour, and is
expected to generate revenues. The share price movement of company has been given as
below.
(Yahoo finance,2017)
1. Governance structure and ownership
The CEO of Empire Resources Ltd is Steven Rodgers who has been managing the business in
determined approach.
Owner of company
Introduction
This report is based on the financial analysis of Empire Resources Ltd. There are
several financial tools such as bottom up analysis; ratio analysis and trend analysis have been
taken into consideration.
Present description of the company
Empire Resources Ltd is an international company, The headquarter of company is in
Australia. This company delivered the maiden revenues with its first gold pour, and is
expected to generate revenues. The share price movement of company has been given as
below.
(Yahoo finance,2017)
1. Governance structure and ownership
The CEO of Empire Resources Ltd is Steven Rodgers who has been managing the business in
determined approach.
Owner of company
⊘ This is a preview!⊘
Do you want full access?
Subscribe today to unlock all pages.
Trusted by 1+ million students worldwide
Financial analysis of Empire Resources Ltd 4
Institutional holders- 0%
Mutual funds-0%
Insiders-0% (Empire Resources Ltd, 2017)
The entire share in Empire Resources Ltd has been hold by the private persons of
company who are also promoter.
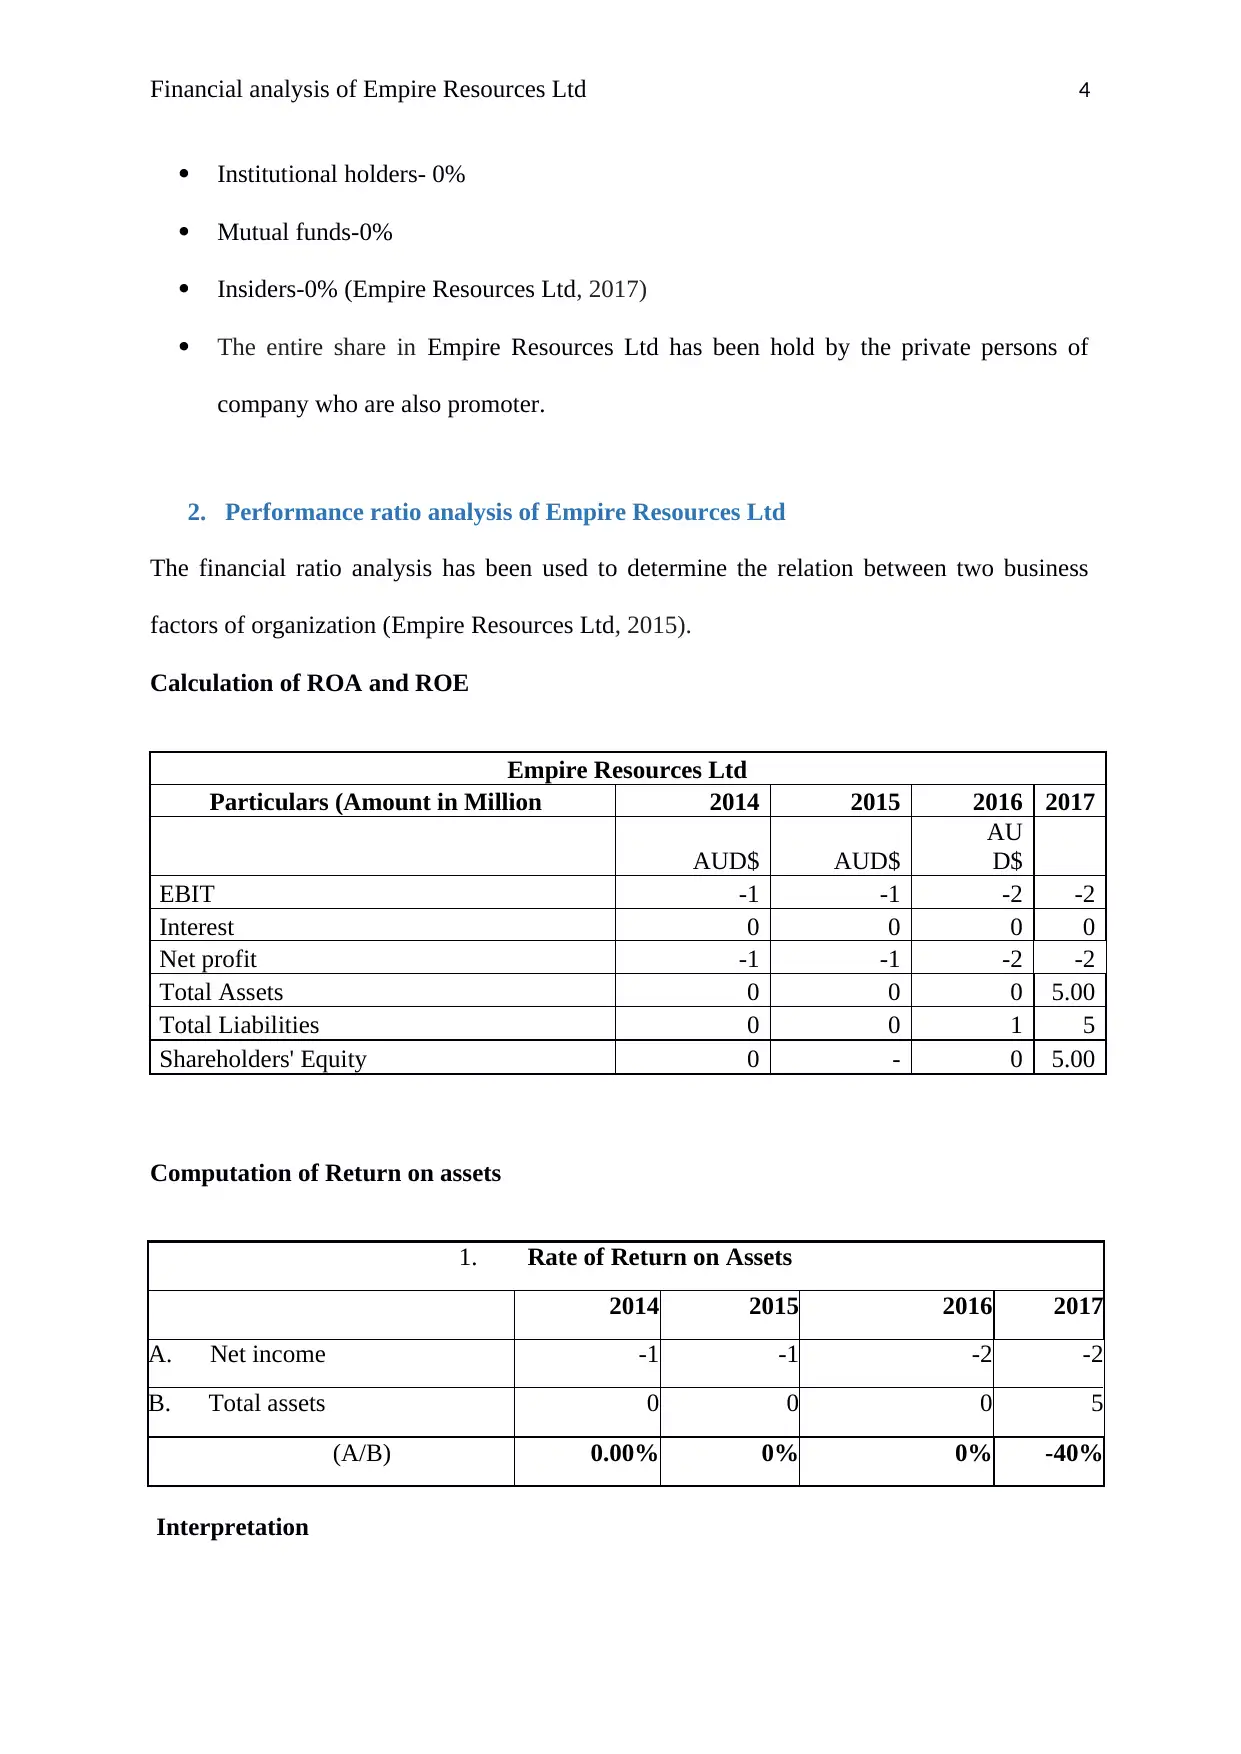
2. Performance ratio analysis of Empire Resources Ltd
The financial ratio analysis has been used to determine the relation between two business
factors of organization (Empire Resources Ltd, 2015).
Calculation of ROA and ROE
Empire Resources Ltd
Particulars (Amount in Million 2014 2015 2016 2017
AUD$ AUD$
AU
D$
EBIT -1 -1 -2 -2
Interest 0 0 0 0
Net profit -1 -1 -2 -2
Total Assets 0 0 0 5.00
Total Liabilities 0 0 1 5
Shareholders' Equity 0 - 0 5.00
Computation of Return on assets
1. Rate of Return on Assets
2014 2015 2016 2017
A. Net income -1 -1 -2 -2
B. Total assets 0 0 0 5
(A/B) 0.00% 0% 0% -40%
Interpretation
Institutional holders- 0%
Mutual funds-0%
Insiders-0% (Empire Resources Ltd, 2017)
The entire share in Empire Resources Ltd has been hold by the private persons of
company who are also promoter.
2. Performance ratio analysis of Empire Resources Ltd
The financial ratio analysis has been used to determine the relation between two business
factors of organization (Empire Resources Ltd, 2015).
Calculation of ROA and ROE
Empire Resources Ltd
Particulars (Amount in Million 2014 2015 2016 2017
AUD$ AUD$
AU
D$
EBIT -1 -1 -2 -2
Interest 0 0 0 0
Net profit -1 -1 -2 -2
Total Assets 0 0 0 5.00
Total Liabilities 0 0 1 5
Shareholders' Equity 0 - 0 5.00
Computation of Return on assets
1. Rate of Return on Assets
2014 2015 2016 2017
A. Net income -1 -1 -2 -2
B. Total assets 0 0 0 5
(A/B) 0.00% 0% 0% -40%
Interpretation
Paraphrase This Document
Need a fresh take? Get an instant paraphrase of this document with our AI Paraphraser
Financial analysis of Empire Resources Ltd 5
It is evaluated that rate of return of company is zero in all the three years as company
had no income and no assets invested in its business. In addition to this, in 2017, it reflected
40% loss in its return on assets which may destruct the value of its assets (Brigham and
Ehrhardt, 2013)
It is evaluated that rate of return of company is zero in all the three years as company
had no income and no assets invested in its business. In addition to this, in 2017, it reflected
40% loss in its return on assets which may destruct the value of its assets (Brigham and
Ehrhardt, 2013)
Financial analysis of Empire Resources Ltd 6
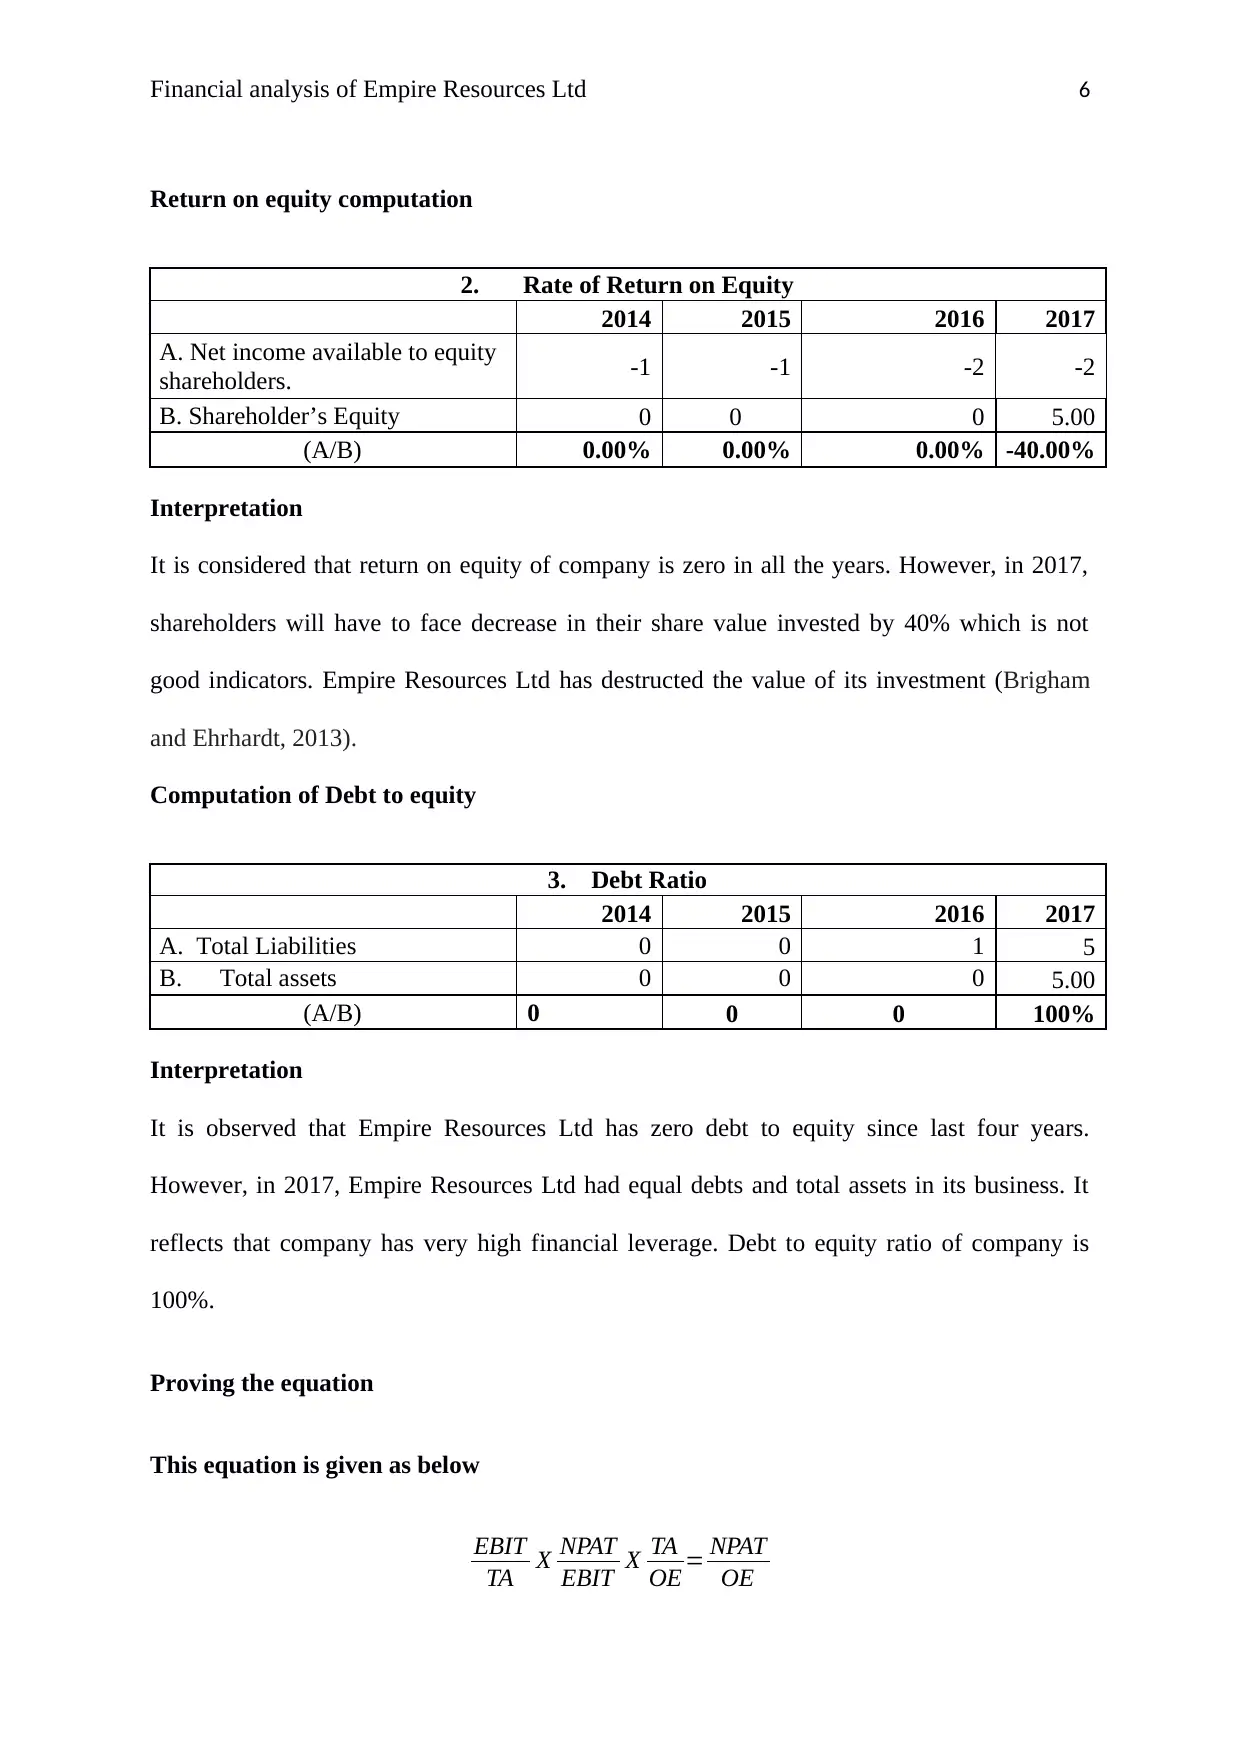
Return on equity computation
2. Rate of Return on Equity
2014 2015 2016 2017
A. Net income available to equity
shareholders. -1 -1 -2 -2
B. Shareholder’s Equity 0 0 0 5.00
(A/B) 0.00% 0.00% 0.00% -40.00%
Interpretation
It is considered that return on equity of company is zero in all the years. However, in 2017,
shareholders will have to face decrease in their share value invested by 40% which is not
good indicators. Empire Resources Ltd has destructed the value of its investment (Brigham
and Ehrhardt, 2013).
Computation of Debt to equity
3. Debt Ratio
2014 2015 2016 2017
A. Total Liabilities 0 0 1 5
B. Total assets 0 0 0 5.00
(A/B) 0 0 0 100%
Interpretation
It is observed that Empire Resources Ltd has zero debt to equity since last four years.
However, in 2017, Empire Resources Ltd had equal debts and total assets in its business. It
reflects that company has very high financial leverage. Debt to equity ratio of company is
100%.
Proving the equation
This equation is given as below
EBIT
TA X NPAT
EBIT X TA
OE = NPAT
OE
⊘ This is a preview!⊘
Do you want full access?
Subscribe today to unlock all pages.
Trusted by 1+ million students worldwide
Financial analysis of Empire Resources Ltd 7
Providing equation
2
014 2015 2016 2017
Net profit After tax/OE 0 0 0 -0.4
EBIT/TA*NPAT/EBIT*TA/OE 0 0 0 -0.4
(Please see the excel sheet for the proper calculation)
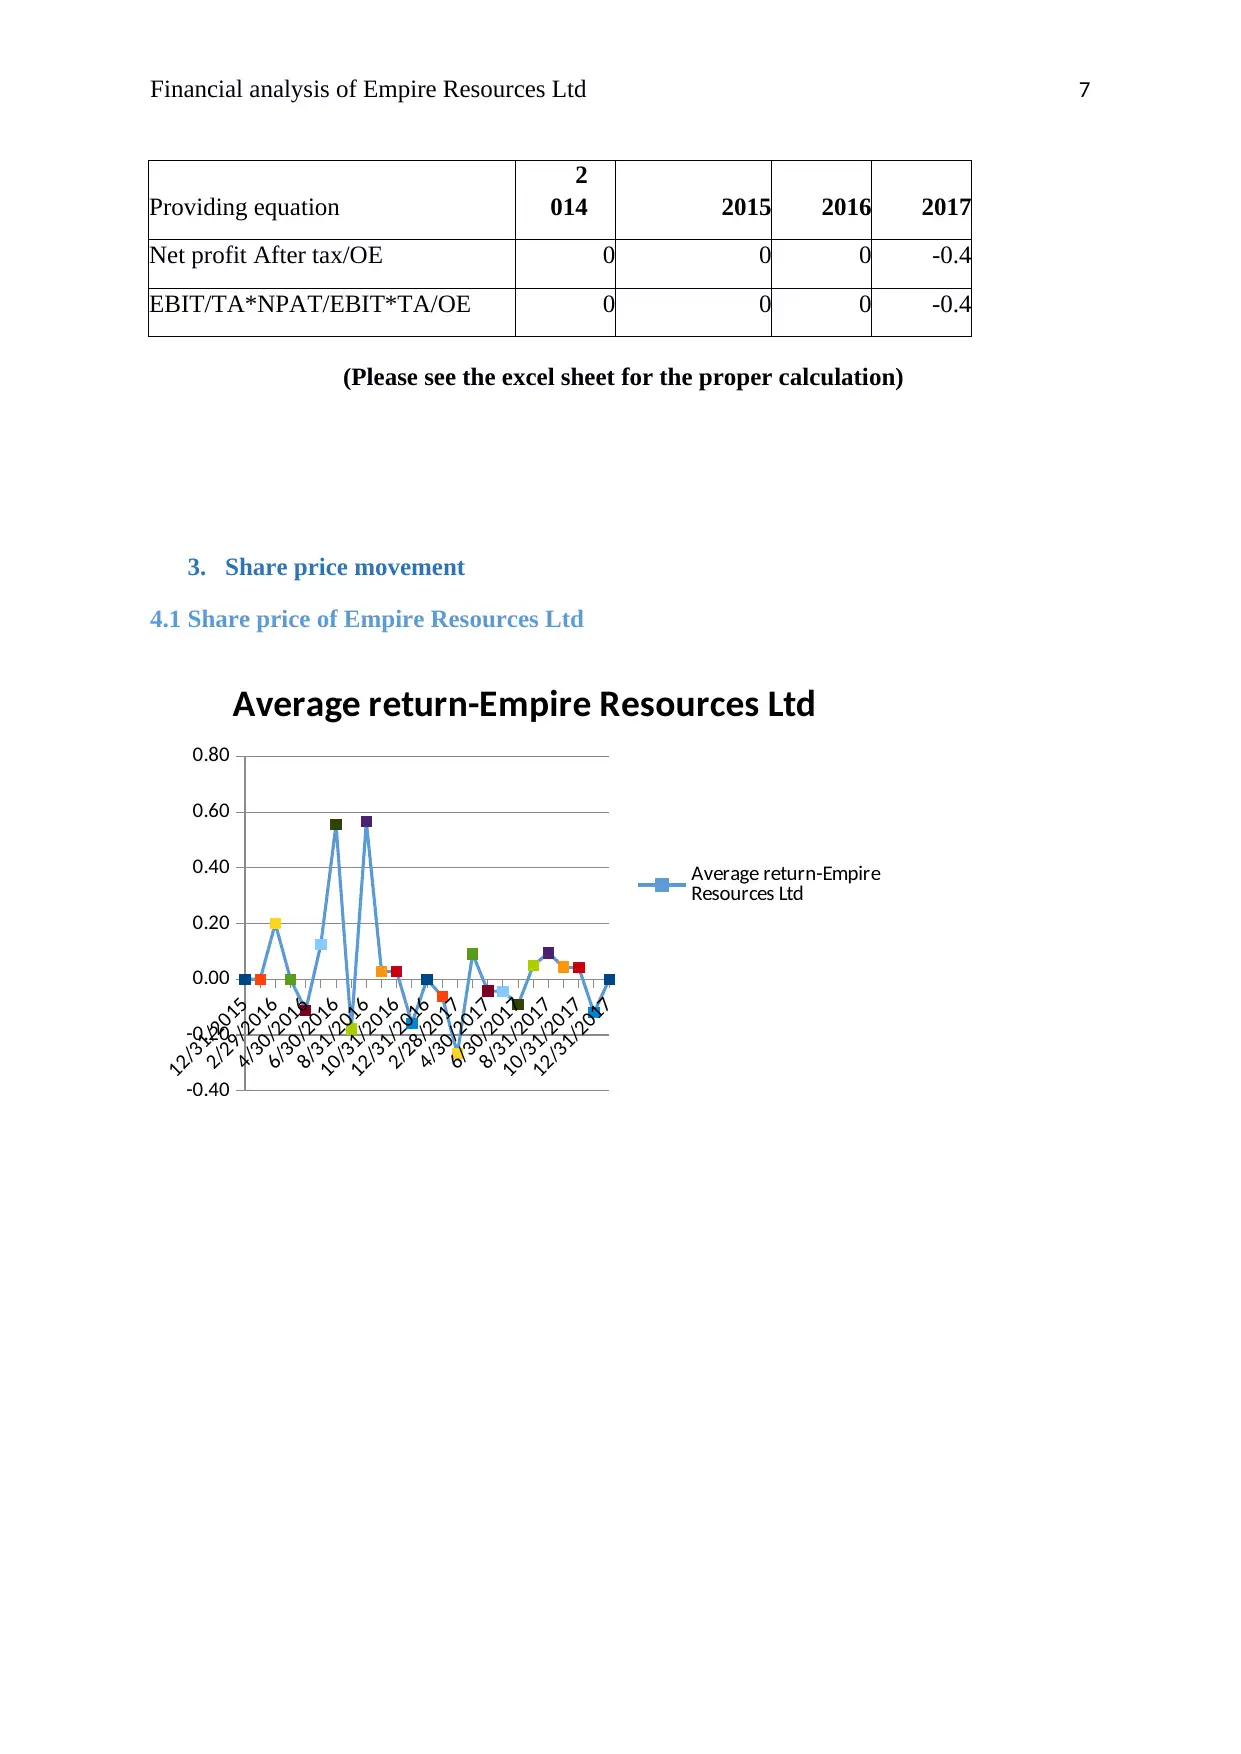
3. Share price movement
4.1 Share price of Empire Resources Ltd
12/31/2015
2/29/2016
4/30/2016
6/30/2016
8/31/2016
10/31/2016
12/31/2016
2/28/2017
4/30/2017
6/30/2017
8/31/2017
10/31/2017
12/31/2017
-0.40
-0.20
0.00
0.20
0.40
0.60
0.80
Average return-Empire Resources Ltd
Average return-Empire
Resources Ltd
Providing equation
2
014 2015 2016 2017
Net profit After tax/OE 0 0 0 -0.4
EBIT/TA*NPAT/EBIT*TA/OE 0 0 0 -0.4
(Please see the excel sheet for the proper calculation)
3. Share price movement
4.1 Share price of Empire Resources Ltd
12/31/2015
2/29/2016
4/30/2016
6/30/2016
8/31/2016
10/31/2016
12/31/2016
2/28/2017
4/30/2017
6/30/2017
8/31/2017
10/31/2017
12/31/2017
-0.40
-0.20
0.00
0.20
0.40
0.60
0.80
Average return-Empire Resources Ltd
Average return-Empire
Resources Ltd
Paraphrase This Document
Need a fresh take? Get an instant paraphrase of this document with our AI Paraphraser
Financial analysis of Empire Resources Ltd 8
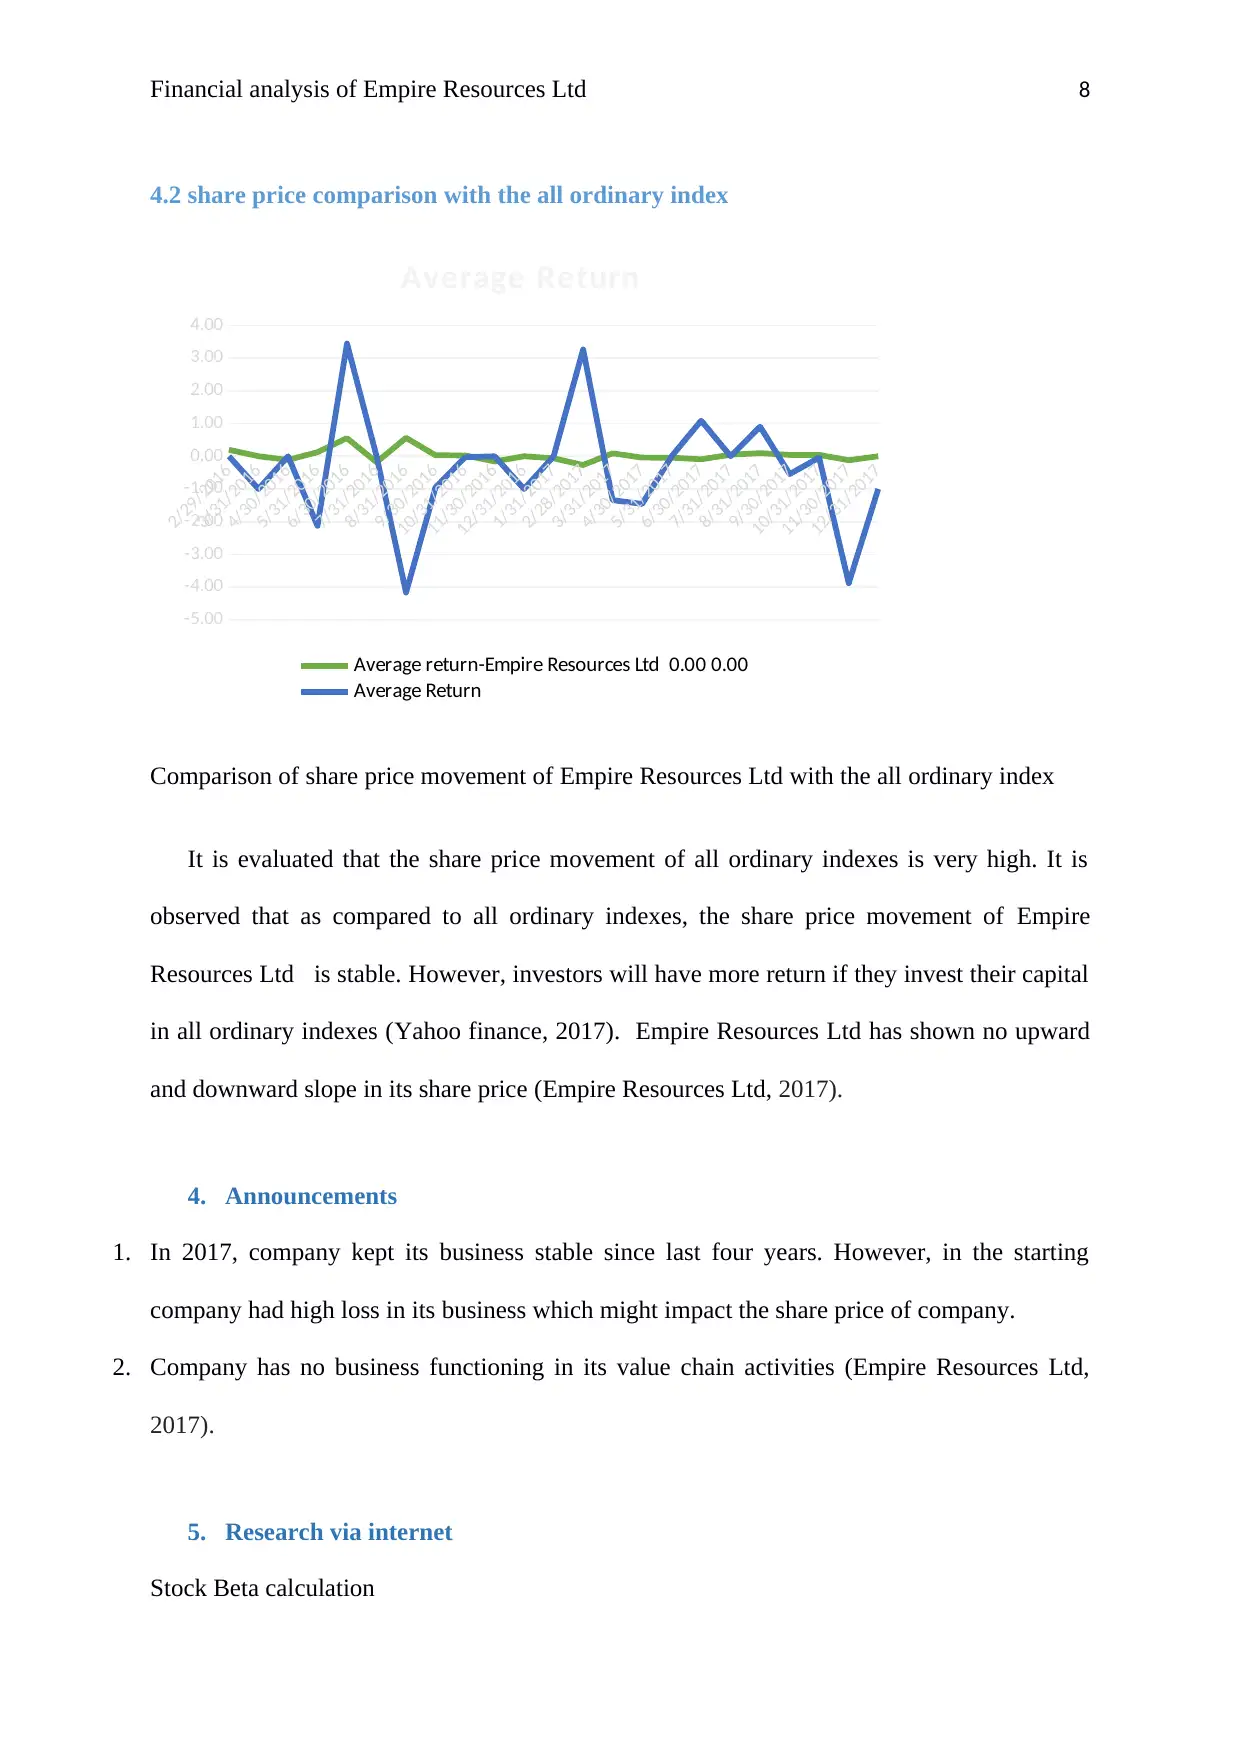
4.2 share price comparison with the all ordinary index
2/29/2016
3/31/2016
4/30/2016
5/31/2016
6/30/2016
7/31/2016
8/31/2016
9/30/2016
10/31/2016
11/30/2016
12/31/2016
1/31/2017
2/28/2017
3/31/2017
4/30/2017
5/31/2017
6/30/2017
7/31/2017
8/31/2017
9/30/2017
10/31/2017
11/30/2017
12/31/2017
-5.00
-4.00
-3.00
-2.00
-1.00
0.00
1.00
2.00
3.00
4.00
Average Return
Average return-Empire Resources Ltd 0.00 0.00
Average Return
Comparison of share price movement of Empire Resources Ltd with the all ordinary index
It is evaluated that the share price movement of all ordinary indexes is very high. It is
observed that as compared to all ordinary indexes, the share price movement of Empire
Resources Ltd is stable. However, investors will have more return if they invest their capital
in all ordinary indexes (Yahoo finance, 2017). Empire Resources Ltd has shown no upward
and downward slope in its share price (Empire Resources Ltd, 2017).
4. Announcements
1. In 2017, company kept its business stable since last four years. However, in the starting
company had high loss in its business which might impact the share price of company.
2. Company has no business functioning in its value chain activities (Empire Resources Ltd,
2017).
5. Research via internet
Stock Beta calculation
Financial analysis of Empire Resources Ltd 9
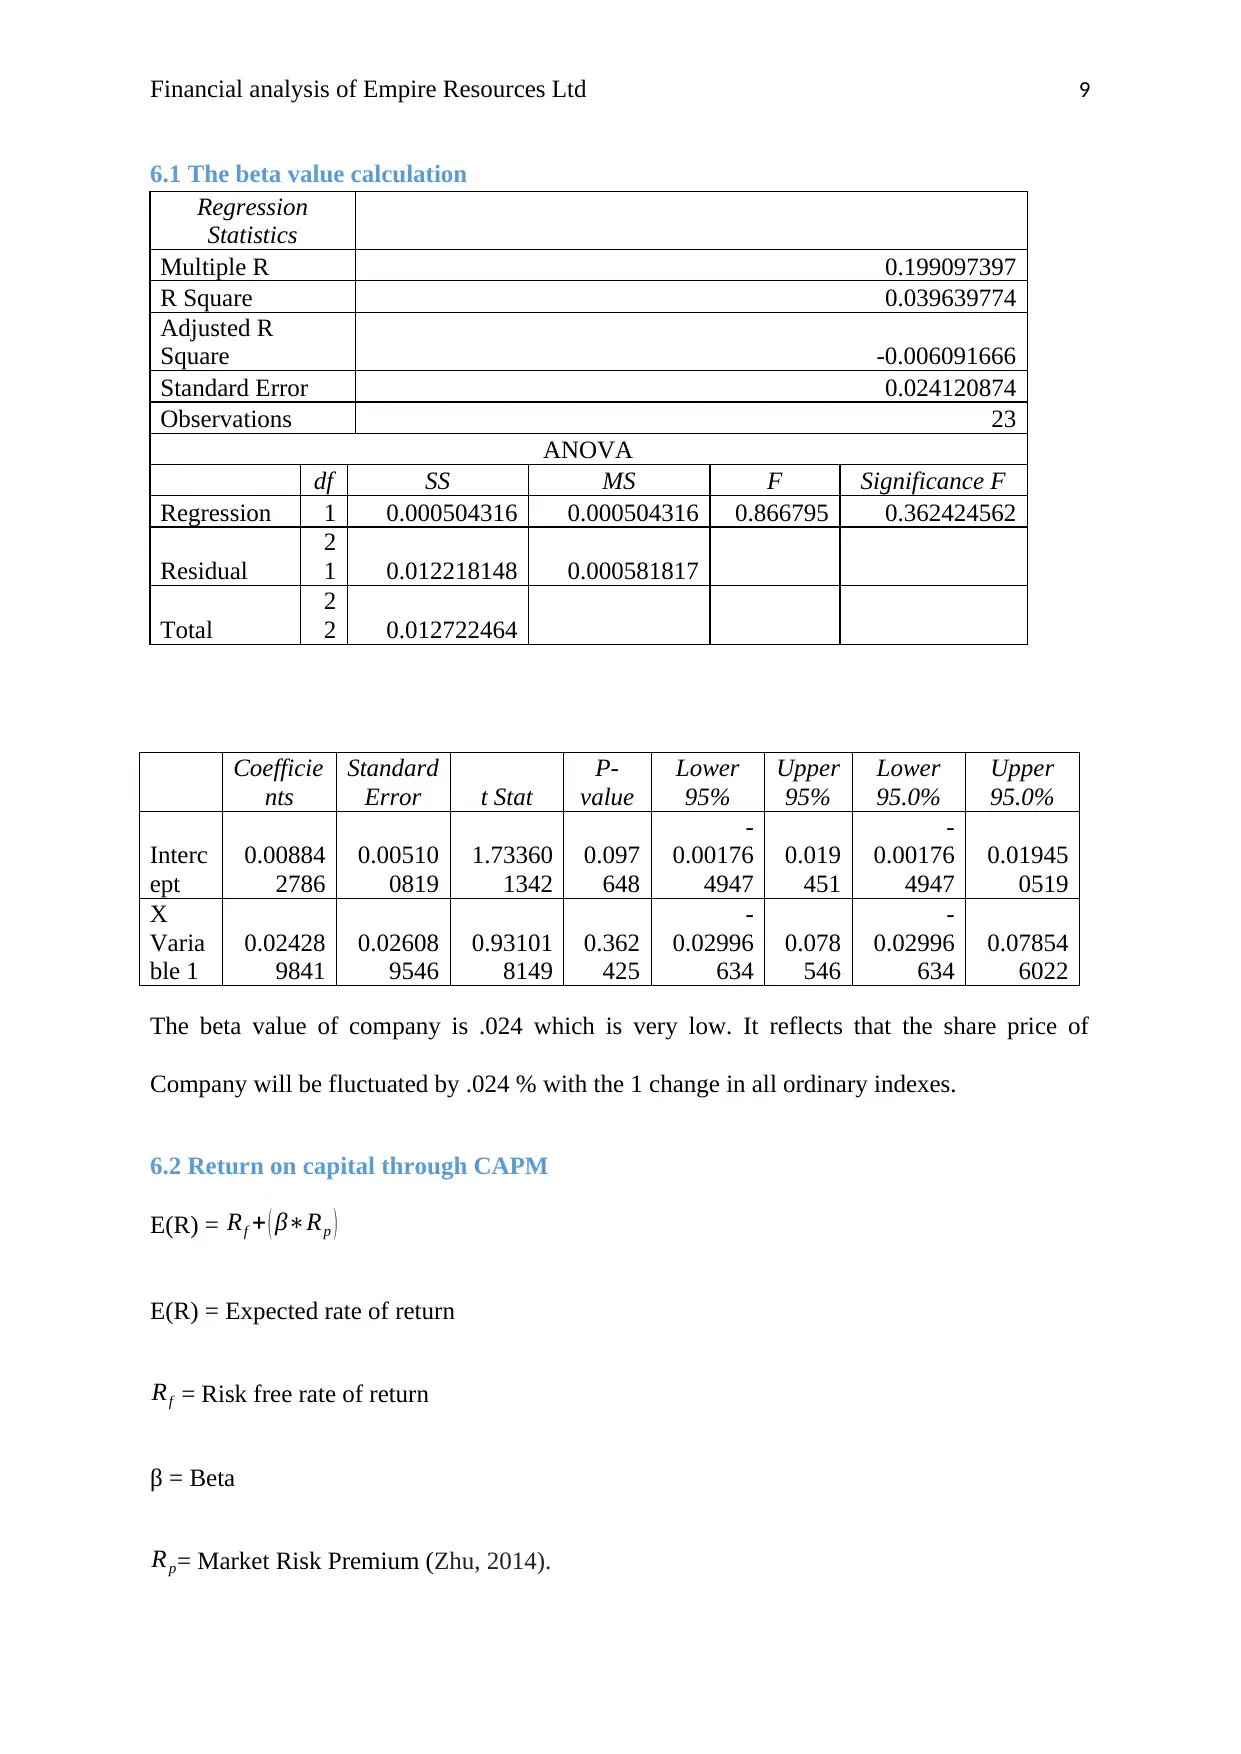
6.1 The beta value calculation
Regression
Statistics
Multiple R 0.199097397
R Square 0.039639774
Adjusted R
Square -0.006091666
Standard Error 0.024120874
Observations 23
ANOVA
df SS MS F Significance F
Regression 1 0.000504316 0.000504316 0.866795 0.362424562
Residual
2
1 0.012218148 0.000581817
Total
2
2 0.012722464
Coefficie
nts
Standard
Error t Stat
P-
value
Lower
95%
Upper
95%
Lower
95.0%
Upper
95.0%
Interc
ept
0.00884
2786
0.00510
0819
1.73360
1342
0.097
648
-
0.00176
4947
0.019
451
-
0.00176
4947
0.01945
0519
X
Varia
ble 1
0.02428
9841
0.02608
9546
0.93101
8149
0.362
425
-
0.02996
634
0.078
546
-
0.02996
634
0.07854
6022
The beta value of company is .024 which is very low. It reflects that the share price of
Company will be fluctuated by .024 % with the 1 change in all ordinary indexes.
6.2 Return on capital through CAPM
E(R) = Rf + ( β∗Rp )
E(R) = Expected rate of return
Rf = Risk free rate of return
β = Beta
Rp= Market Risk Premium (Zhu, 2014).
⊘ This is a preview!⊘
Do you want full access?
Subscribe today to unlock all pages.
Trusted by 1+ million students worldwide
Financial analysis of Empire Resources Ltd 10
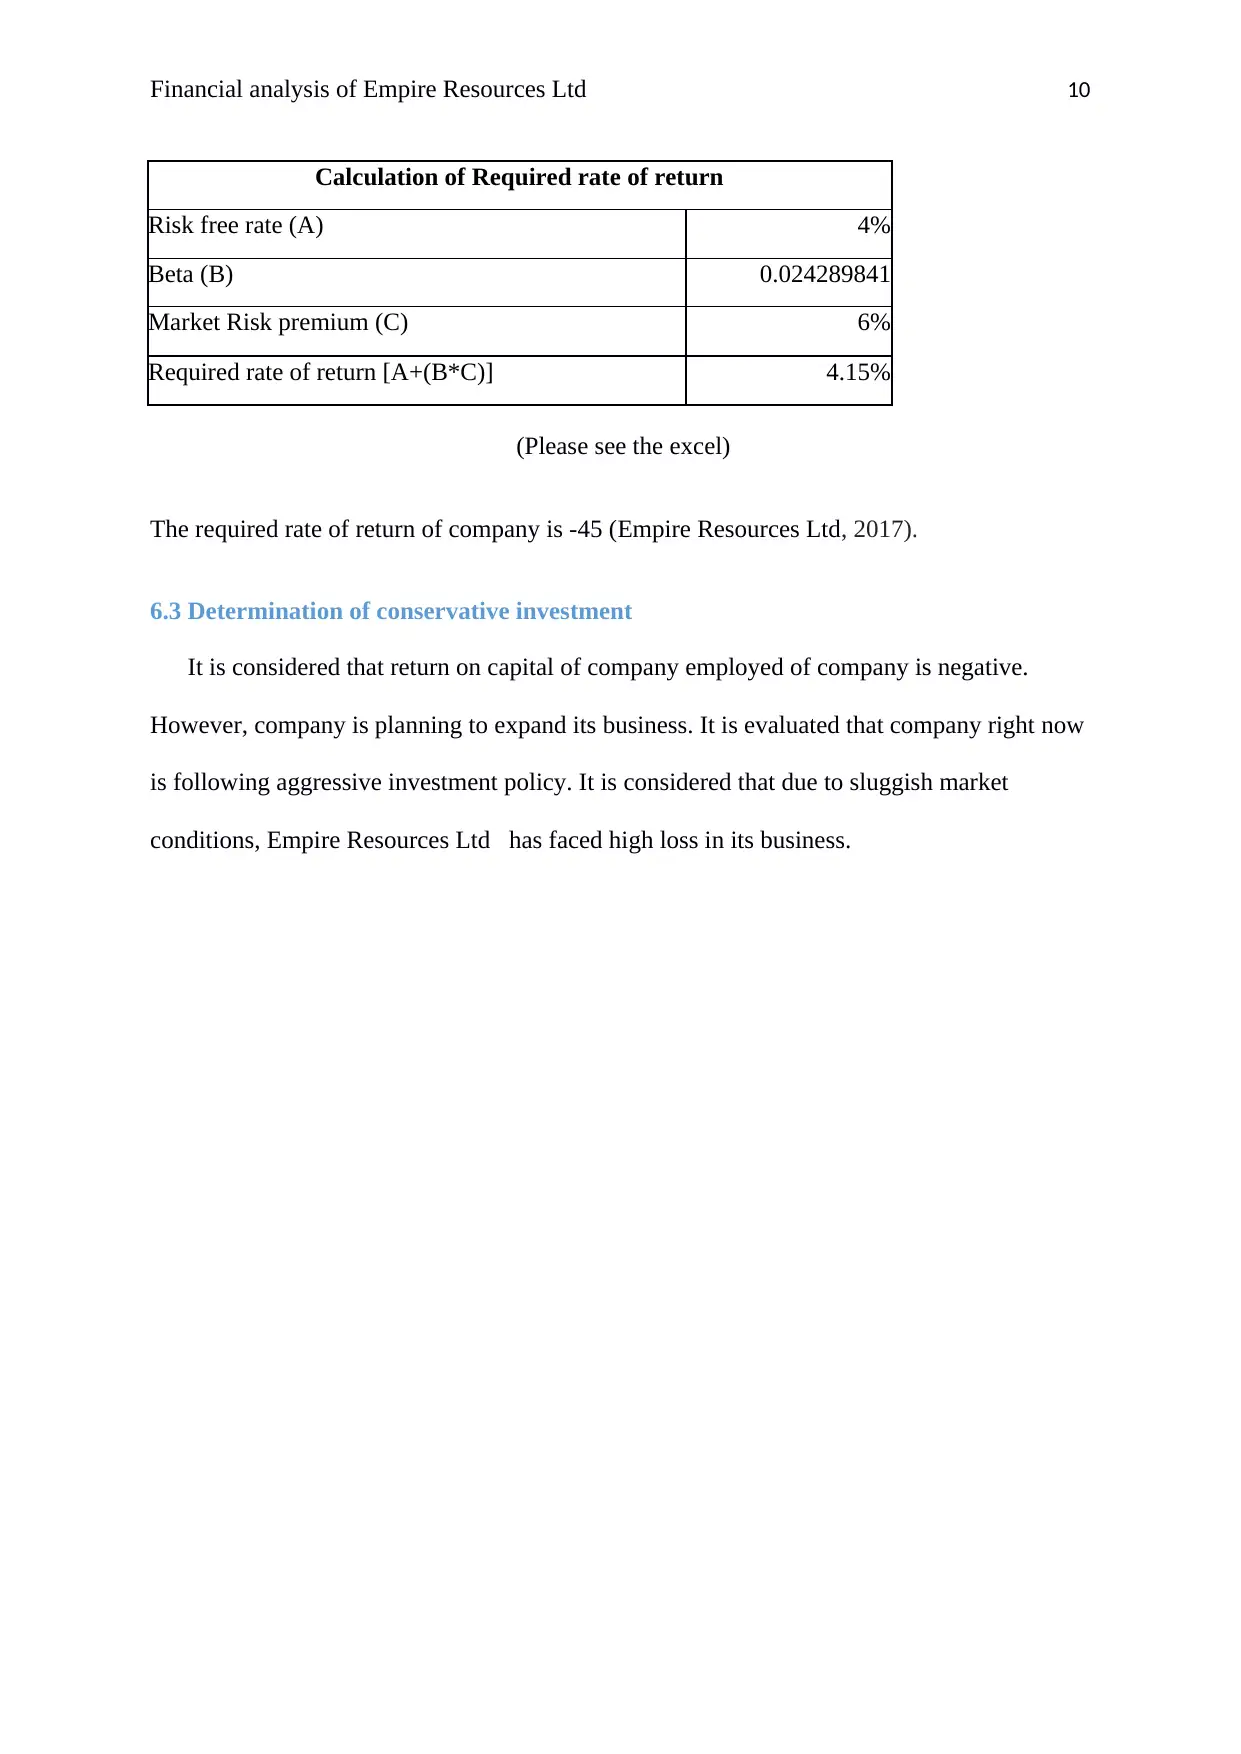
Calculation of Required rate of return
Risk free rate (A) 4%
Beta (B) 0.024289841
Market Risk premium (C) 6%
Required rate of return [A+(B*C)] 4.15%
(Please see the excel)
The required rate of return of company is -45 (Empire Resources Ltd, 2017).
6.3 Determination of conservative investment
It is considered that return on capital of company employed of company is negative.
However, company is planning to expand its business. It is evaluated that company right now
is following aggressive investment policy. It is considered that due to sluggish market
conditions, Empire Resources Ltd has faced high loss in its business.
Paraphrase This Document
Need a fresh take? Get an instant paraphrase of this document with our AI Paraphraser
Financial analysis of Empire Resources Ltd 11
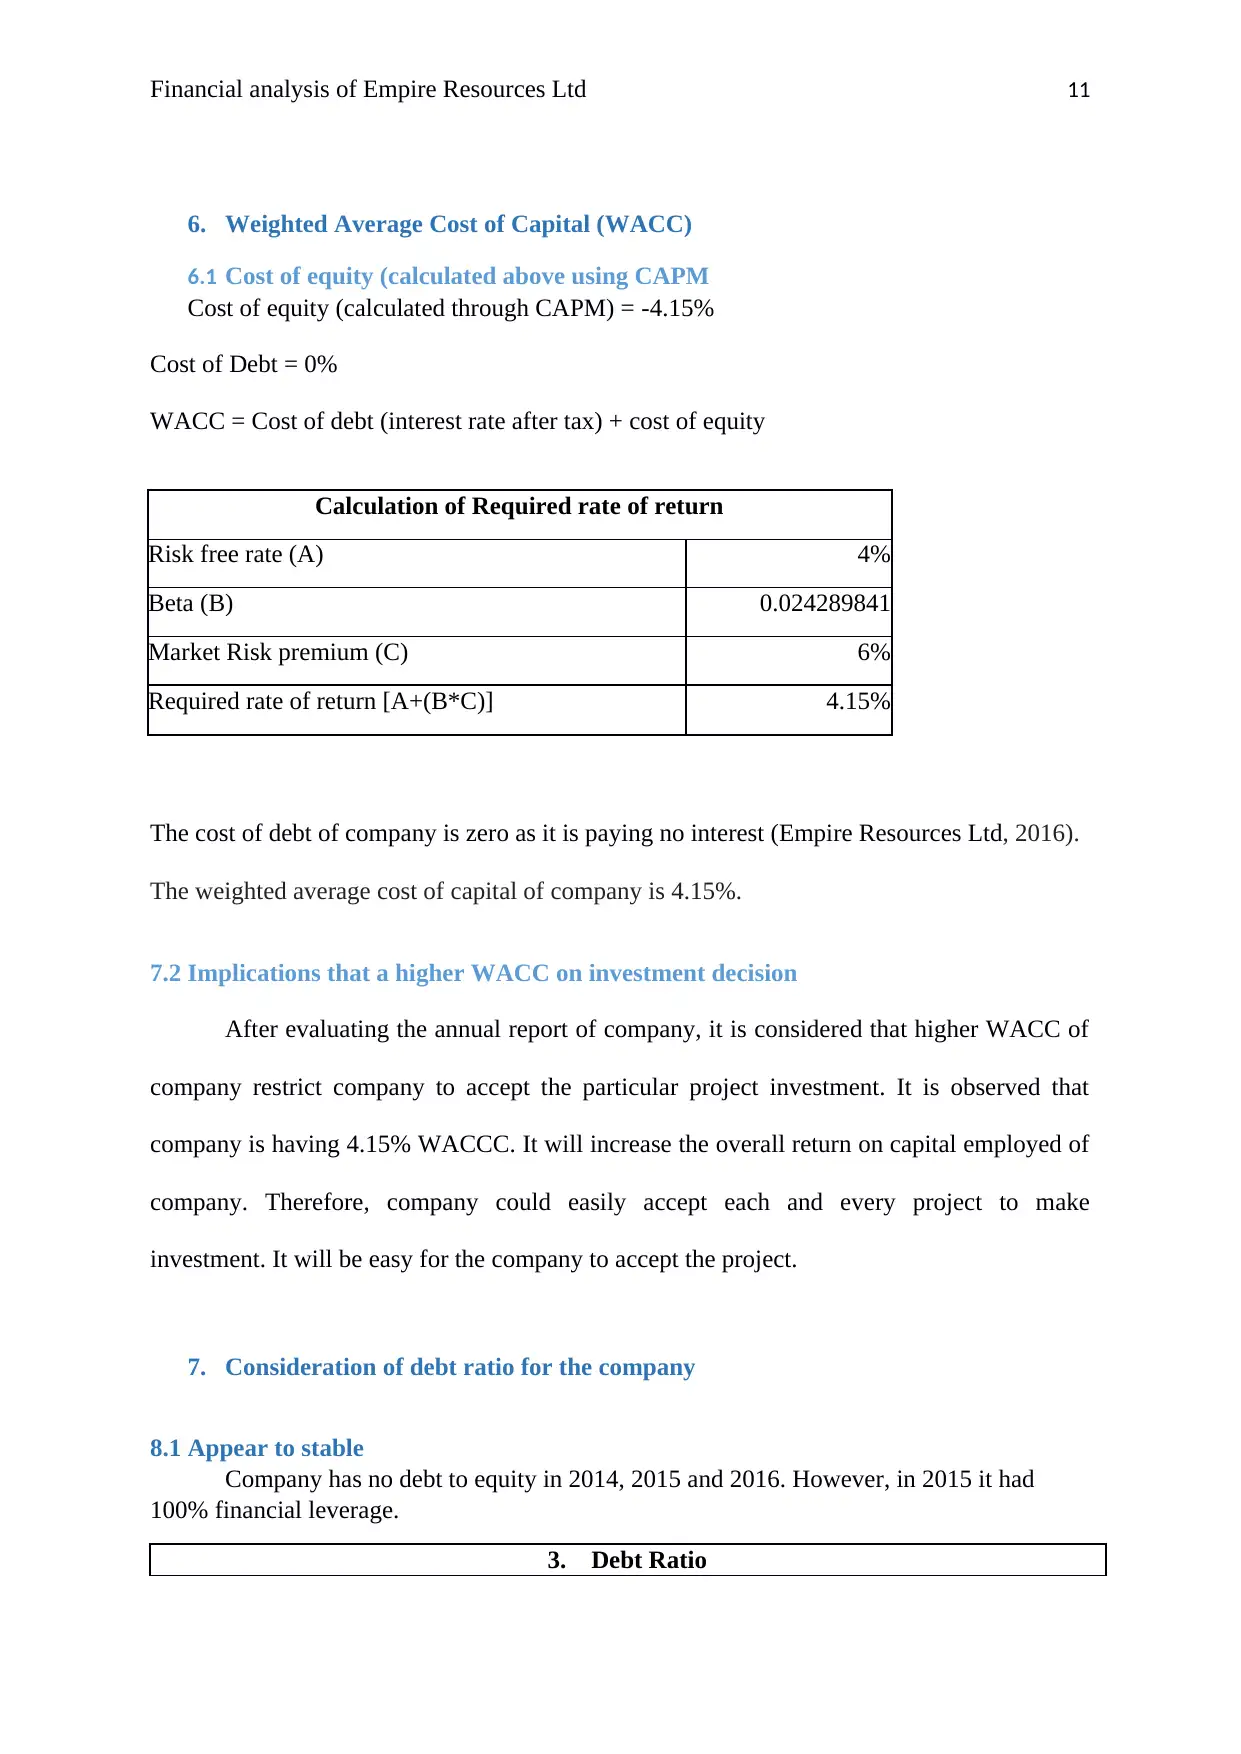
6. Weighted Average Cost of Capital (WACC)
6.1 Cost of equity (calculated above using CAPM
Cost of equity (calculated through CAPM) = -4.15%
Cost of Debt = 0%
WACC = Cost of debt (interest rate after tax) + cost of equity
Calculation of Required rate of return
Risk free rate (A) 4%
Beta (B) 0.024289841
Market Risk premium (C) 6%
Required rate of return [A+(B*C)] 4.15%
The cost of debt of company is zero as it is paying no interest (Empire Resources Ltd, 2016).
The weighted average cost of capital of company is 4.15%.
7.2 Implications that a higher WACC on investment decision
After evaluating the annual report of company, it is considered that higher WACC of
company restrict company to accept the particular project investment. It is observed that
company is having 4.15% WACCC. It will increase the overall return on capital employed of
company. Therefore, company could easily accept each and every project to make
investment. It will be easy for the company to accept the project.
7. Consideration of debt ratio for the company
8.1 Appear to stable
Company has no debt to equity in 2014, 2015 and 2016. However, in 2015 it had
100% financial leverage.
3. Debt Ratio
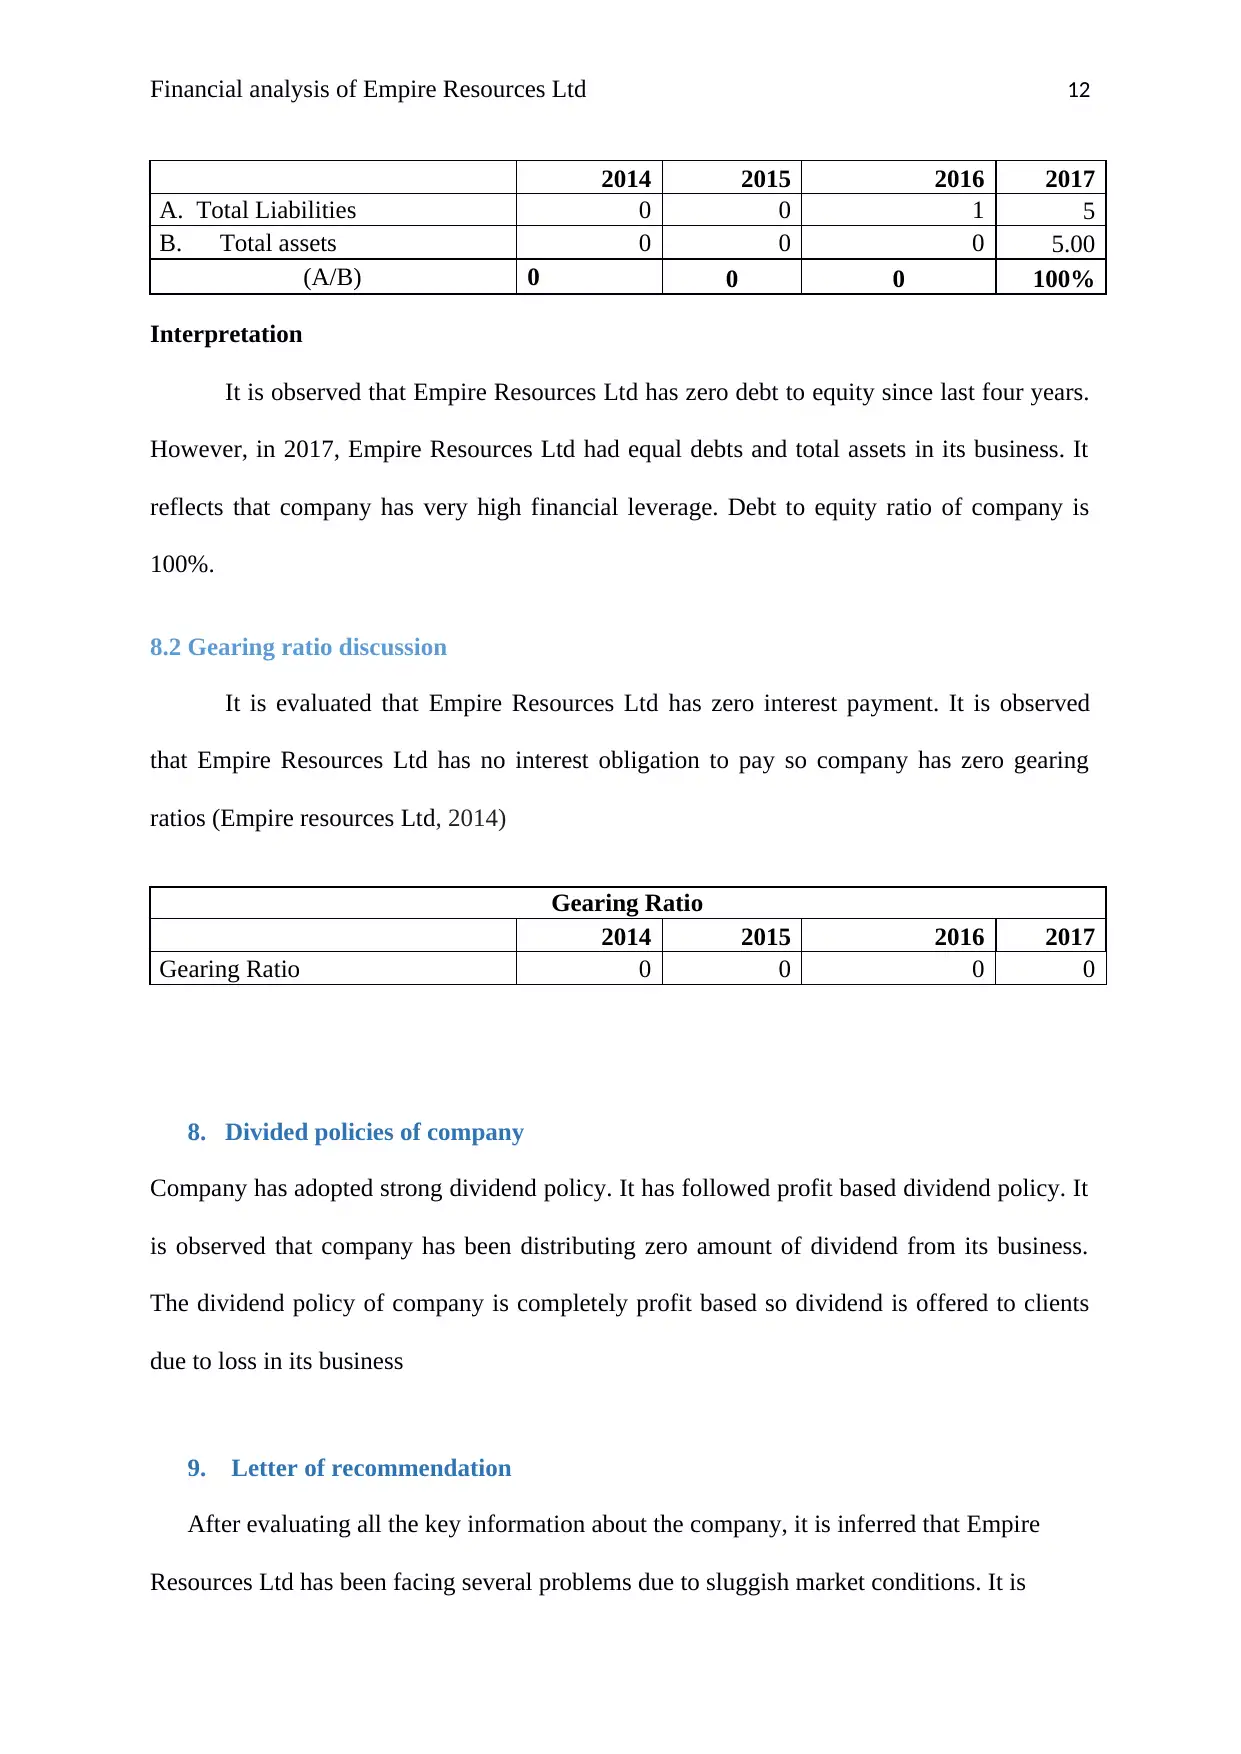
Financial analysis of Empire Resources Ltd 12
2014 2015 2016 2017
A. Total Liabilities 0 0 1 5
B. Total assets 0 0 0 5.00
(A/B) 0 0 0 100%
Interpretation
It is observed that Empire Resources Ltd has zero debt to equity since last four years.
However, in 2017, Empire Resources Ltd had equal debts and total assets in its business. It
reflects that company has very high financial leverage. Debt to equity ratio of company is
100%.
8.2 Gearing ratio discussion
It is evaluated that Empire Resources Ltd has zero interest payment. It is observed
that Empire Resources Ltd has no interest obligation to pay so company has zero gearing
ratios (Empire resources Ltd, 2014)
Gearing Ratio
2014 2015 2016 2017
Gearing Ratio 0 0 0 0
8. Divided policies of company
Company has adopted strong dividend policy. It has followed profit based dividend policy. It
is observed that company has been distributing zero amount of dividend from its business.
The dividend policy of company is completely profit based so dividend is offered to clients
due to loss in its business
9. Letter of recommendation
After evaluating all the key information about the company, it is inferred that Empire
Resources Ltd has been facing several problems due to sluggish market conditions. It is
2014 2015 2016 2017
A. Total Liabilities 0 0 1 5
B. Total assets 0 0 0 5.00
(A/B) 0 0 0 100%
Interpretation
It is observed that Empire Resources Ltd has zero debt to equity since last four years.
However, in 2017, Empire Resources Ltd had equal debts and total assets in its business. It
reflects that company has very high financial leverage. Debt to equity ratio of company is
100%.
8.2 Gearing ratio discussion
It is evaluated that Empire Resources Ltd has zero interest payment. It is observed
that Empire Resources Ltd has no interest obligation to pay so company has zero gearing
ratios (Empire resources Ltd, 2014)
Gearing Ratio
2014 2015 2016 2017
Gearing Ratio 0 0 0 0
8. Divided policies of company
Company has adopted strong dividend policy. It has followed profit based dividend policy. It
is observed that company has been distributing zero amount of dividend from its business.
The dividend policy of company is completely profit based so dividend is offered to clients
due to loss in its business
9. Letter of recommendation
After evaluating all the key information about the company, it is inferred that Empire
Resources Ltd has been facing several problems due to sluggish market conditions. It is
⊘ This is a preview!⊘
Do you want full access?
Subscribe today to unlock all pages.
Trusted by 1+ million students worldwide
1 out of 19
Related Documents


Your All-in-One AI-Powered Toolkit for Academic Success.
+13062052269
info@desklib.com
Available 24*7 on WhatsApp / Email
![[object Object]](/_next/static/media/star-bottom.7253800d.svg)
Unlock your academic potential
Copyright © 2020–2026 A2Z Services. All Rights Reserved. Developed and managed by ZUCOL.