Investment Analysis: Empire Resources - Share Price, WACC, CAPM
VerifiedAdded on 2024/04/24
|22
|4778
|368
Report
AI Summary
This report provides a comprehensive financial analysis of Kathmandu Holding Limited, a retailing company, focusing on its ownership structure, key financial ratios, share price movements, and investment potential. The analysis includes a detailed examination of the company's substantial shareholders, governance structure, and the calculation of key ratios such as Return on Assets (ROA), Return on Equity (ROE), and Debt Ratio for the past four years. The report also assesses the factors affecting the company's share prices, calculates its beta (β) and required rate of return using the Capital Asset Pricing Model (CAPM), and determines the Weighted Average Cost of Capital (WACC). Furthermore, it evaluates the company's debt ratio, dividend policy, and provides an investment recommendation based on the analysis, suggesting whether to include the company in an investment portfolio. The report concludes with a letter of recommendation to a client, explaining the rationale for including Kathmandu Holding Limited in their investment portfolio.

Finance for business
Paraphrase This Document
Need a fresh take? Get an instant paraphrase of this document with our AI Paraphraser
Table of Contents
Question 1:.......................................................................................................................................4
A description of the company:.........................................................................................................4
Question 2:...................................................................................................................................5
Specify ownership-governance structure of the company:..........................................................5
i) Name the main substantial shareholders: .............................................................................5
ii) Name the main people involved in the firm governance:...........................................................7
Question 3........................................................................................................................................9
I. Calculate the following key ratios for your selected company for the past 4 years.................9
II. Explain what phenomenon is being “captured” by the variable TA/OE, and.................10
III. Explain why the ROE (EBIT) is significantly greater than or less than the ROA (EBIT)......11
Question 4......................................................................................................................................12
Using the information from the ASX website: www.asx.com.au you must complete the following
tasks:..............................................................................................................................................12
i) Prepare a graph/chart for movements in the monthly share price over the last two years for
the company that you are investigating. Plot them against movements in the All Ordinaries
Index...........................................................................................................................................12
ii). Write a report which compares movements in the companies’ share price index to the All
Ords Index. For instance, how closely correlated is the line with the All Ords Index. Above or
below?........................................................................................................................................13
Question 5......................................................................................................................................14
Explain the factors that affect the share prices of empire resources:.............................................14
Question 6:.....................................................................................................................................15
I. What is their calculated beta (β) for your company?..........................................................15
II. If the risk-free rate is 4% and the market risk premium is 6%, use the Capital Asset
Pricing Model (CAPM) to calculate the required rate of return for the companies' shares.......15
III. Is the company you have chosen a “conservative” investment? Explain your answer...15
Question 7:.....................................................................................................................................16
Weighted Average Cost of Capital (WACC)................................................................................16
i. Using information from the latest company report for the company (i.e. interest rate on
their major source of long-term loans) and the estimated cost of equity capital calculated (in
part 6ii above), calculate the WACC for your company............................................................16
ii. Explain the implications that a higher WACC has on management’s evaluation on
prospective investment projects.................................................................................................16
Question 8......................................................................................................................................17
Consider the debt ratio for your company over the past two years:..............................................17
i) Does it appear to be working towards the maintenance of a preferred optimal capital
structure? (i.e., does it appear to be “stable”?). Explain your answer.......................................17
ii). what have they done to adjust/amend their gearing ratio? Increase or repay borrowings?
Issue or buy back shares? Has the Director’s Report given any information as to why they
have made any adjustments?......................................................................................................18
Discuss what dividend policy of the management of the company appears to be implemented.
Explain any reason related to that particular dividend policy....................................................19
Question 10:...................................................................................................................................20
Based on your analysis above, write a letter of recommendation to your client, providing an
explanation as for why you would like to include this company in his/her investment portfolio. 20
References:....................................................................................................................................21
⊘ This is a preview!⊘
Do you want full access?
Subscribe today to unlock all pages.
Trusted by 1+ million students worldwide
Question 1:
A description of the company:
Kathmandu Holding Limited:
Kathmandu Holding Limited is a retailing company which engaged in the designer marketing,
clothing retailing, retail of fabrics & products & deals with tools of travel or tourism adventure.
This company had founded in 1987 & located in Christchurch, New Zealand. The company has
been expanding its market Australia, New Zealand US & UK with 98 branches across the world.
The company offers its potential customers technical wearing, down gown & jackets, fleece &
casual wear in merino fabrics. Kathmandu Holding Limited also deals in clothing packs, sleeping
bags, canvas tents, camping-projects accessories & footwear as well as home appliances and
products for children. Family camping products like tents, shelter, furniture-fitting and kitchen
appliances in good and value varieties are also manufactured in KMD Company for their
customers.
The actual headquarter of the company is in New Zealand only that operates its business
activities & overall network of approx. 180 stores in New Zealand. Kathmandu holding limited
has been delivering a sufficient & improved result as shown in its financial statements. Sales
growth in last year was 4.0% which is around $425.6 million. Company has increased its gross
[profit margin around 62.5% which is hike of total 1% from 2016. Profit before earning and tax
were 54 % from NZ$33.4 million to NZ $50.3 million. Total dividend earning was enhanced by
38% t0 13% per share & EPS earning per share was increased from 10.2cent in financial year
2016 to 16.6 cent (Maher and Andersson, 2014).
Figure 1: Kathmandu Holding Limited.
(Source: Kathmandu Holdings Limited, 2016)
Paraphrase This Document
Need a fresh take? Get an instant paraphrase of this document with our AI Paraphraser
Question 2:
Specify ownership-governance structure of the company:
i) Name the main substantial shareholders:
With higher than 20.00% of shareholdings. Based on this argument you should classify a
firm as a family or non-family company
With higher than 5.00% of shareholdings.
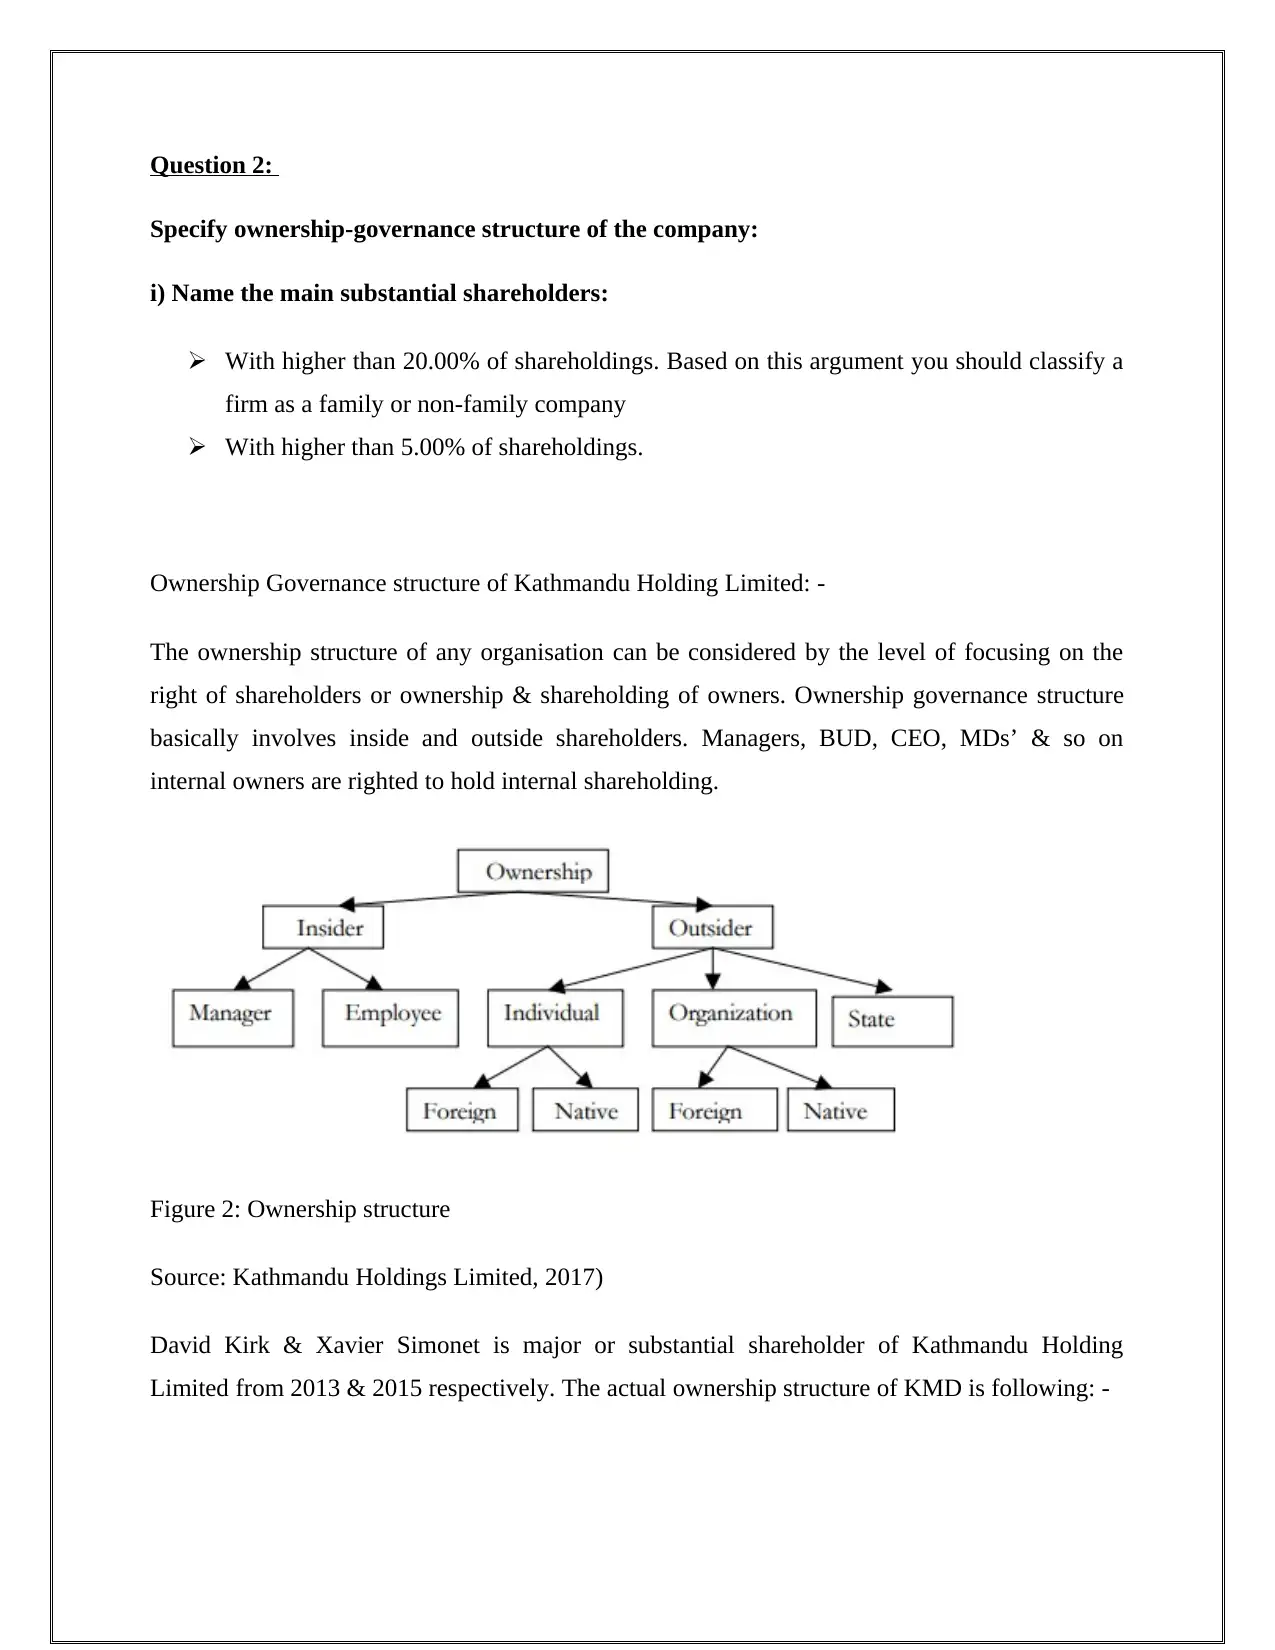
Ownership Governance structure of Kathmandu Holding Limited: -
The ownership structure of any organisation can be considered by the level of focusing on the
right of shareholders or ownership & shareholding of owners. Ownership governance structure
basically involves inside and outside shareholders. Managers, BUD, CEO, MDs’ & so on
internal owners are righted to hold internal shareholding.
Figure 2: Ownership structure
Source: Kathmandu Holdings Limited, 2017)
David Kirk & Xavier Simonet is major or substantial shareholder of Kathmandu Holding
Limited from 2013 & 2015 respectively. The actual ownership structure of KMD is following: -
Specify ownership-governance structure of the company:
i) Name the main substantial shareholders:
With higher than 20.00% of shareholdings. Based on this argument you should classify a
firm as a family or non-family company
With higher than 5.00% of shareholdings.
Ownership Governance structure of Kathmandu Holding Limited: -
The ownership structure of any organisation can be considered by the level of focusing on the
right of shareholders or ownership & shareholding of owners. Ownership governance structure
basically involves inside and outside shareholders. Managers, BUD, CEO, MDs’ & so on
internal owners are righted to hold internal shareholding.
Figure 2: Ownership structure
Source: Kathmandu Holdings Limited, 2017)
David Kirk & Xavier Simonet is major or substantial shareholder of Kathmandu Holding
Limited from 2013 & 2015 respectively. The actual ownership structure of KMD is following: -
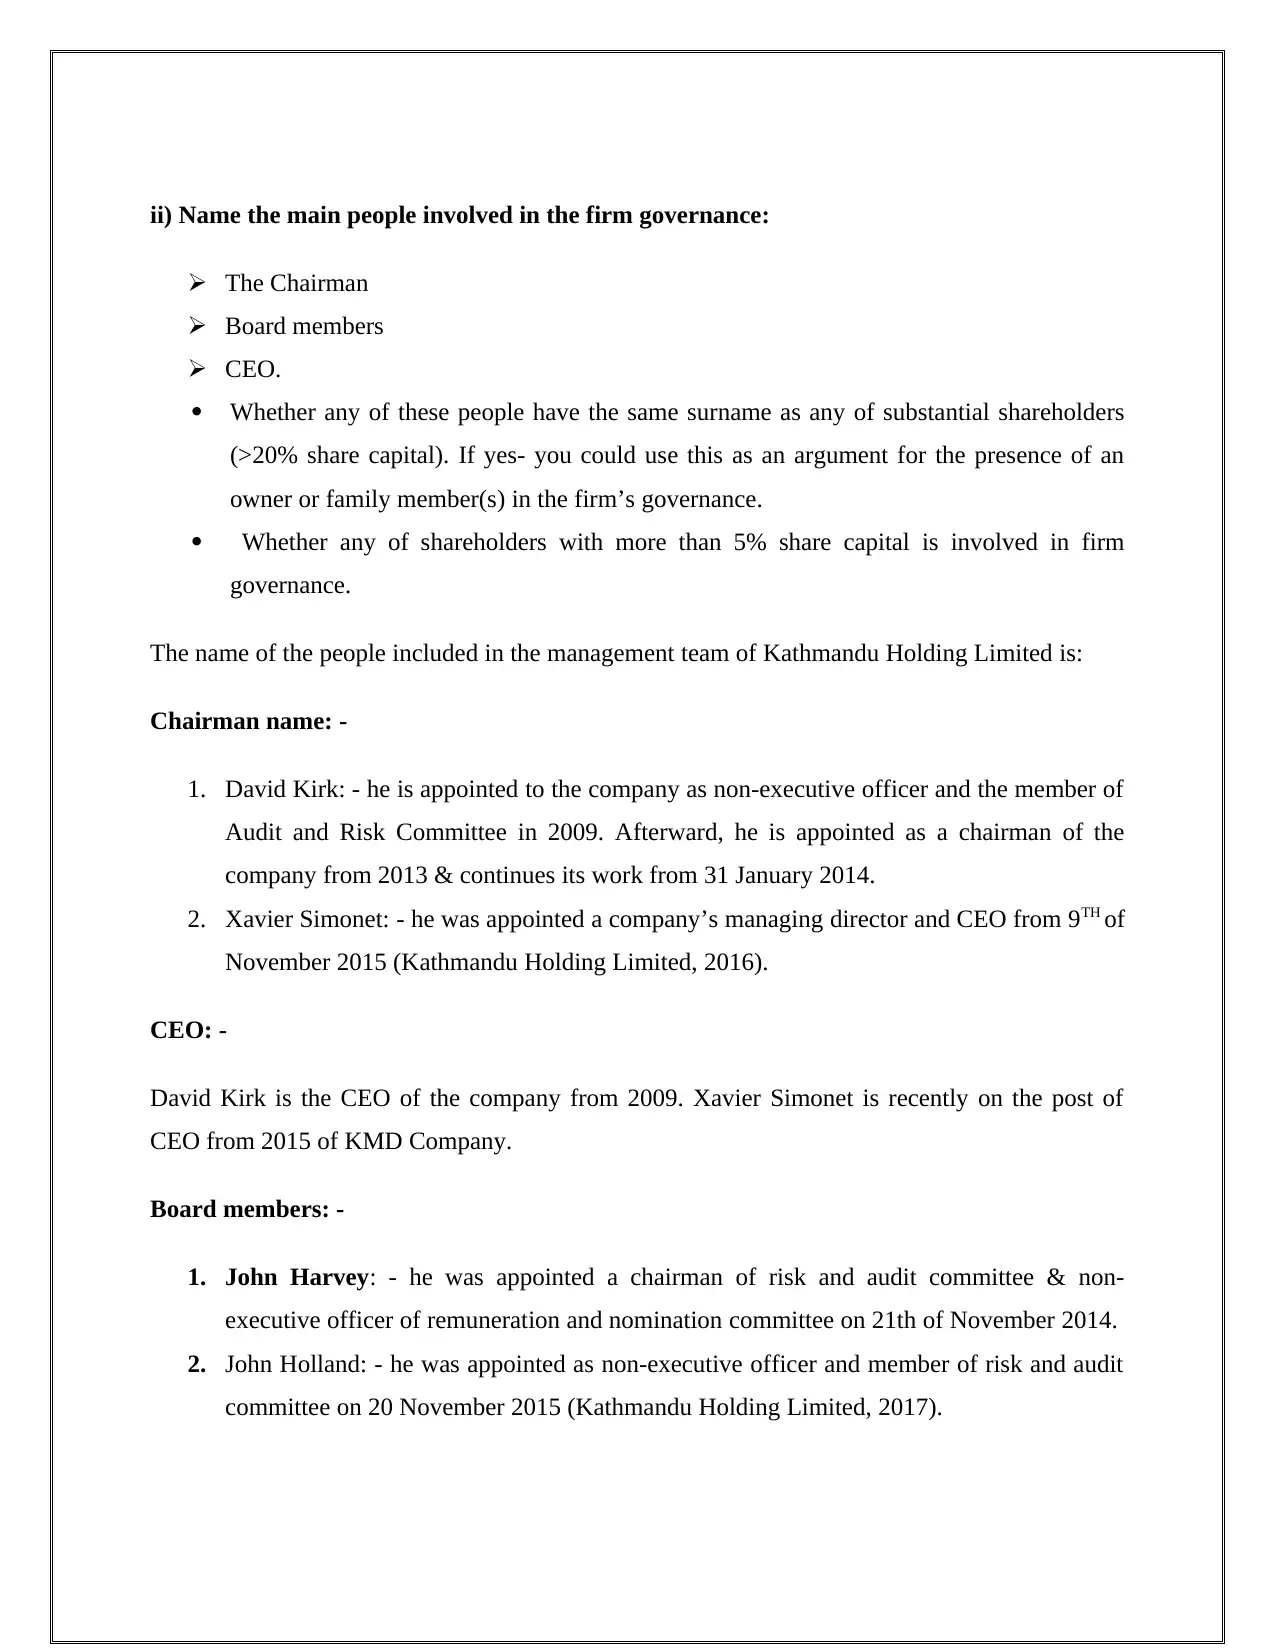
II. With higher than 5.00% of shareholdings.
Other shareholders with their shareholding formation: -
Names equities %
Briscoe Group Ltd. (substantial
shareholding)
40,095,432 19.8%
TA Universal Investment Holdings Ltd. 24,212,664 12.0%
Challenger Ltd. (Investment Management) 15,313,741 7.57%
Nova Port Capital Pty Ltd. 15,194,513 7.52%
Unit Super Ltd. 13,858,777 6.86%
Harbour Asset Management Ltd. 12,374,372 6.12%
⊘ This is a preview!⊘
Do you want full access?
Subscribe today to unlock all pages.
Trusted by 1+ million students worldwide
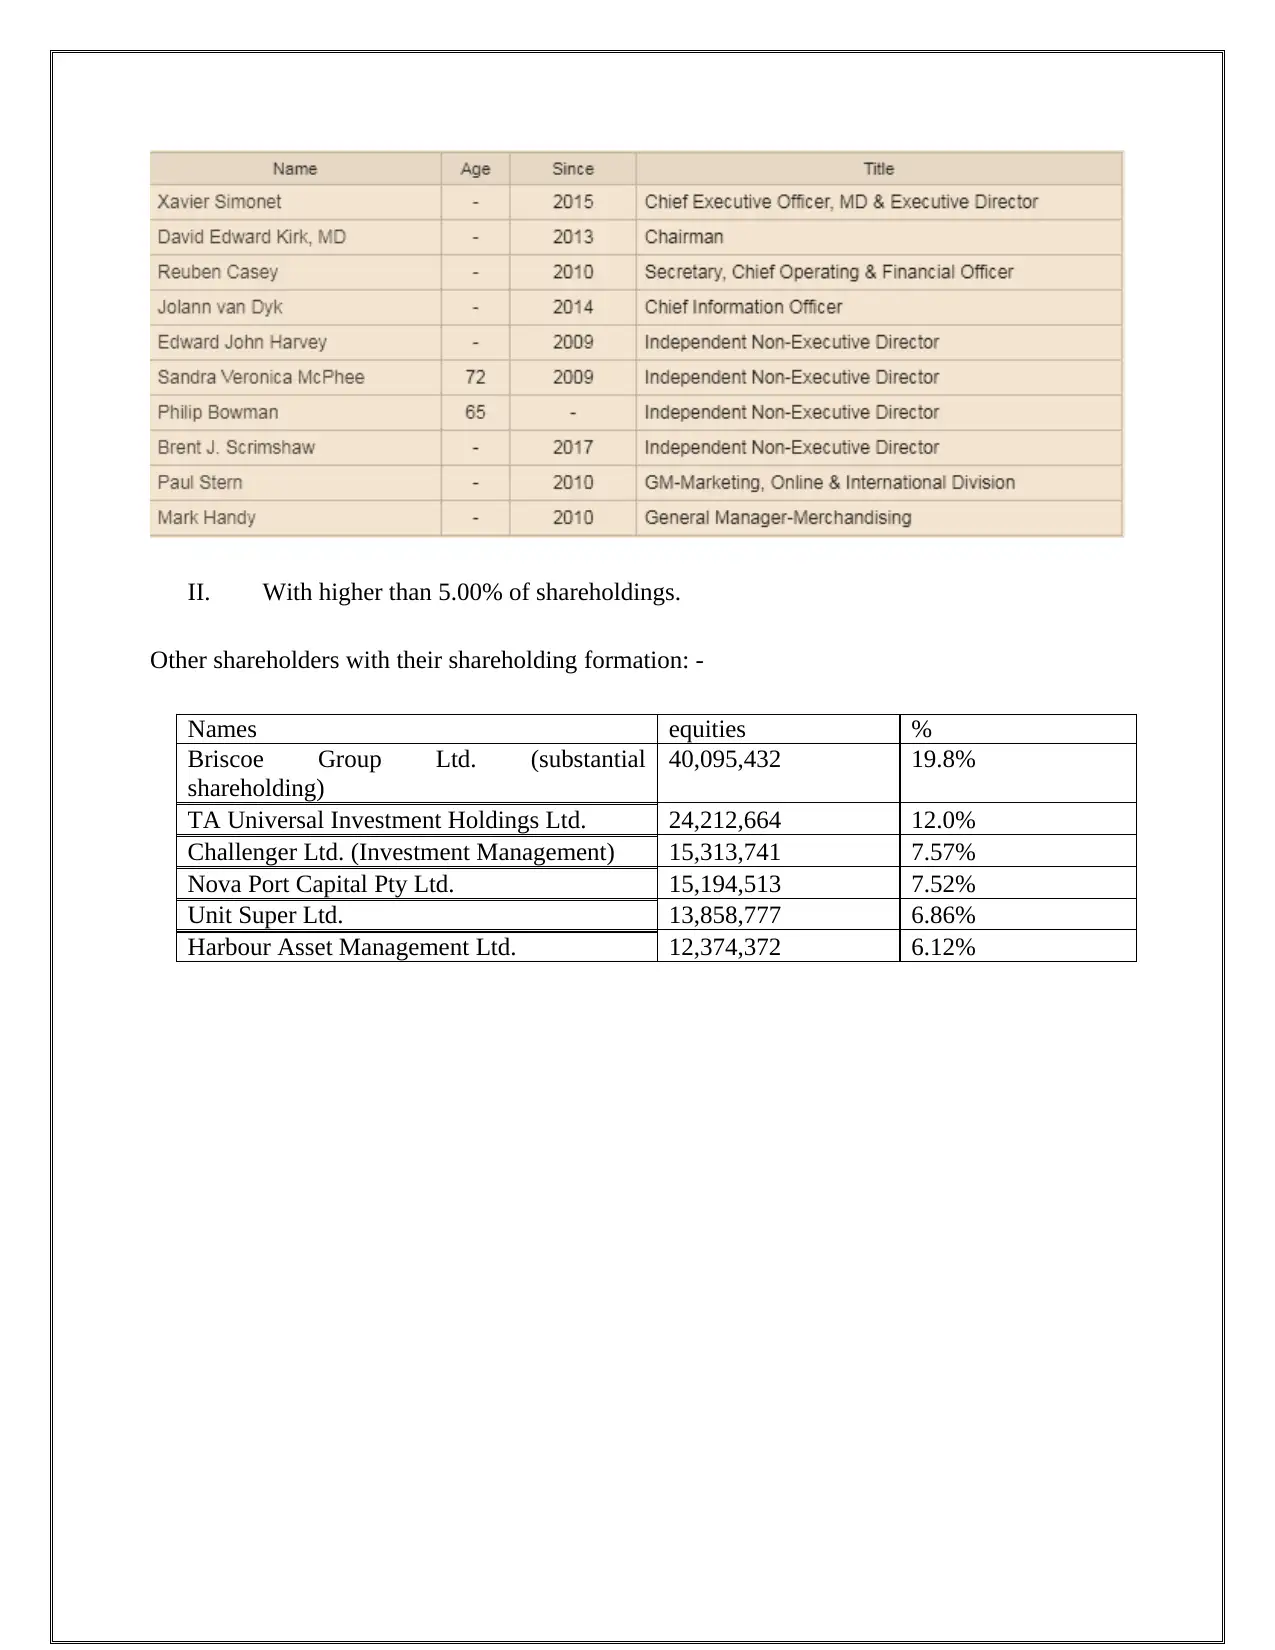
ii) Name the main people involved in the firm governance:
The Chairman
Board members
CEO.
Whether any of these people have the same surname as any of substantial shareholders
(>20% share capital). If yes- you could use this as an argument for the presence of an
owner or family member(s) in the firm’s governance.
Whether any of shareholders with more than 5% share capital is involved in firm
governance.
The name of the people included in the management team of Kathmandu Holding Limited is:
Chairman name: -
1. David Kirk: - he is appointed to the company as non-executive officer and the member of
Audit and Risk Committee in 2009. Afterward, he is appointed as a chairman of the
company from 2013 & continues its work from 31 January 2014.
2. Xavier Simonet: - he was appointed a company’s managing director and CEO from 9TH of
November 2015 (Kathmandu Holding Limited, 2016).
CEO: -
David Kirk is the CEO of the company from 2009. Xavier Simonet is recently on the post of
CEO from 2015 of KMD Company.
Board members: -
1. John Harvey: - he was appointed a chairman of risk and audit committee & non-
executive officer of remuneration and nomination committee on 21th of November 2014.
2. John Holland: - he was appointed as non-executive officer and member of risk and audit
committee on 20 November 2015 (Kathmandu Holding Limited, 2017).
Paraphrase This Document
Need a fresh take? Get an instant paraphrase of this document with our AI Paraphraser
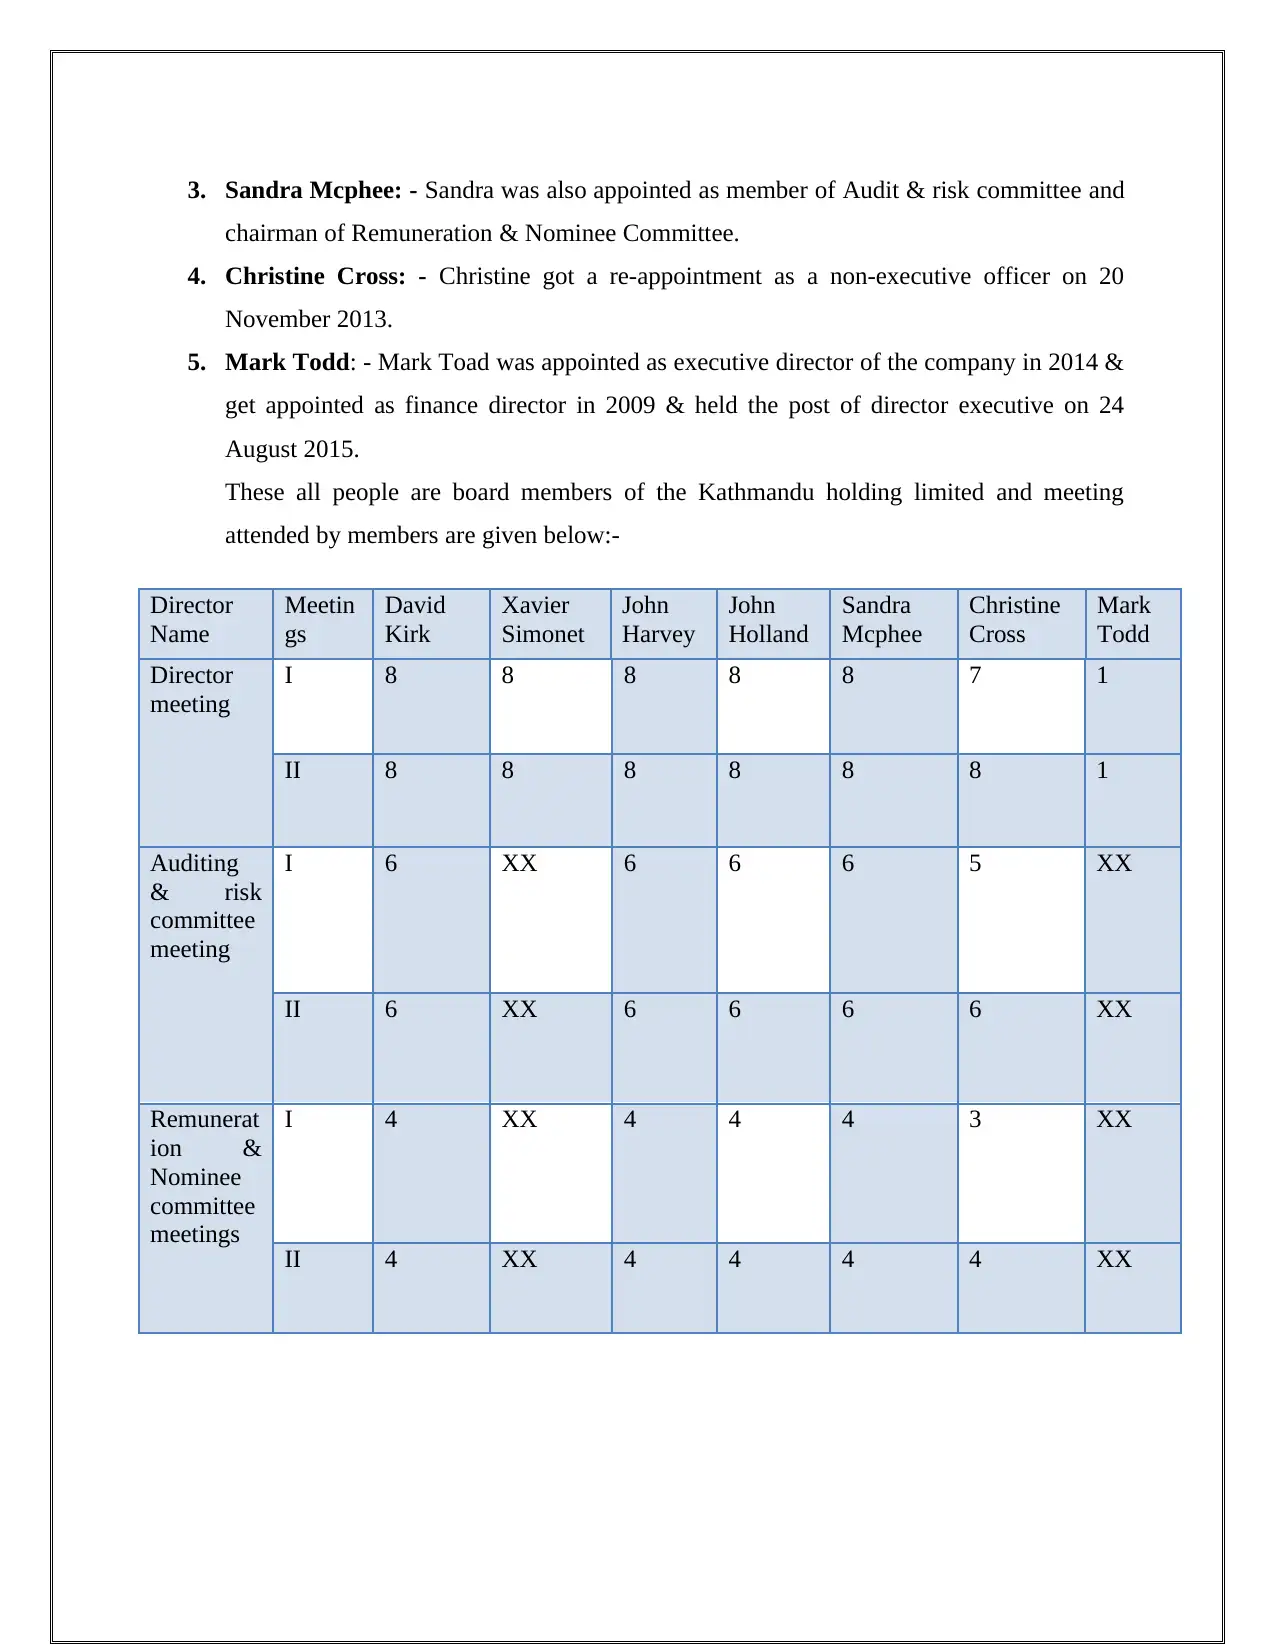
3. Sandra Mcphee: - Sandra was also appointed as member of Audit & risk committee and
chairman of Remuneration & Nominee Committee.
4. Christine Cross: - Christine got a re-appointment as a non-executive officer on 20
November 2013.
5. Mark Todd: - Mark Toad was appointed as executive director of the company in 2014 &
get appointed as finance director in 2009 & held the post of director executive on 24
August 2015.
These all people are board members of the Kathmandu holding limited and meeting
attended by members are given below:-
Director
Name
Meetin
gs
David
Kirk
Xavier
Simonet
John
Harvey
John
Holland
Sandra
Mcphee
Christine
Cross
Mark
Todd
Director
meeting
I 8 8 8 8 8 7 1
II 8 8 8 8 8 8 1
Auditing
& risk
committee
meeting
I 6 XX 6 6 6 5 XX
II 6 XX 6 6 6 6 XX
Remunerat
ion &
Nominee
committee
meetings
I 4 XX 4 4 4 3 XX
II 4 XX 4 4 4 4 XX
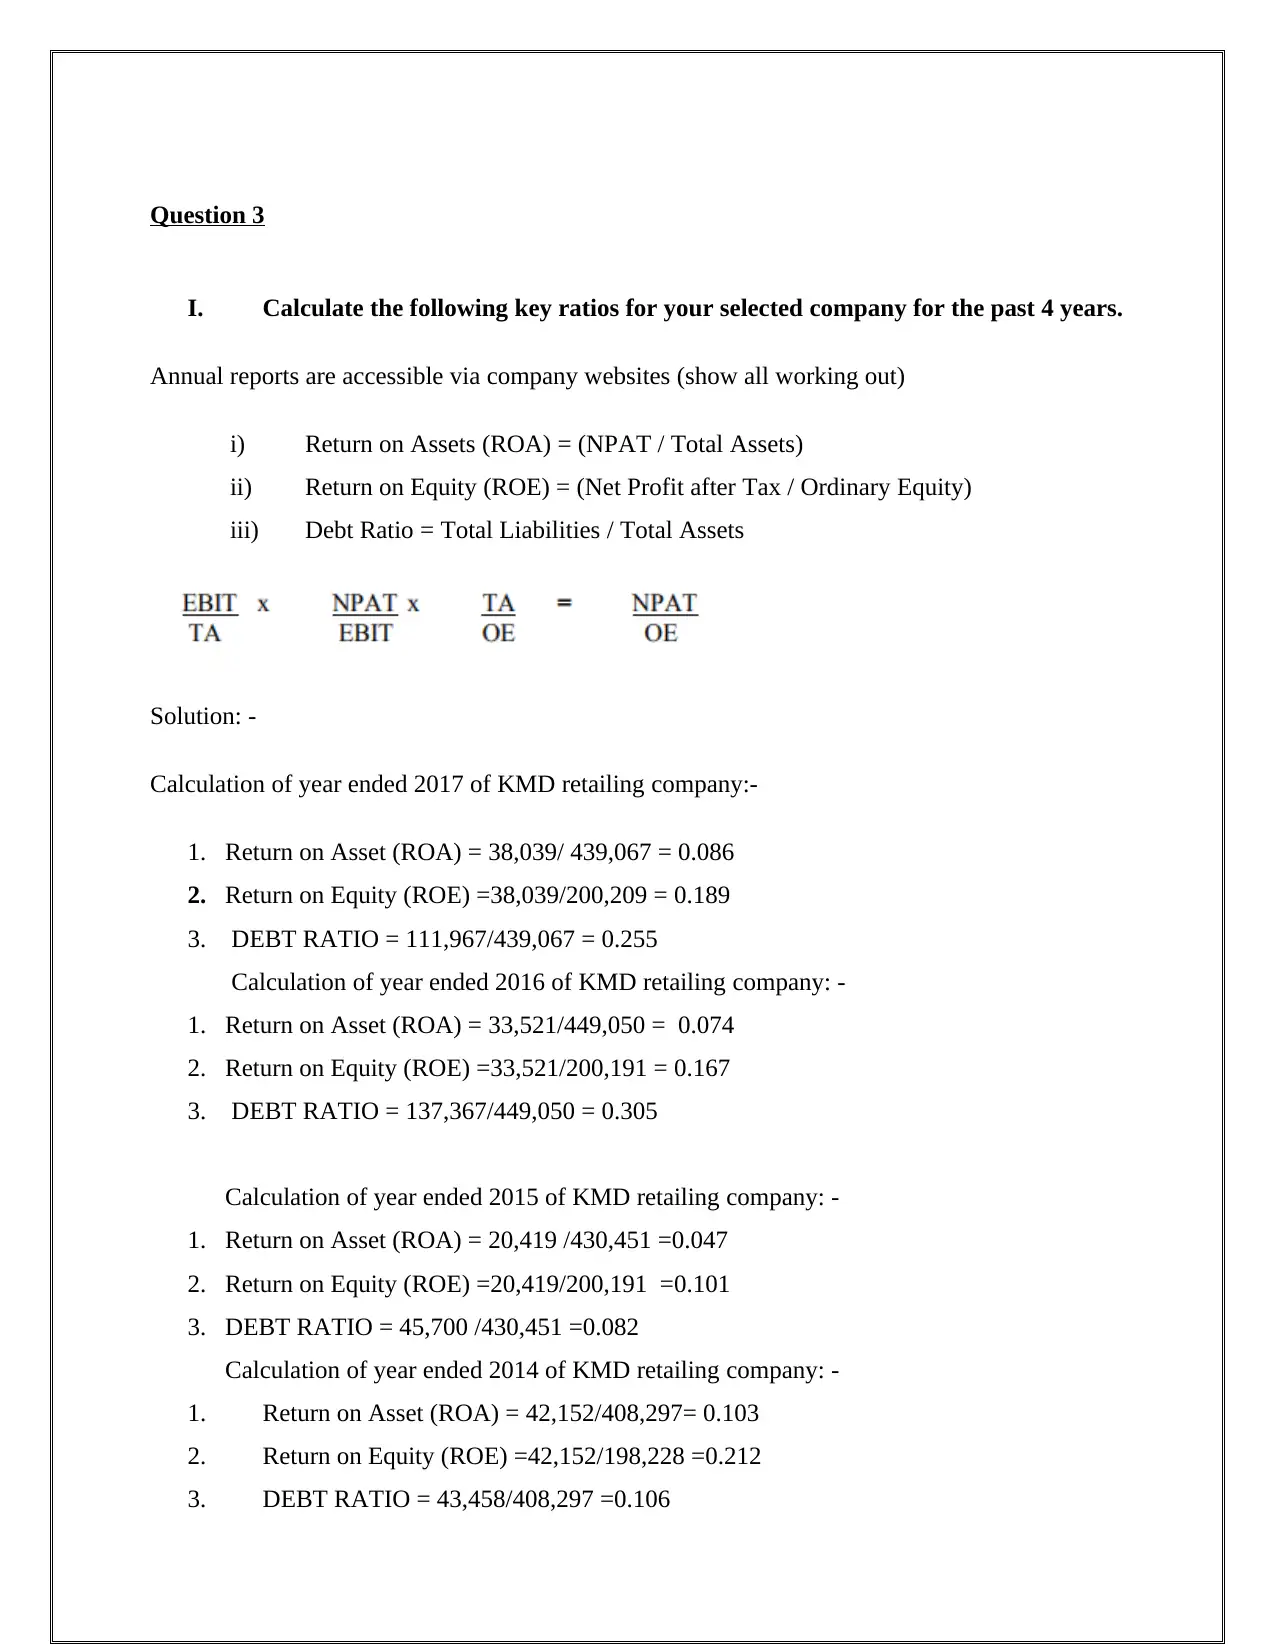
Question 3
I. Calculate the following key ratios for your selected company for the past 4 years.
Annual reports are accessible via company websites (show all working out)
i) Return on Assets (ROA) = (NPAT / Total Assets)
ii) Return on Equity (ROE) = (Net Profit after Tax / Ordinary Equity)
iii) Debt Ratio = Total Liabilities / Total Assets
Solution: -
Calculation of year ended 2017 of KMD retailing company:-
1. Return on Asset (ROA) = 38,039/ 439,067 = 0.086
2. Return on Equity (ROE) =38,039/200,209 = 0.189
3. DEBT RATIO = 111,967/439,067 = 0.255
Calculation of year ended 2016 of KMD retailing company: -
1. Return on Asset (ROA) = 33,521/449,050 = 0.074
2. Return on Equity (ROE) =33,521/200,191 = 0.167
3. DEBT RATIO = 137,367/449,050 = 0.305
Calculation of year ended 2015 of KMD retailing company: -
1. Return on Asset (ROA) = 20,419 /430,451 =0.047
2. Return on Equity (ROE) =20,419/200,191 =0.101
3. DEBT RATIO = 45,700 /430,451 =0.082
Calculation of year ended 2014 of KMD retailing company: -
1. Return on Asset (ROA) = 42,152/408,297= 0.103
2. Return on Equity (ROE) =42,152/198,228 =0.212
3. DEBT RATIO = 43,458/408,297 =0.106
⊘ This is a preview!⊘
Do you want full access?
Subscribe today to unlock all pages.
Trusted by 1+ million students worldwide
II. Explain what phenomenon is being “captured” by the variable TA/OE, and how
it is impacting on the relationship between Return on Assets and Return on
Owners Equity.
The component in above analysis helps in analyse actual figures related to return on investments.
The relation between total return on assets and return on investment (owner equity) indicates
actual liabilities regarding organisation owner leverages which would be applied or used in
manage financial operations in the business. The relation of total assets and ownership equity
allows company to measure actual financial performance of the company related to sales,
company performance & another economic situation of the organisation. In the finance where
total assets include total property of the company whether tangible or intangible it is. Total assets
include sticks, debtors etc. on the other hand, total equity ownership means difference between
overall value of assets and total liabilities (Financial Times, 2013).
Equity can be determined as capital stock or inventory of the organisation. When the relation of
total assets and equity increases and goes high it indicates high value of assets whereas lower
value of equity, such values shows that company is in condition to meet its long-term
requirement and cover its high term risks and debts. This situation is known as trading on an
equity position. When company estimate low value of assets and high value of equity then this is
the situation, company is not in any condition to cover its debts. A low value of assets over
equity shows foolishness & low skilled ability. In such situation, a company cannot get expected
returns on borrowed capital & cost of capital (Financial Times, 2013).
Paraphrase This Document
Need a fresh take? Get an instant paraphrase of this document with our AI Paraphraser
III. Explain why the ROE (EBIT) is significantly greater than or less than the ROA
(EBIT).
Return on equity creates a crucial measurement related to financial statements and company
liquidity position. Return on equity analysis allows the company to define as strategic profit in
the terms of sales, net profit margin and asset turnover and financial leverages. ROE = net
incomes. Sales x sales/ total assets X assets / and related to shareholder equity. Increase in the
level of net margin obtains each and every sale enhances the net income & ROA. Decrease the
level OF ROE (net income margin) will push the performance to the negative path and sales
level would be decline. Due to this ROA would be less than ROE (EBIT) (Entrepreneur, 2017).
Asset turnover can be taken as sales per unit on total sales. Such amount of sale is an amount
which would be generated per unit asset as a toll of ROE. Decrease asset turns over
predetermines revenue obtained would not match the total cost based on total assets to
manufacture the services of products. In any company, ROE is called a return on investment that
is obtained in financial statement of the organisation through expected return. When ROE would
be considered as greater than COEC cost of capital equity, organisation can easily enhance its
productivity and proficiency level to achieve organisational goals. On the other hand, high ROE
over ROA is taken as company's strong holding upon its properties and assets in an effective
manner. Higher gearing possession would enhance higher ROE than ROE earnings before
income and tax. In this situation, a company would be not able to trade off over the corporate
cost. A lower value of ROE upon ROA will enhance the profit and income of the company
(Entrepreneur, 2017).
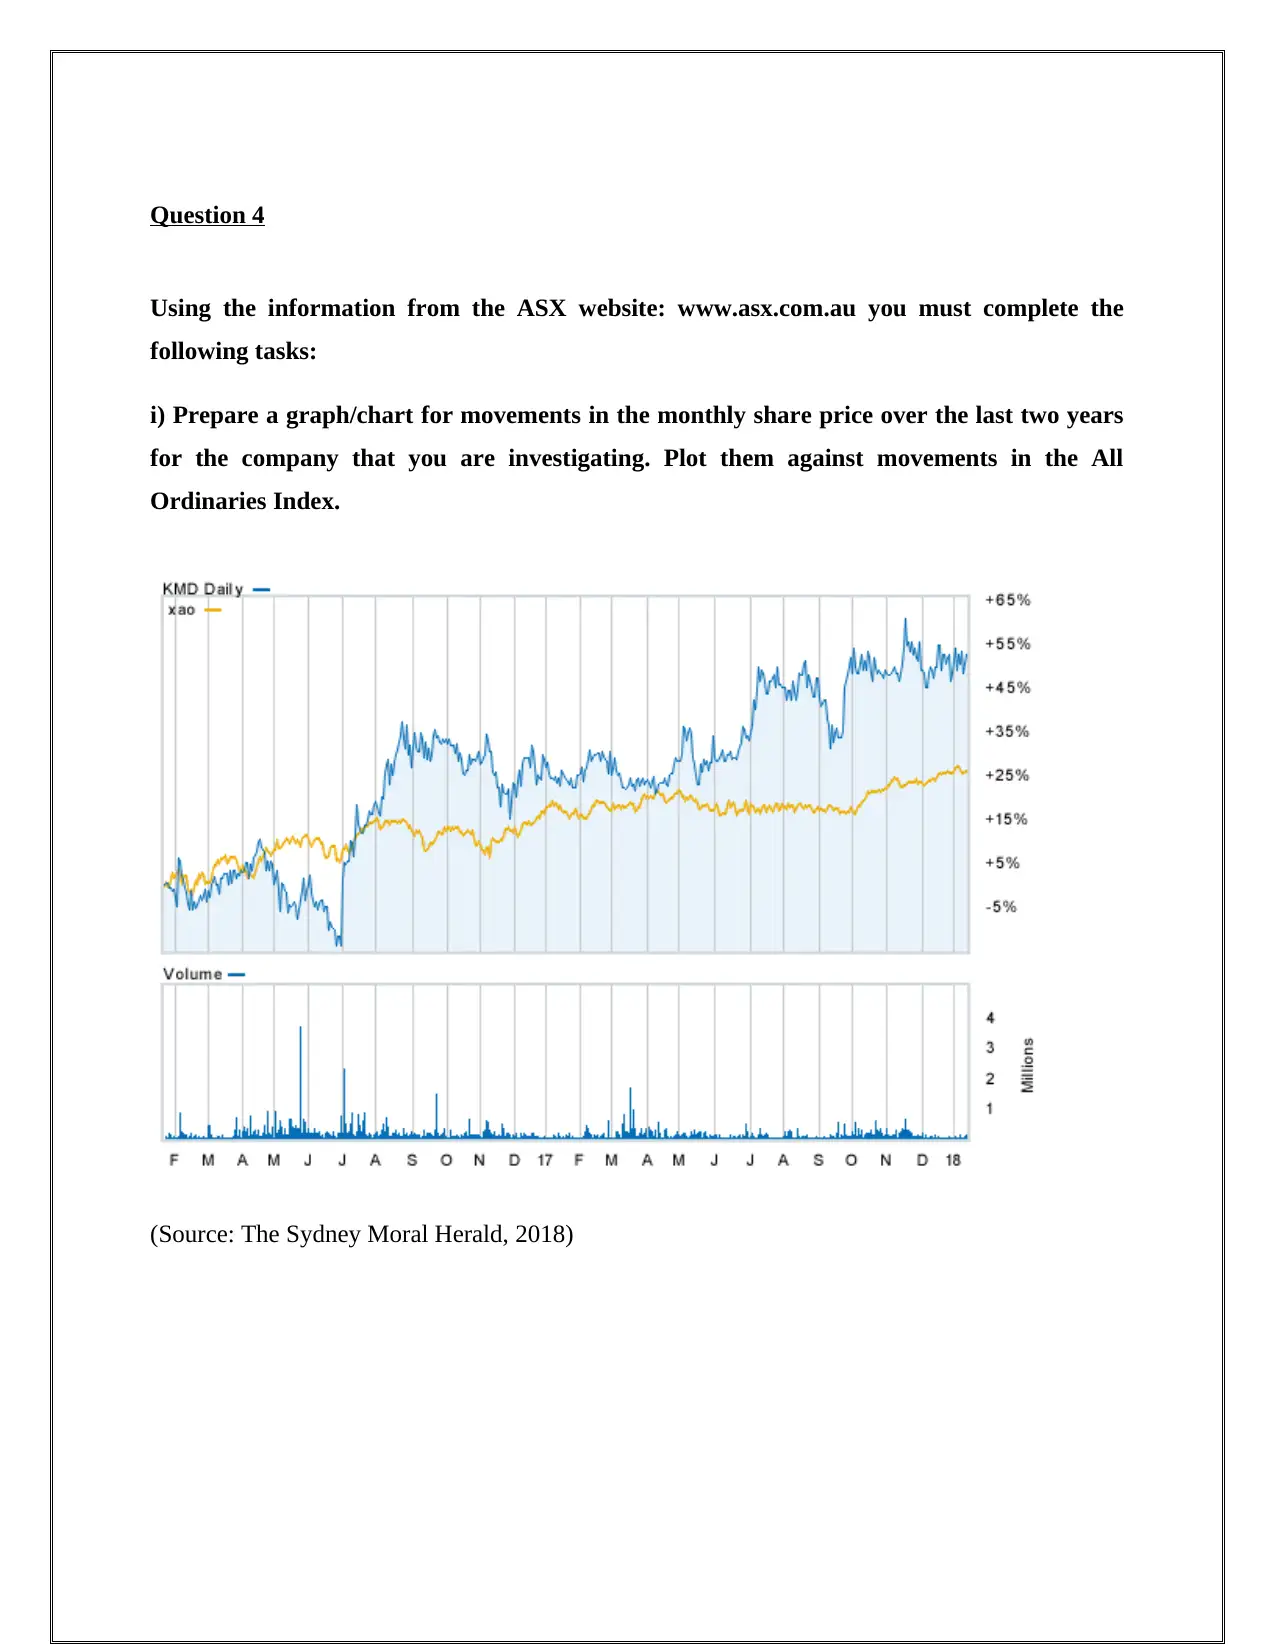
Question 4
Using the information from the ASX website: www.asx.com.au you must complete the
following tasks:
i) Prepare a graph/chart for movements in the monthly share price over the last two years
for the company that you are investigating. Plot them against movements in the All
Ordinaries Index.
(Source: The Sydney Moral Herald, 2018)
⊘ This is a preview!⊘
Do you want full access?
Subscribe today to unlock all pages.
Trusted by 1+ million students worldwide
1 out of 22
Related Documents


Your All-in-One AI-Powered Toolkit for Academic Success.
+13062052269
info@desklib.com
Available 24*7 on WhatsApp / Email
![[object Object]](/_next/static/media/star-bottom.7253800d.svg)
Unlock your academic potential
Copyright © 2020–2026 A2Z Services. All Rights Reserved. Developed and managed by ZUCOL.