University Report: Business Decision Analysis of Employee Absenteeism
VerifiedAdded on 2022/08/24
|33
|6529
|15
Report
AI Summary
This report delves into the critical issue of employee absenteeism within an IT company, employing a data-driven approach to identify key influencing factors and propose effective strategies for improvement. The analysis utilizes a dataset from a courier company, leveraging its relevance to the IT sector. Several decision-making tools are applied, including regression analysis, ANOVA, and Pareto analysis, to uncover relationships between various attributes and absenteeism rates. The report outlines the problem of absenteeism, detailing potential causes such as illness, workplace bullying, disengagement, low morale, burnout, and lack of flexibility. The regression analysis identifies the most significant variables affecting absenteeism, while ANOVA explores variance among different factors. Pareto analysis pinpoints the most impactful contributors. The findings aim to inform the management of the IT company, providing insights to increase employee engagement and improve overall workforce performance. The report concludes with a discussion of the results, offering recommendations for mitigating absenteeism and fostering a more productive work environment.
Running head: BUSINESS DECISION ANALYSIS
BUSINESS DECISION ANALYSIS
Name of the Student
Name of the University
Author Note
BUSINESS DECISION ANALYSIS
Name of the Student
Name of the University
Author Note
Paraphrase This Document
Need a fresh take? Get an instant paraphrase of this document with our AI Paraphraser
Table of Contents
Introduction:...............................................................................................................................3
Problem description:..................................................................................................................4
Dataset information:...................................................................................................................6
Decision making tools:...............................................................................................................8
Regression analysis:...................................................................................................................9
ANOVA:..................................................................................................................................11
Pareto analysis:.........................................................................................................................18
Discussion of results of decision making tools:.......................................................................20
Conclusion:..............................................................................................................................21
References:...............................................................................................................................22
Appendix:.................................................................................................................................24
Introduction:
Decision making is an important aspect in the operations of any organization.
Decision making has a vital role to play in the achievement of various organizational goals. It
can be considered as a pervasive function of the mangers that is aimed at accomplishing all
the organizational goals. Decision making is referred to as a process that helps in selecting
best course of action from among many of the available alternatives. It is the responsibility
of the management in an organization to take vital decisions and at the same time ascertain
that these are carried out in accordance with the defined goals. Decision making can be
considered as the medium through which the managerial functions such as planning,
directing, controlling and organizing are controlled. It is important at each and every level of
management (Kocakulah et al., 2016). The officials in the top level build up strategic
decisions that include planning, organizing, controlling as well as directing. The individuals
occupying middle level management take tactical decisions that include division of works,
integration of efforts and many more. The officials at the management level are responsible
to take regular operating decisions including preparation of schedule of daily tasks,
delegation of authority and many more. Thus it can be understood that decision making has a
important role to play at all levels of management and helps in bringing uniformity as well as
smoothness in the performance of the organization. In order to understand the importance of
decision making a data analytics has been considered. The data is that of an IT company and
relates to the number of the employees absent at work on average basis. This will give an idea
about what percentage of the workforce are habituated to take leaves and how many of them
are serious with their work. This particular data can speak volumes about the organizational
culture. For instance if a lot of employees are absent regularly it can be said that they are
either not happy with their work or they do not like the work culture of the organization.
There can always be other reasons but regularly taking off from work reveals that they are
⊘ This is a preview!⊘
Do you want full access?
Subscribe today to unlock all pages.
Trusted by 1+ million students worldwide
lacking interest in their work. In this paper, the data of absenteeism obtained will help the
management of the organization to understand what it is that is bothering their employees and
what can they do for the same. On the basis of this data they can decide the steps that need to
be taken to increase the rate of engagement of the employees in their work.
Problem description:
The most common challenge which is faced in any workplace is to deal with
absenteeism of employees as the workforce of organizations is very much affected by sudden
absence of particular employees. Thus in this project it is aimed to find out the factors that
significantly causes the absence of employees by using suitable statistical decision making
tools. Also, by the results of those decision making tools some convenient strategies are
proposed that will decrease the overall absenteeism in the IT organization.
Causes of absenteeism in workplace
There are several reasons that have been leading to absenteeism in workplace in IT
industry. Out of the several issues that have been leading to the absenteeism in the workplace,
there are 6 major instances that are to be considered. In recent times it have been seen that
there have been issues regarding the being present in office. This absenteeism of employees
has been affecting the working process of the organization (Randhawa, 2017)).
The major issues that have been seen in this case are as follows: -
1. Illness and injuries have been one of the major aspects that are to be considered. This is the
case where the employees fail to inform the employees that they will not be able to visit
office and perform their duty. Thus the managers are not well aware of the absenteeism and
the working process gets hampered. These have been one of the major reasons that have been
causing absenteeism in the work place.
Paraphrase This Document
Need a fresh take? Get an instant paraphrase of this document with our AI Paraphraser
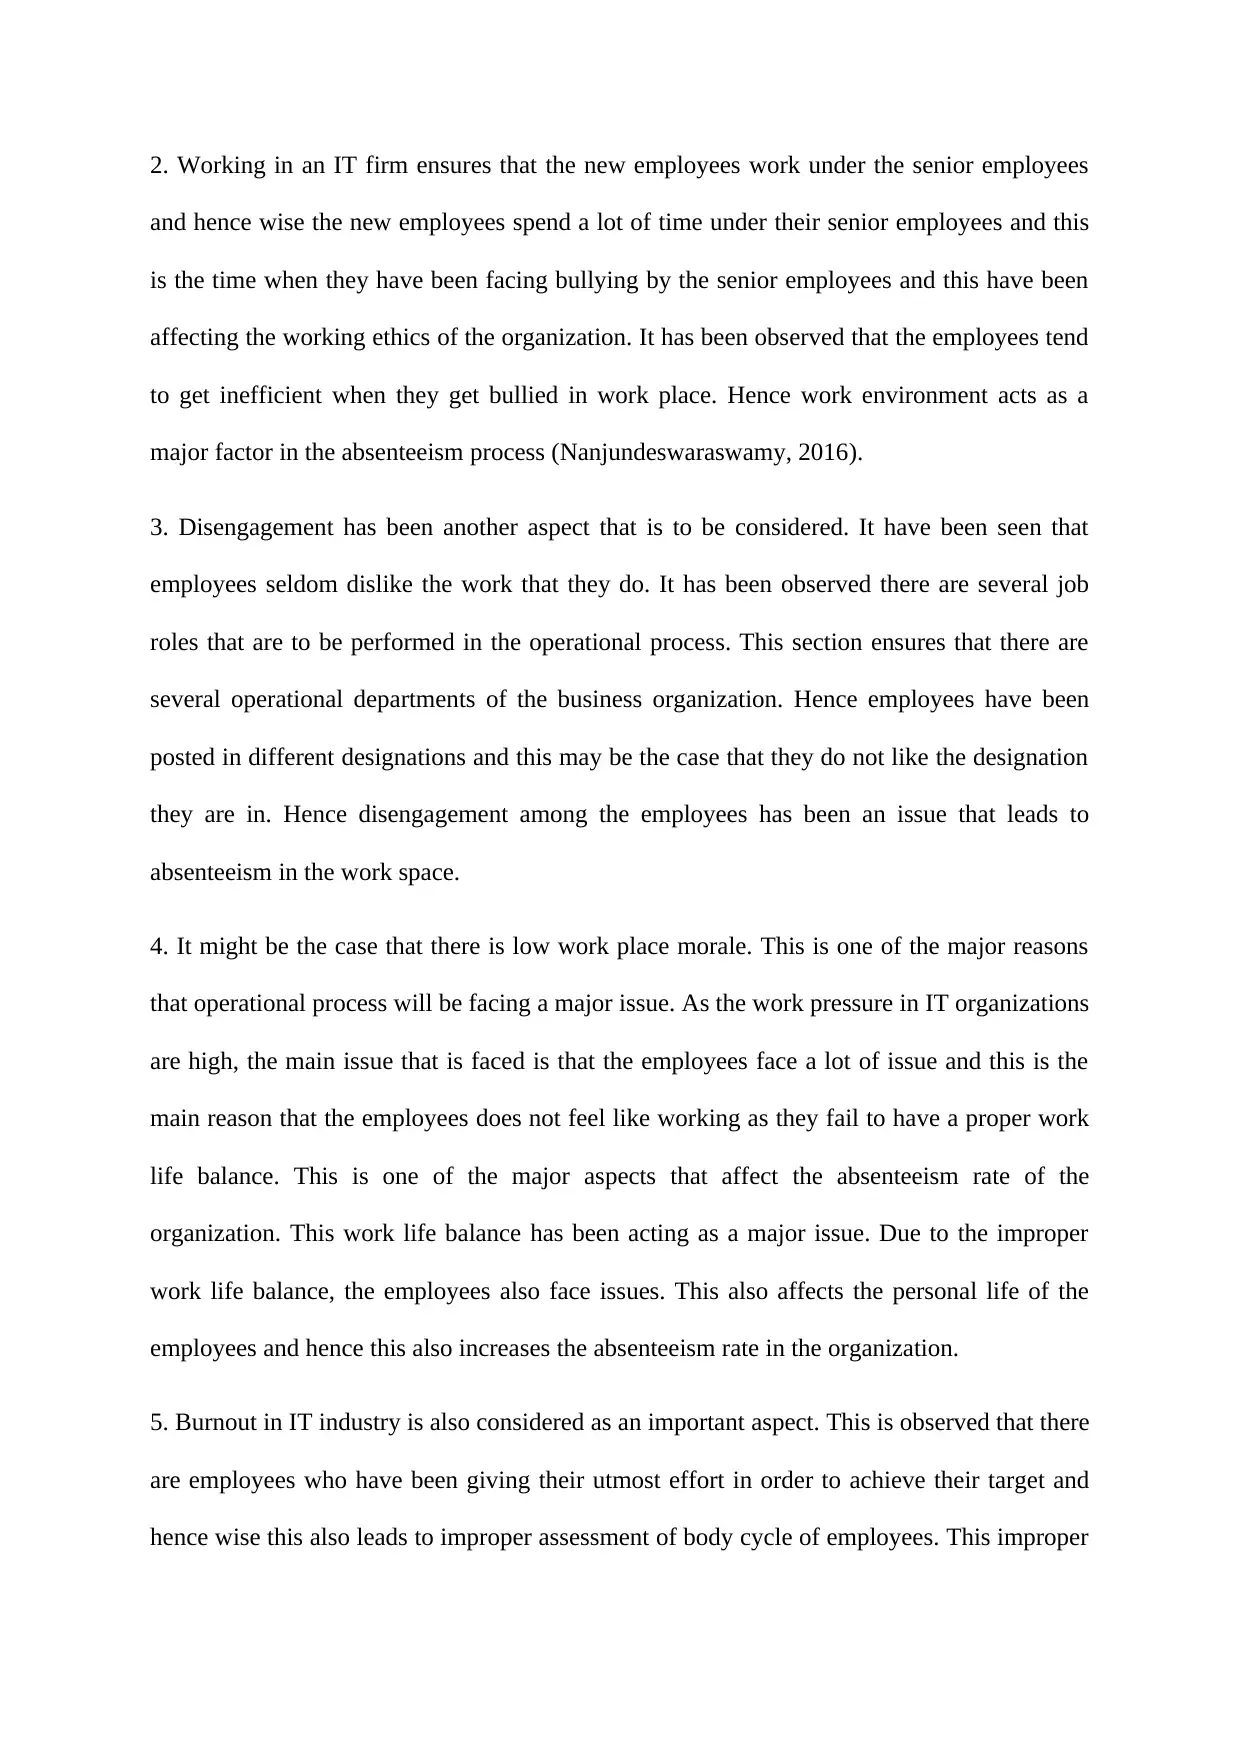
2. Working in an IT firm ensures that the new employees work under the senior employees
and hence wise the new employees spend a lot of time under their senior employees and this
is the time when they have been facing bullying by the senior employees and this have been
affecting the working ethics of the organization. It has been observed that the employees tend
to get inefficient when they get bullied in work place. Hence work environment acts as a
major factor in the absenteeism process (Nanjundeswaraswamy, 2016).
3. Disengagement has been another aspect that is to be considered. It have been seen that
employees seldom dislike the work that they do. It has been observed there are several job
roles that are to be performed in the operational process. This section ensures that there are
several operational departments of the business organization. Hence employees have been
posted in different designations and this may be the case that they do not like the designation
they are in. Hence disengagement among the employees has been an issue that leads to
absenteeism in the work space.
4. It might be the case that there is low work place morale. This is one of the major reasons
that operational process will be facing a major issue. As the work pressure in IT organizations
are high, the main issue that is faced is that the employees face a lot of issue and this is the
main reason that the employees does not feel like working as they fail to have a proper work
life balance. This is one of the major aspects that affect the absenteeism rate of the
organization. This work life balance has been acting as a major issue. Due to the improper
work life balance, the employees also face issues. This also affects the personal life of the
employees and hence this also increases the absenteeism rate in the organization.
5. Burnout in IT industry is also considered as an important aspect. This is observed that there
are employees who have been giving their utmost effort in order to achieve their target and
hence wise this also leads to improper assessment of body cycle of employees. This improper
body clock ensures that the employees get burnout and absenteeism in the working process
occurs.
6. Lack of flexibility has been another issue that is to be considered. It have been seen that in
case flexibility have been reduced the employees fail to work accordingly and hence this
affects the schedule of the working team. Hence employees need to usurp their leave balance
and hence rate of absenteeism increases.
Dataset information:
The dataset which is used for the research is obtained from the UCI machine learning
repository database where this dataset was contributed by Andrea Martiniano , Ricardo Pinto
Ferreira and Renato Jose Sassi (three post graduate students of Universidade Nove de Julho),
who used this data in postgraduate program in Informatics and Knowledge Management.
Originally the dataset is extracted from July 2007 to July 2010 records of absenteeism at a
courier company in Brazil. The attributes or variables of the dataset are common for many
organizations including IT companies and thus it is assumed that absenteeism characteristics
of the courier company is similar to absenteeism behaviour in the chosen IT organization.
The data is a multivariate set of data and is real integer values. The number of the instances
considered for this data set is 740 and the number of attributes considered is 21 ("UCI
Machine Learning Repository: Absenteeism at work Data Set", 2020). The data set relates to
the business domain as it is the data of absenteeism of employees in an IT company. The data
set permits several combinations of various attributes along with attribute exclusions or
modifications done to the different type of attributes that include categorical, real or integer
values. The type of attribute in a data set depends on the purpose of the research. The
attributes that have been considered in this case are as follows:
1. Identification of the individual
⊘ This is a preview!⊘
Do you want full access?
Subscribe today to unlock all pages.
Trusted by 1+ million students worldwide
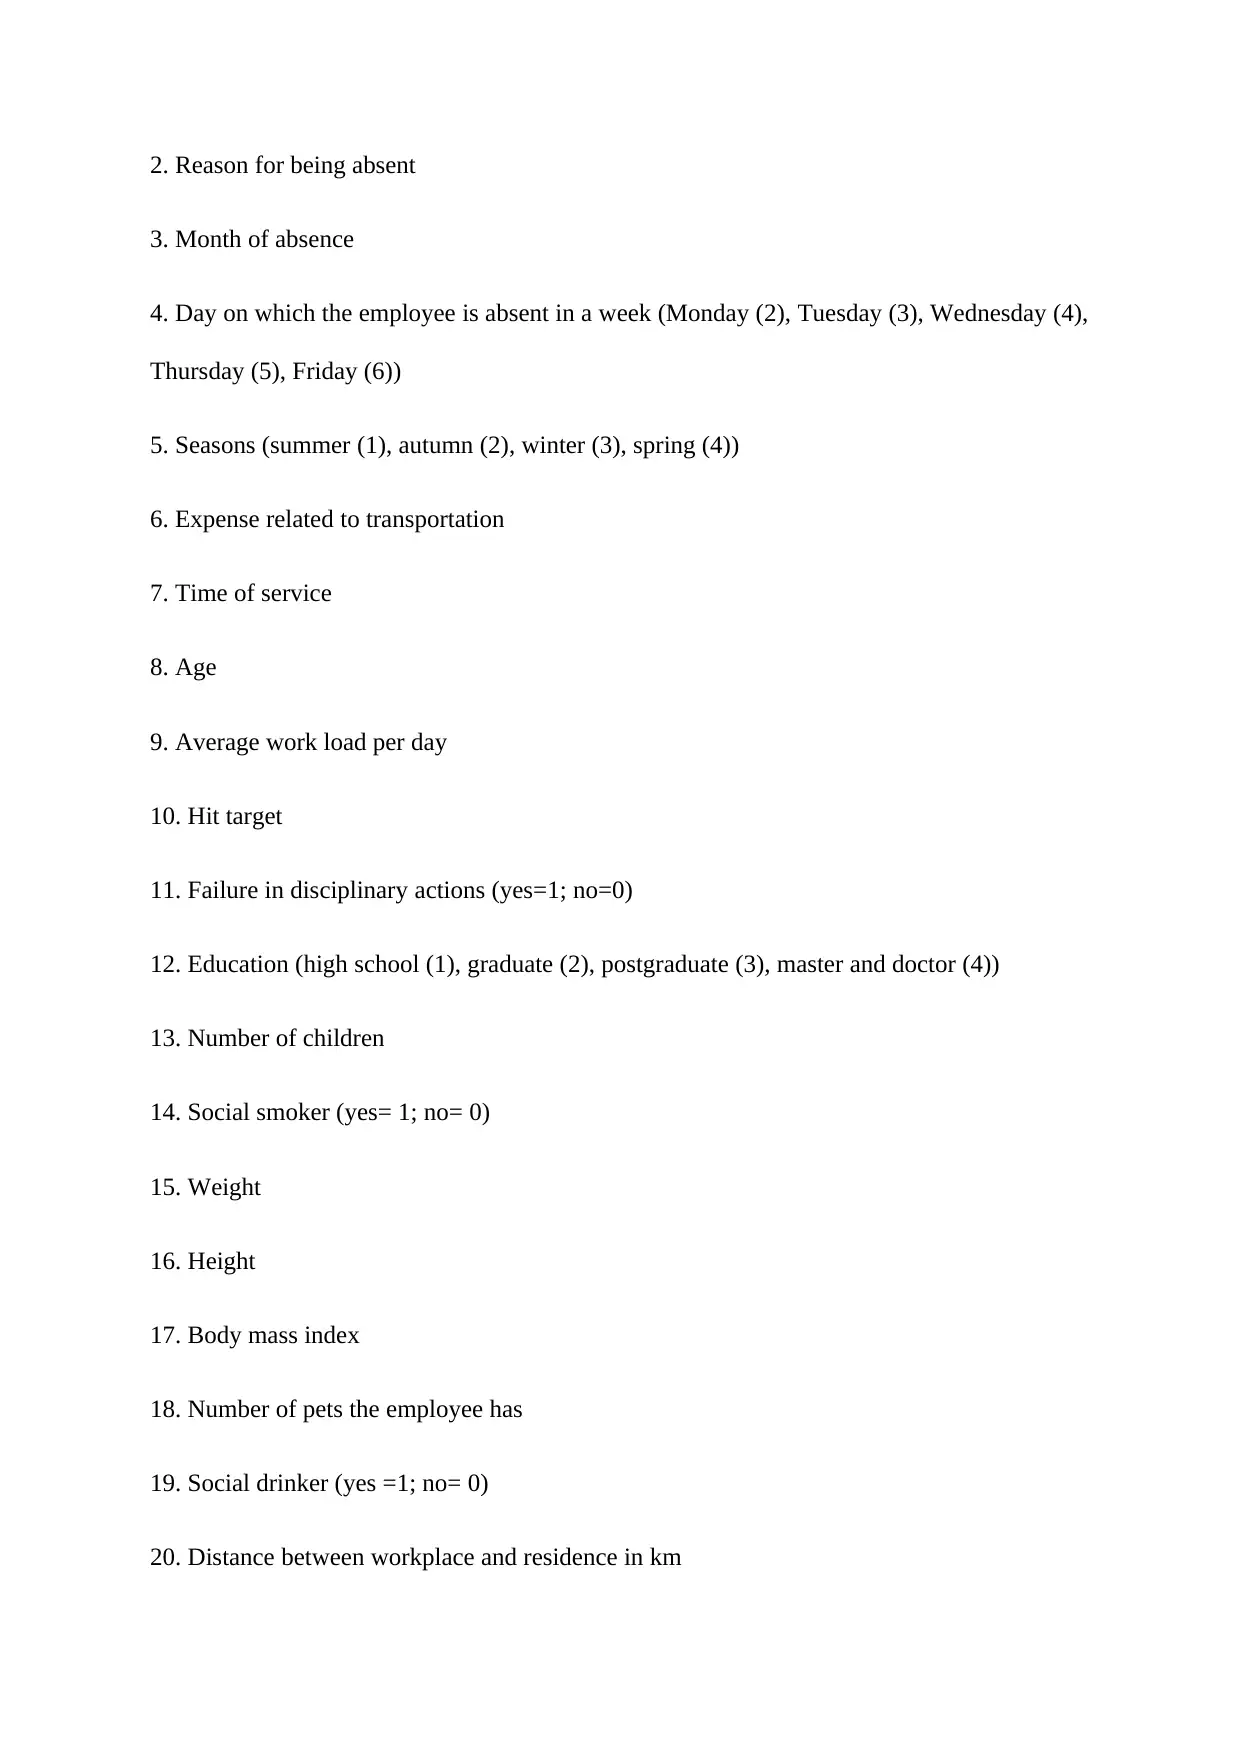
2. Reason for being absent
3. Month of absence
4. Day on which the employee is absent in a week (Monday (2), Tuesday (3), Wednesday (4),
Thursday (5), Friday (6))
5. Seasons (summer (1), autumn (2), winter (3), spring (4))
6. Expense related to transportation
7. Time of service
8. Age
9. Average work load per day
10. Hit target
11. Failure in disciplinary actions (yes=1; no=0)
12. Education (high school (1), graduate (2), postgraduate (3), master and doctor (4))
13. Number of children
14. Social smoker (yes= 1; no= 0)
15. Weight
16. Height
17. Body mass index
18. Number of pets the employee has
19. Social drinker (yes =1; no= 0)
20. Distance between workplace and residence in km
Paraphrase This Document
Need a fresh take? Get an instant paraphrase of this document with our AI Paraphraser
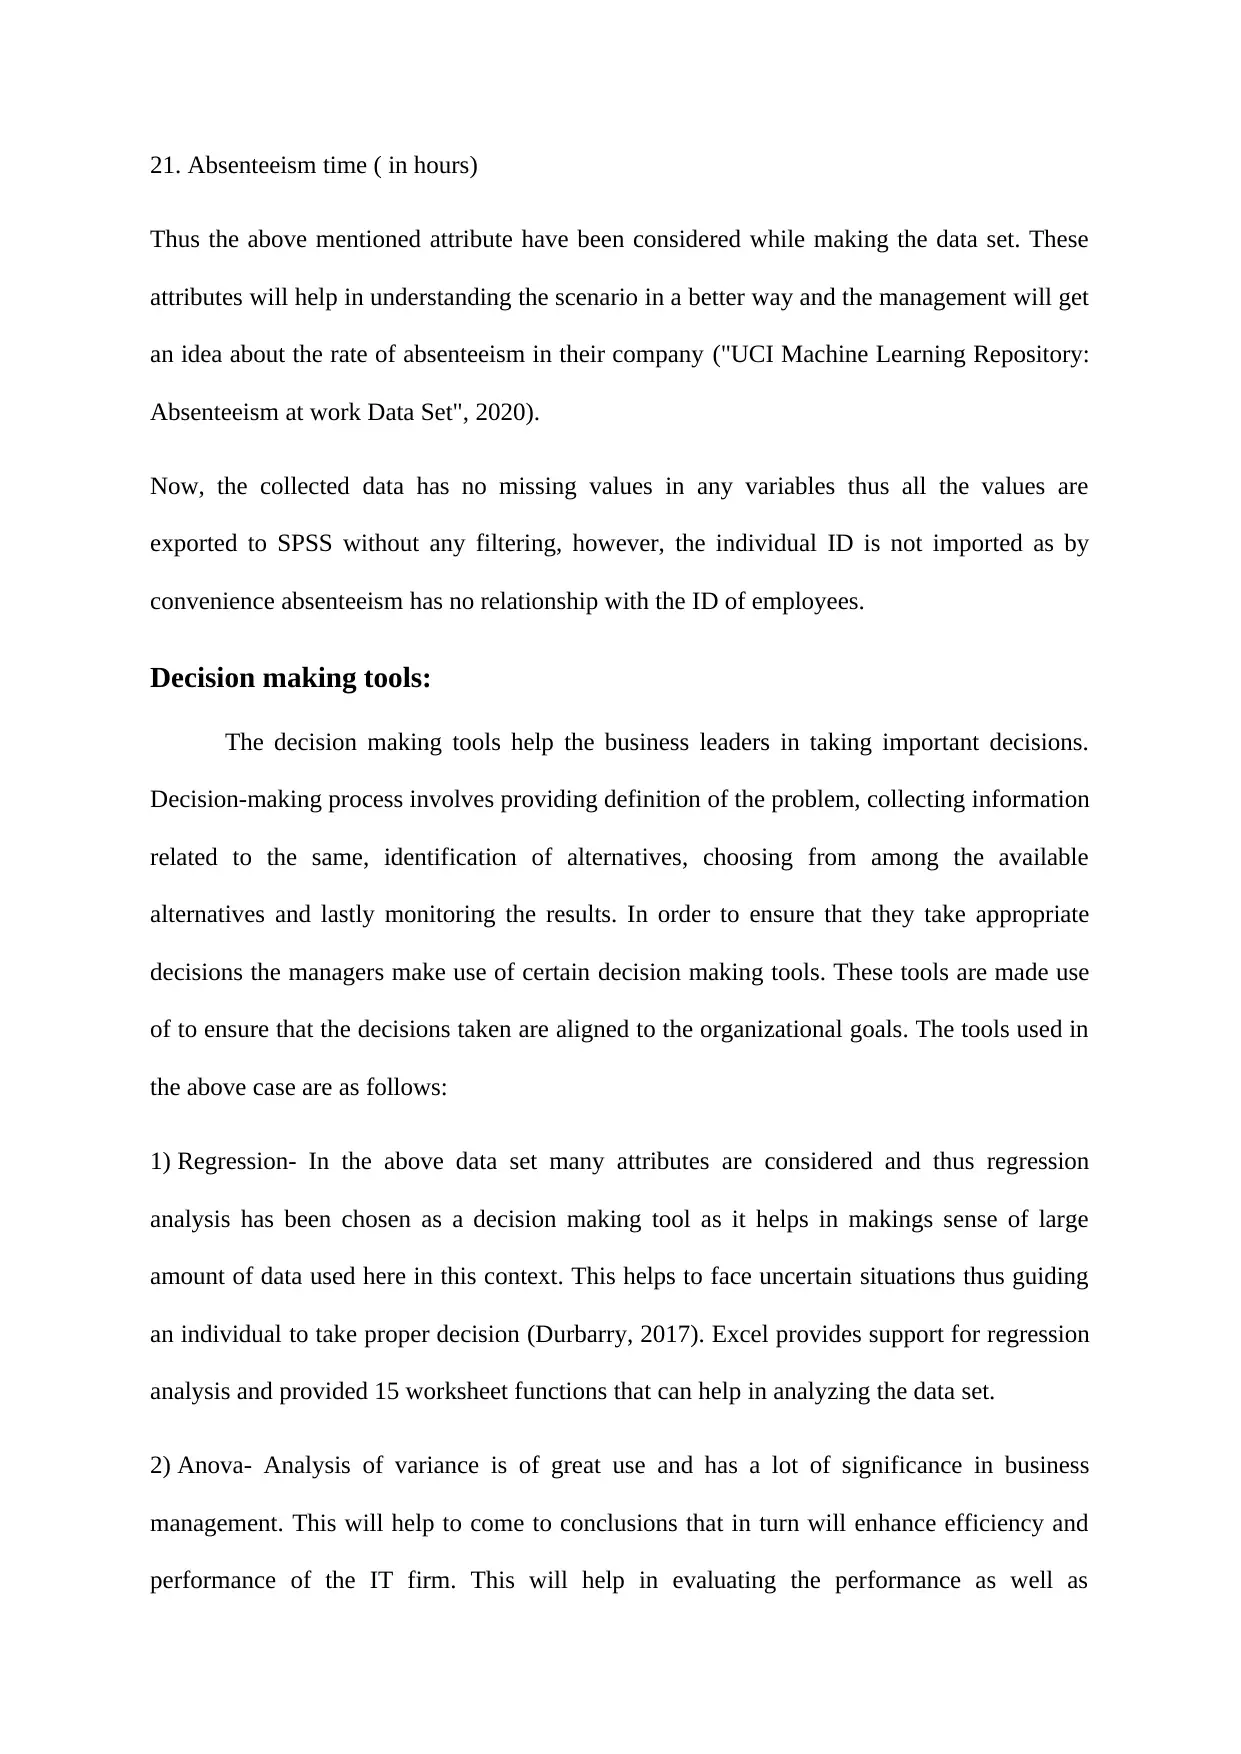
21. Absenteeism time ( in hours)
Thus the above mentioned attribute have been considered while making the data set. These
attributes will help in understanding the scenario in a better way and the management will get
an idea about the rate of absenteeism in their company ("UCI Machine Learning Repository:
Absenteeism at work Data Set", 2020).
Now, the collected data has no missing values in any variables thus all the values are
exported to SPSS without any filtering, however, the individual ID is not imported as by
convenience absenteeism has no relationship with the ID of employees.
Decision making tools:
The decision making tools help the business leaders in taking important decisions.
Decision-making process involves providing definition of the problem, collecting information
related to the same, identification of alternatives, choosing from among the available
alternatives and lastly monitoring the results. In order to ensure that they take appropriate
decisions the managers make use of certain decision making tools. These tools are made use
of to ensure that the decisions taken are aligned to the organizational goals. The tools used in
the above case are as follows:
1) Regression- In the above data set many attributes are considered and thus regression
analysis has been chosen as a decision making tool as it helps in makings sense of large
amount of data used here in this context. This helps to face uncertain situations thus guiding
an individual to take proper decision (Durbarry, 2017). Excel provides support for regression
analysis and provided 15 worksheet functions that can help in analyzing the data set.
2) Anova- Analysis of variance is of great use and has a lot of significance in business
management. This will help to come to conclusions that in turn will enhance efficiency and
performance of the IT firm. This will help in evaluating the performance as well as
implementing certain remedial actions against weaker areas of the business (Ong & Puteh,
2017).
3) Pareto analysis- This will help to identify the changes that need to be done for increasing
the enthusiasm of the employees. According to this analysis 20% of the factors are frequent
contributors to almost 80% of the growth of the company. In this context it can be used to
find out the characteristic of the employees those who take leave on a frequent basis.
Now, above three decision making tools are used by SPSS to analyse the data and extract key
findings related to absenteeism that will help to understand the significant factors for
absenteeism as specified earlier in problem description.
Regression analysis:
Now, linear regression analysis performed to see the relationship between the target
variable absenteeism time in hours and other variables. The backward linear method is
applied to find the most significant variables that contributes towards critical change of
absenteeism hours. In the backward linear multivariate regression the variable with the
highest p value over 0.05 (the chosen significance level) is removed in each step until all the
variables have the significance value less than 0.05 (Astivia & Zumbo, 2019).
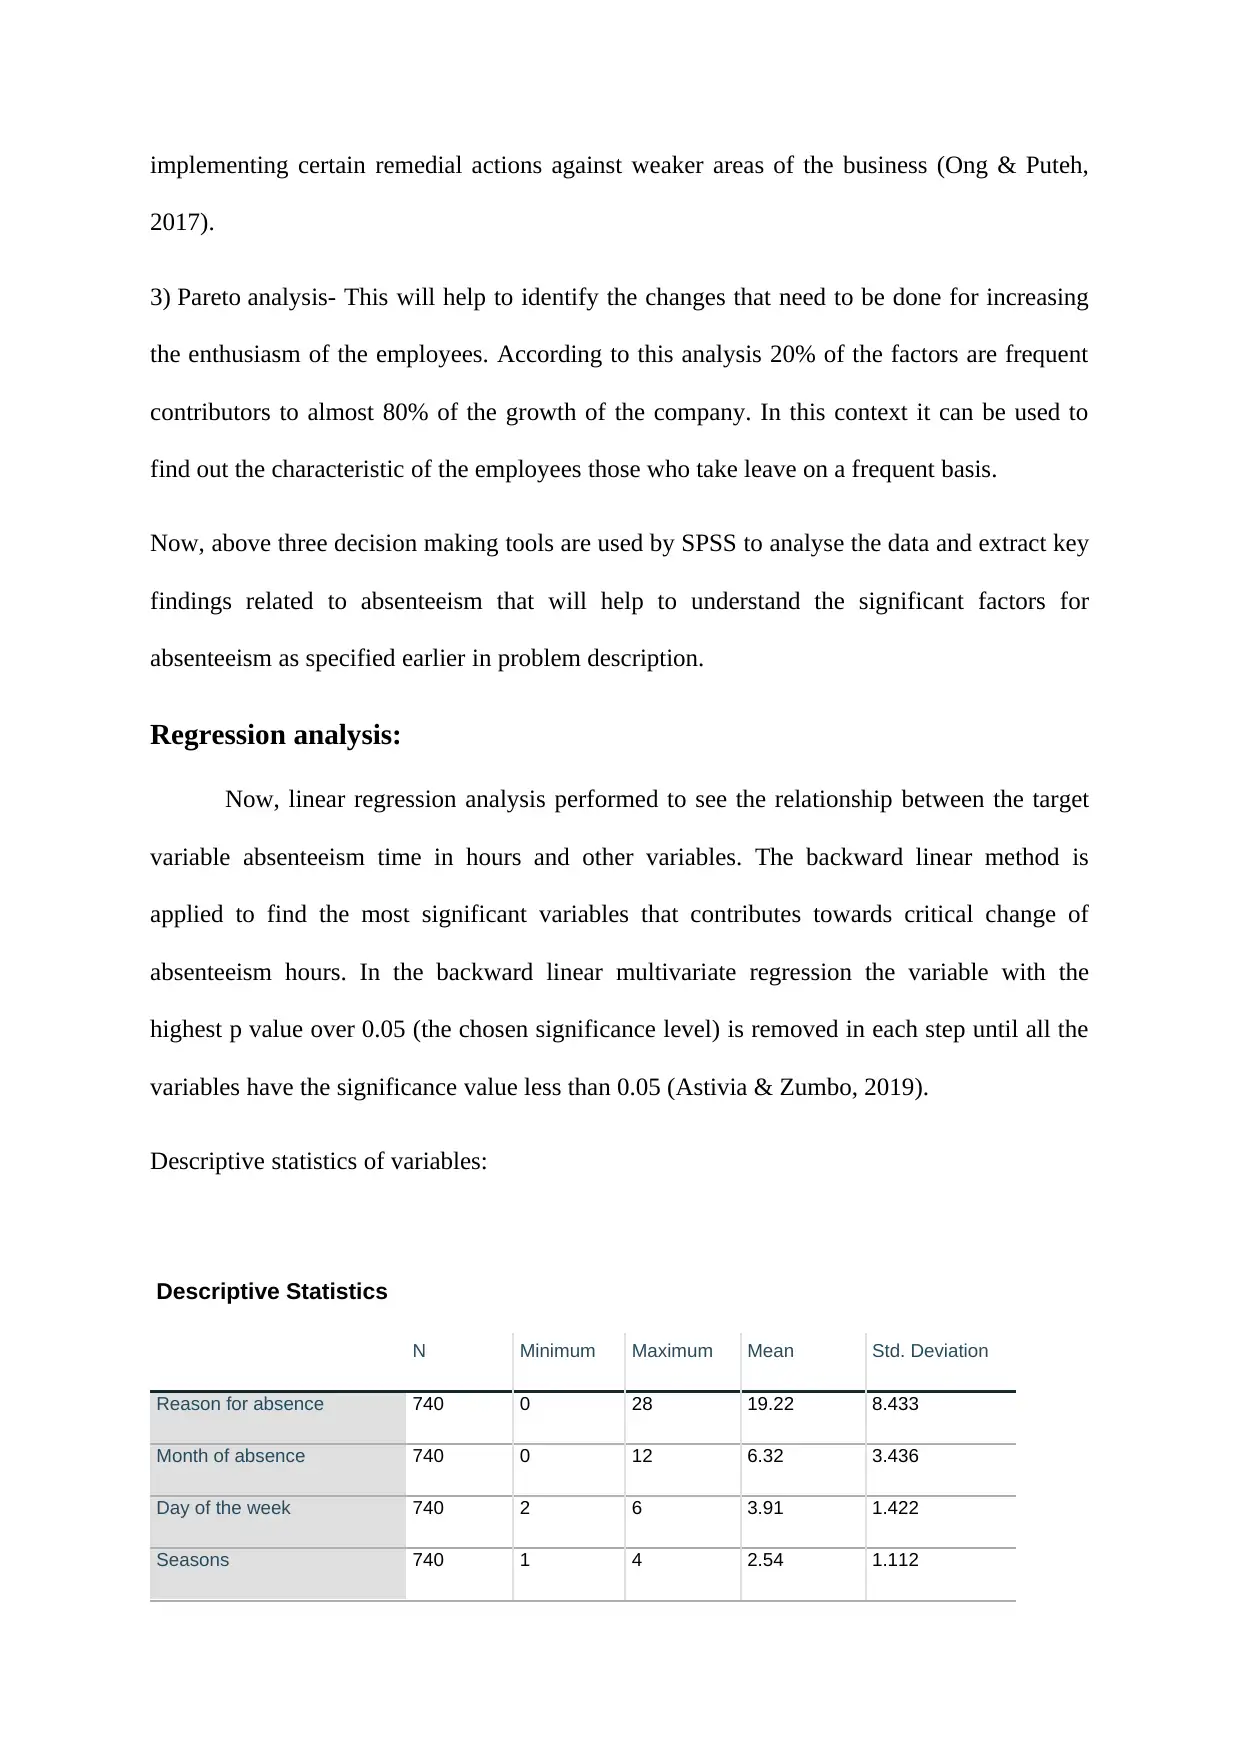
Descriptive statistics of variables:
Descriptive Statistics
N Minimum Maximum Mean Std. Deviation
Reason for absence 740 0 28 19.22 8.433
Month of absence 740 0 12 6.32 3.436
Day of the week 740 2 6 3.91 1.422
Seasons 740 1 4 2.54 1.112
2017).
3) Pareto analysis- This will help to identify the changes that need to be done for increasing
the enthusiasm of the employees. According to this analysis 20% of the factors are frequent
contributors to almost 80% of the growth of the company. In this context it can be used to
find out the characteristic of the employees those who take leave on a frequent basis.
Now, above three decision making tools are used by SPSS to analyse the data and extract key
findings related to absenteeism that will help to understand the significant factors for
absenteeism as specified earlier in problem description.
Regression analysis:
Now, linear regression analysis performed to see the relationship between the target
variable absenteeism time in hours and other variables. The backward linear method is
applied to find the most significant variables that contributes towards critical change of
absenteeism hours. In the backward linear multivariate regression the variable with the
highest p value over 0.05 (the chosen significance level) is removed in each step until all the
variables have the significance value less than 0.05 (Astivia & Zumbo, 2019).
Descriptive statistics of variables:
Descriptive Statistics
N Minimum Maximum Mean Std. Deviation
Reason for absence 740 0 28 19.22 8.433
Month of absence 740 0 12 6.32 3.436
Day of the week 740 2 6 3.91 1.422
Seasons 740 1 4 2.54 1.112
⊘ This is a preview!⊘
Do you want full access?
Subscribe today to unlock all pages.
Trusted by 1+ million students worldwide
Transportation expense 740 118 388 221.33 66.952
Distance from Residence to
Work
740 5 52 29.63 14.837
Service time 740 1 29 12.55 4.385
Age 740 27 58 36.45 6.479
Work load Average/day 740 205917 378884 271490.24 39058.116
Hit target 740 81 100 94.59 3.779
Disciplinary failure 740 0 1 .05 .226
Education 740 1 4 1.29 .673
Son 740 0 4 1.02 1.098
Social drinker 740 0 1 .57 .496
Social smoker 740 0 1 .07 .260
Pet 740 0 8 .75 1.318
Weight 740 56 108 79.04 12.883
Height 740 163 196 172.11 6.035
Body mass index 740 19 38 26.68 4.285
Absenteeism time in hours 740 0 120 6.92 13.331
Valid N (listwise) 740
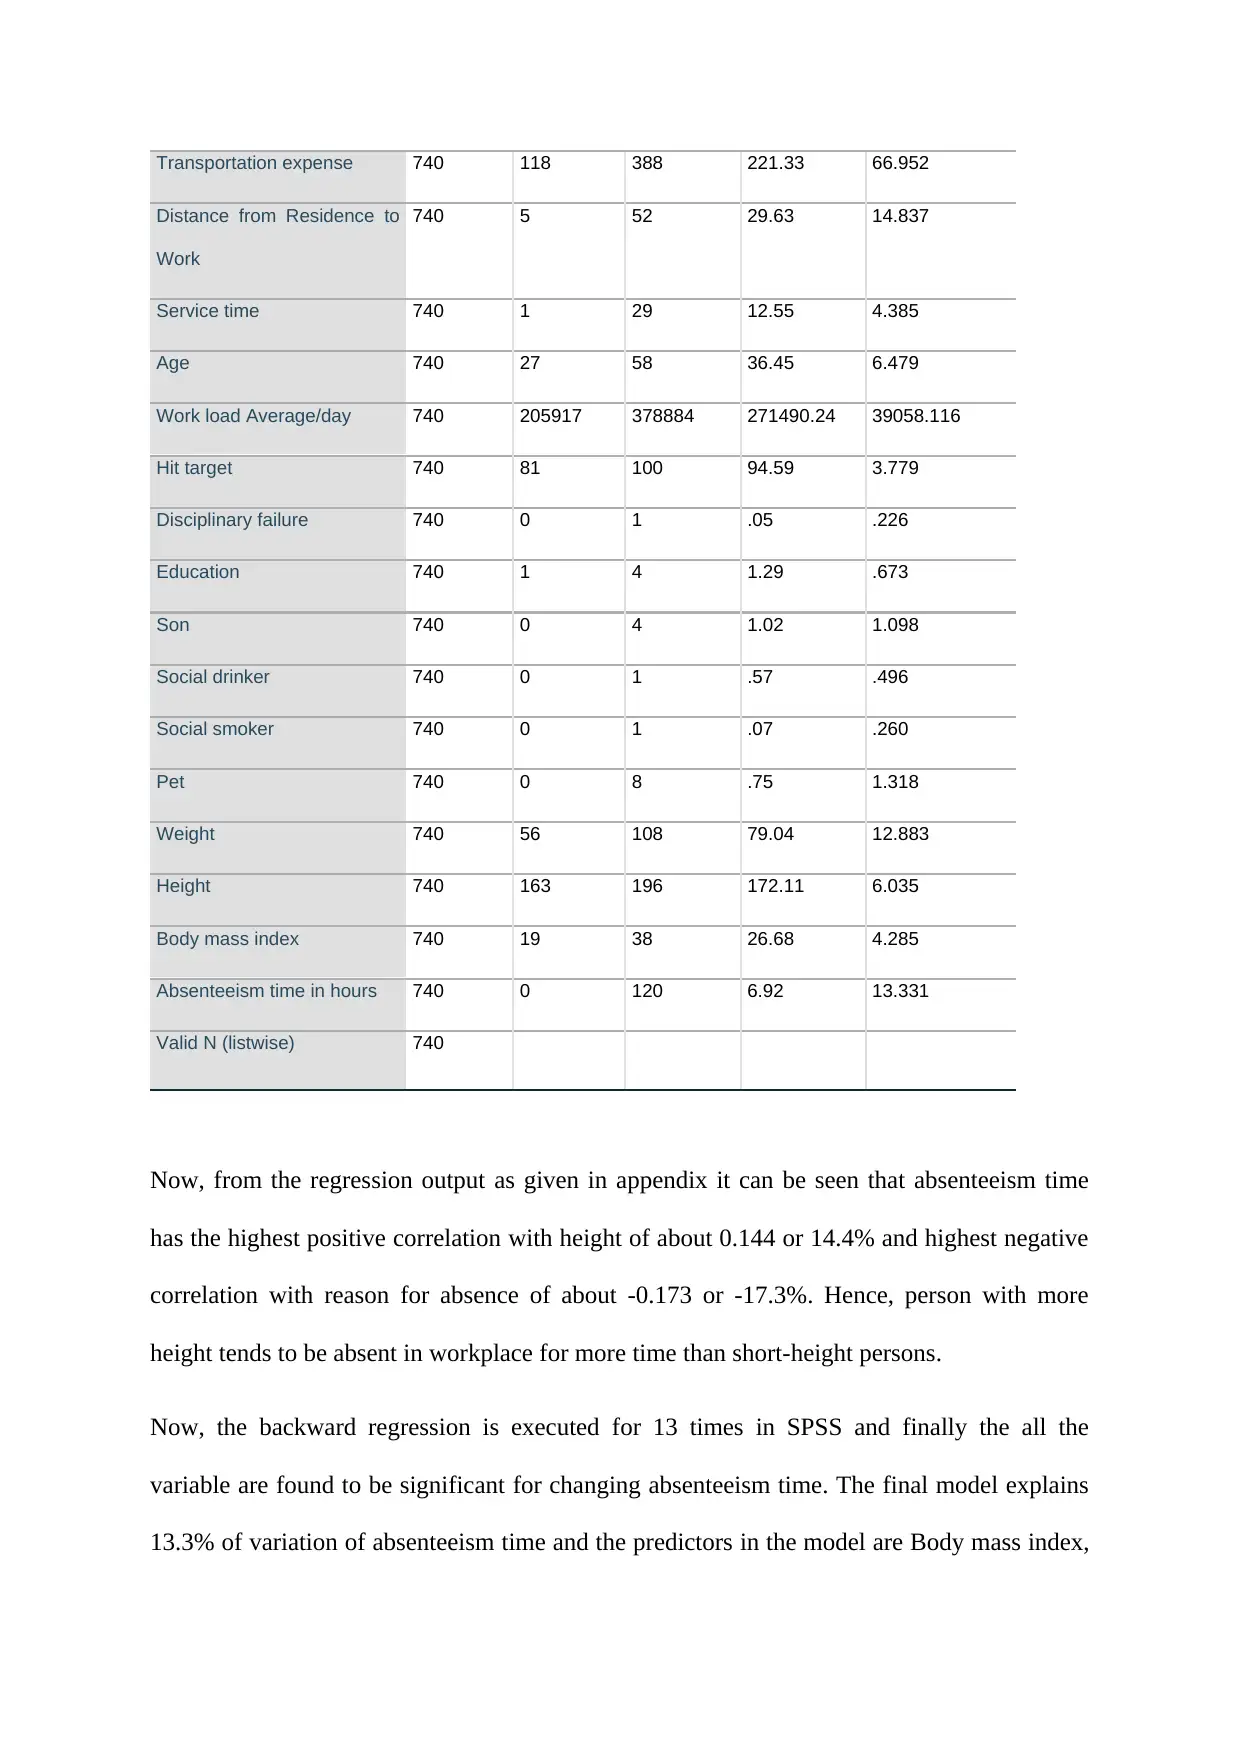
Now, from the regression output as given in appendix it can be seen that absenteeism time
has the highest positive correlation with height of about 0.144 or 14.4% and highest negative
correlation with reason for absence of about -0.173 or -17.3%. Hence, person with more
height tends to be absent in workplace for more time than short-height persons.
Now, the backward regression is executed for 13 times in SPSS and finally the all the
variable are found to be significant for changing absenteeism time. The final model explains
13.3% of variation of absenteeism time and the predictors in the model are Body mass index,
Distance from Residence to
Work
740 5 52 29.63 14.837
Service time 740 1 29 12.55 4.385
Age 740 27 58 36.45 6.479
Work load Average/day 740 205917 378884 271490.24 39058.116
Hit target 740 81 100 94.59 3.779
Disciplinary failure 740 0 1 .05 .226
Education 740 1 4 1.29 .673
Son 740 0 4 1.02 1.098
Social drinker 740 0 1 .57 .496
Social smoker 740 0 1 .07 .260
Pet 740 0 8 .75 1.318
Weight 740 56 108 79.04 12.883
Height 740 163 196 172.11 6.035
Body mass index 740 19 38 26.68 4.285
Absenteeism time in hours 740 0 120 6.92 13.331
Valid N (listwise) 740
Now, from the regression output as given in appendix it can be seen that absenteeism time
has the highest positive correlation with height of about 0.144 or 14.4% and highest negative
correlation with reason for absence of about -0.173 or -17.3%. Hence, person with more
height tends to be absent in workplace for more time than short-height persons.
Now, the backward regression is executed for 13 times in SPSS and finally the all the
variable are found to be significant for changing absenteeism time. The final model explains
13.3% of variation of absenteeism time and the predictors in the model are Body mass index,
Paraphrase This Document
Need a fresh take? Get an instant paraphrase of this document with our AI Paraphraser
Day of week, Son, Reason for absence, Disciplinary failure, Age and weight (Cronk, 2019).
Thus the final significant regression model is
Absenteeism time = 14.824 – 0.478*reason for absence -0.954*day of the week + 0.193*Age
-17.973*Disciplinary failure + 1.44*Son + 0.276*Weight -0.912*Body mass index
Now, from the regression equation it can be seen that Disciplinary failure has the highest
absolute coefficient value and thus disciplinary failure affects the change in Absenteeism
time in workplace by highest factor.
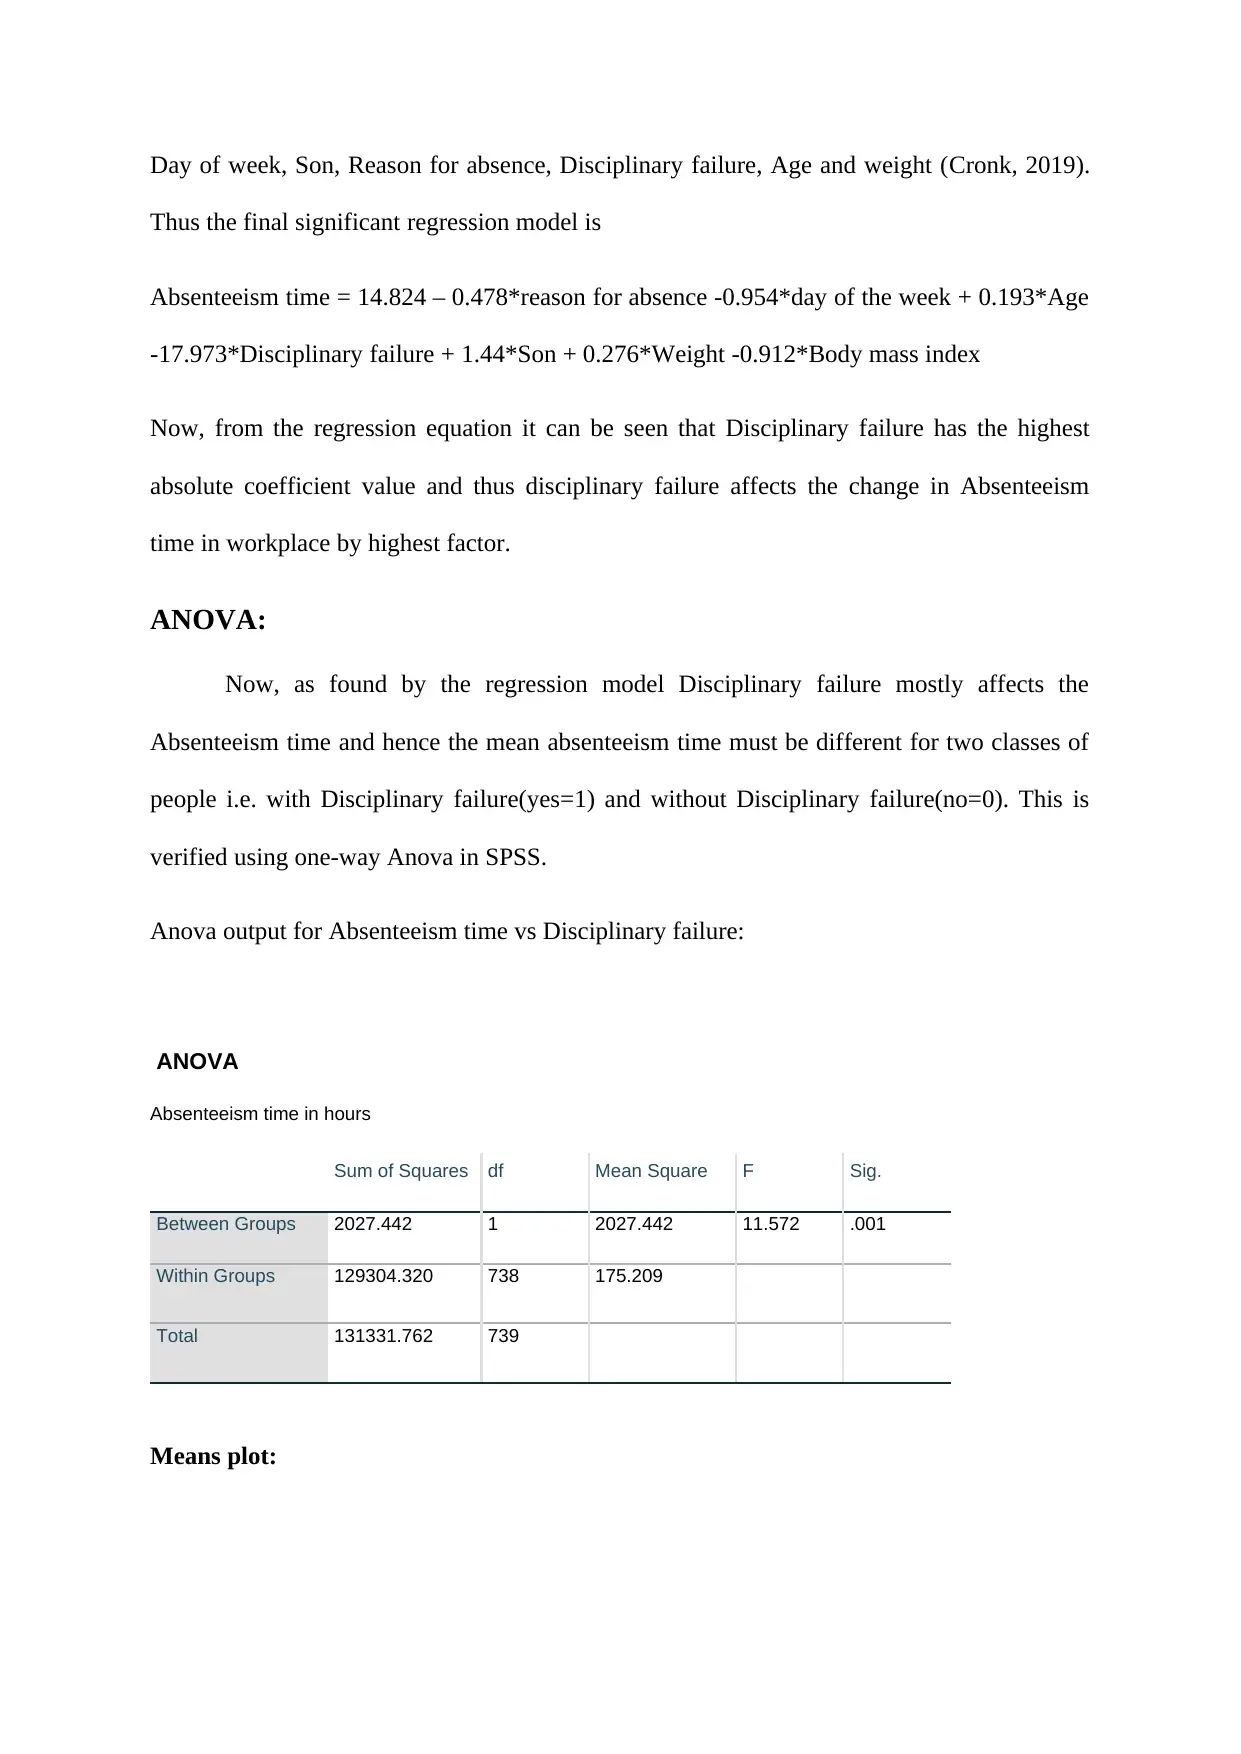
ANOVA:
Now, as found by the regression model Disciplinary failure mostly affects the
Absenteeism time and hence the mean absenteeism time must be different for two classes of
people i.e. with Disciplinary failure(yes=1) and without Disciplinary failure(no=0). This is
verified using one-way Anova in SPSS.
Anova output for Absenteeism time vs Disciplinary failure:
ANOVA
Absenteeism time in hours
Sum of Squares df Mean Square F Sig.
Between Groups 2027.442 1 2027.442 11.572 .001
Within Groups 129304.320 738 175.209
Total 131331.762 739
Means plot:
Thus the final significant regression model is
Absenteeism time = 14.824 – 0.478*reason for absence -0.954*day of the week + 0.193*Age
-17.973*Disciplinary failure + 1.44*Son + 0.276*Weight -0.912*Body mass index
Now, from the regression equation it can be seen that Disciplinary failure has the highest
absolute coefficient value and thus disciplinary failure affects the change in Absenteeism
time in workplace by highest factor.
ANOVA:
Now, as found by the regression model Disciplinary failure mostly affects the
Absenteeism time and hence the mean absenteeism time must be different for two classes of
people i.e. with Disciplinary failure(yes=1) and without Disciplinary failure(no=0). This is
verified using one-way Anova in SPSS.
Anova output for Absenteeism time vs Disciplinary failure:
ANOVA
Absenteeism time in hours
Sum of Squares df Mean Square F Sig.
Between Groups 2027.442 1 2027.442 11.572 .001
Within Groups 129304.320 738 175.209
Total 131331.762 739
Means plot:
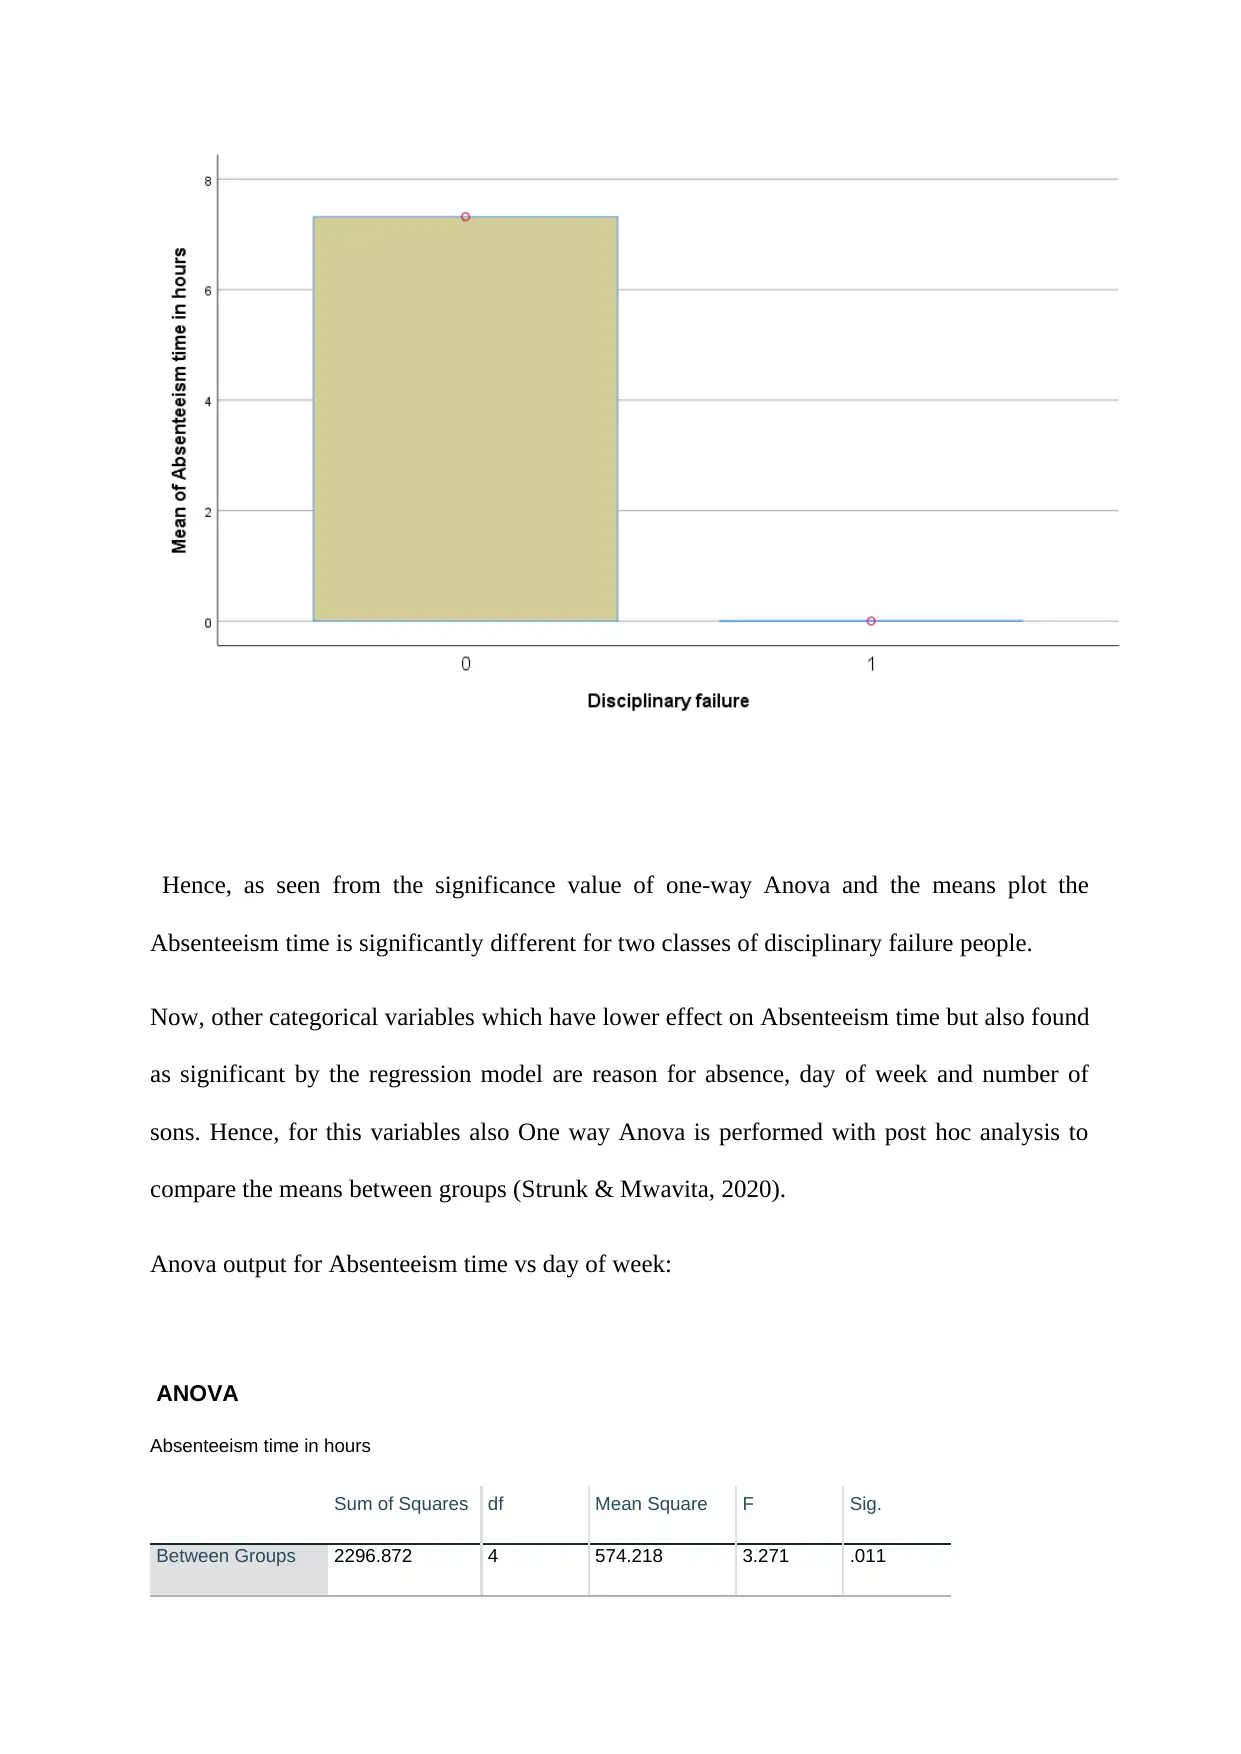
Hence, as seen from the significance value of one-way Anova and the means plot the
Absenteeism time is significantly different for two classes of disciplinary failure people.
Now, other categorical variables which have lower effect on Absenteeism time but also found
as significant by the regression model are reason for absence, day of week and number of
sons. Hence, for this variables also One way Anova is performed with post hoc analysis to
compare the means between groups (Strunk & Mwavita, 2020).
Anova output for Absenteeism time vs day of week:
ANOVA
Absenteeism time in hours
Sum of Squares df Mean Square F Sig.
Between Groups 2296.872 4 574.218 3.271 .011
⊘ This is a preview!⊘
Do you want full access?
Subscribe today to unlock all pages.
Trusted by 1+ million students worldwide
1 out of 33
Related Documents


Your All-in-One AI-Powered Toolkit for Academic Success.
+13062052269
info@desklib.com
Available 24*7 on WhatsApp / Email
![[object Object]](/_next/static/media/star-bottom.7253800d.svg)
Unlock your academic potential
Copyright © 2020–2026 A2Z Services. All Rights Reserved. Developed and managed by ZUCOL.