National Economics University Research: Employee Competence & WLB
VerifiedAdded on 2022/03/10
|17
|4045
|11
Report
AI Summary
This research proposal, conducted by students from the National Economics University, examines the relationship between employee competence transformation and work-life balance among teachers at Hoang Van Thu and Nguyen Tat Thanh High Schools. The study explores the significance of work-life balance in the teaching profession, focusing on the pressures teachers face and the need for emotional management. The research employs a quantitative methodology, including surveys and statistical analysis using SPSS, to investigate correlations between teaching content, workload, technology, health, and family relationships. The report includes demographic analysis of the participants, providing insights into age, qualifications, years of teaching, subject taught, and contract types. Findings are presented through data analysis, including charts and graphs, and the research concludes with recommendations for improving work-life balance for teachers. The study aims to address a critical societal concern and contribute to the development of effective interventions to support teachers' wellbeing.
NATIONAL ECONOMICS UNIVERSITY
--------□🕮□--------
RESEARCH PROPOSAL
THE RELATIONSHIP BETWEEN EMPLOYEE COMPETENCE
TRANSFORMATION AND WORK-LIFE BALANCE ON SCHOOL
TEACHERS HOANG VAN THU AND NGUYEN TAT THANH HIGH
SCHOOL
Students:
Nguyễn Hồng Anh - 11190263
Đào Thị Thanh Bình - 11190724
Đỗ Ngọc Khánh - 11192558
Nguyễn Khánh Linh - 11192906
Trần Hoàng Thành - 11194734
Ngô Đức Minh - 11196302
Major: Business Administration
Intake: 61
Class: HRM Skill
Supervisor: Nguyen Van Thuy Anh
Ha Noi, 01/2022
Paraphrase This Document
Need a fresh take? Get an instant paraphrase of this document with our AI Paraphraser
TABLE OF CONTENTS
ABSTRACT.................................................................................................................2
CHAPTER 1................................................................................................................3
GENERAL INTRODUCTION..................................................................................3
I. Nguyen Tat Thanh highschool............................................................................3
1. Vision..............................................................................................................3
2. Mission............................................................................................................4
II. Hoang Van Thu High school...........................................................................4
CHAPTER 2................................................................................................................5
RESEARCH METHOLOGY.....................................................................................5
1. Research Method and Design Appropriateness................................................5
2. Population and Sample....................................................................................5
3. Instrumentation................................................................................................5
4. Data Collection................................................................................................6
5. Data Analysis...................................................................................................6
CHAPTER 3................................................................................................................7
DATA ANALYSIS......................................................................................................7
1. Demographic analysis......................................................................................7
1.1. Age...............................................................................................................7
1.2. Education and training qualifications...........................................................8
1.3. Years of teaching..........................................................................................8
1.4. Subject..........................................................................................................9
1.5. Contract......................................................................................................10
2. Quantitative analysis......................................................................................10
2.1. Correlation of Teaching Content and Workload.........................................11
2.2. Correlation of Technology and Workload..................................................11
2.3. Correlation of Workload and Health..........................................................12
2.4. Correlation of Health and Family Relationship..........................................12
CONCLUSION& RECOMMENDATION.............................................................14
REFERENCES..........................................................................................................16
1
ABSTRACT
Work-Life Balance Center is a concept that emerged in the 1980s and is
defined as having a little separation between work and play. In other words, it
involves balancing your career with aspects of your life such as family, friends, or
personal interests. Currently, creating a balance in work and life is something
everyone wants, but how to achieve it, not everyone knows.
For each different profession, the job characteristics are also different, but each
person's work pressure is there. In this article, our group refers to the teaching
profession group.
When it comes to "teacher", people often think of the image of a perfect,
exemplary person who is a "guideline" for others. However, we forget that they are
just like us, have life, have pressure every day, even the pressure they receive is
greater than other professions.
Therefore, a work-life balance for each teacher is essential. They have to learn
how to manage their emotions, contribute to reducing negative behaviors in schools,
thereby balancing their personal lives. A few years back, work-life balance for
teachers became a major concern for society. However, there has not been a single
project or study that has had a major impact on this topic. Especially for Vietnamese
teachers, direct and strong intervention is needed to solve this situation
2
⊘ This is a preview!⊘
Do you want full access?
Subscribe today to unlock all pages.
Trusted by 1+ million students worldwide
CHAPTER 1
GENERAL INTRODUCTION
I. Nguyen Tat Thanh highschool
Nguyen Tat Thanh High School was established in 1989 through the stages, the
school was built and developed increasingly in terms of school size, number of
teachers, students, training quality, affirming its position to contribute to the
development of education and training in Yen Bai province
Currently, the school has:
- 01 Principal
- 02 Vice Principals
In addition, there are 68 teachers belonging to Association School Council,
Student Advisory Group, People's Inspection Committee Having an independent
branch with 50 party members, Trade Union, and other social organizations such as
the Red Cross, the Parents' Association. There are three specialized groups: Math -
Physics, Literature - History, Sinh - Chemistry, and office groups.
The organizational structure of the school is clear, in accordance with the
regulations, in accordance with the actual situation, and has been concretized in the
regulations on the organization and operation of the school.
The departments operate independently, effectively creating concentrated
power for the school apparatus to function well.
1. Vision
To be a school with high educational quality, prestige, and reputation of the
province and region that every student always desires chooses to study and practice;
where teachers and students always aspire to rise and develop their own capacity; By
2022, it will be in the group of 35 specialized high schools with the highest
educational quality in the country.
3
Paraphrase This Document
Need a fresh take? Get an instant paraphrase of this document with our AI Paraphraser
2. Mission
To create a comprehensive and high-quality educational environment for
students to develop their talents and promote creativity in order to create a source for
prestigious Vietnamese and international universities to meet the aspirations of
students. people, meet the development requirements of the locality, the country, and
international integration.
II. Hoang Van Thu High school
Hoang Van Thu High school is a public high school established in 1947. After
more than 40 years of construction and growth, with the contributions of many
generations of teachers and students, Hoang Van Thu High School has continuously
grown. From 8 simple classrooms during the anti-American war, the school now has
spacious facilities with over 30 classrooms, many modern multi-function rooms to
meet the increasing learning needs of students. The school's teachers are teachers with
solid professional qualifications, experience in teaching, full of enthusiasm for the
profession, and constantly learning, improving ethical quality and professional
capacity.
Currently, the school has:
- 1 Principal
- 1 Vice Principal
In addition, there are 53 teachers belonging to Association School Council,
Student Advisory Group, People's Inspection Committee Having an independent
branch with 39 party members, Trade Union, and other social organizations such as
the Red Cross, the Parents' Association.
4
CHAPTER 2
RESEARCH METHOLOGY
1. Research Method and Design Appropriateness
Because the study's population was regarded as big, and the resultant necessary
sample was likewise too large for a qualitative study, quantitative research was the
most acceptable approach for this study. Because it is less resource demanding, the
quantitative approach might be regarded as more efficient than the qualitative
empirical(Allwood, 2012). Furthermore, the findings of this quantitative research
approach may be generalizable to the public.
A quantitative study can employ a variety of research designs. This study would use
either a causal-comparative or a correlational strategy. The goal of correlational
research is to determine the degree and direction of a link between two
variables(Raines, 2013). Correlation is defined as the study of naturally existing
associations that are not manipulated (Raines, 2013). The goal of correlational
research was to see how closely changes in one variable corresponded with changes in
one or more other variables.
The experimental research design was another viable research strategy for this
investigation. In experimental research, individuals are randomly assigned to
experimental and control groups, and one or more variables are modified to identify
cause and effect (Brown and Melamed, 1990). There was no attempt to alter the
independent variable to infer causation in this study. As a result, the experimental
design was not the best choice for this research.
2. Population and Sample
The population size was 50 participants. From December 2021 to January 2022, the
research population comprised all Hoang Van Thu high school and Nguyen Tat Thanh
high school…. Because of the accessibility of respondents' data, cost, and time
constraints that limited the scope of the study to only two schools, one is a normal
high school and the other is a specialized school. Based on the organizational
structure, history, and track record of the two schools, our team believes that the two
schools will be typical representatives of the learning environment in Vietnam.
5
⊘ This is a preview!⊘
Do you want full access?
Subscribe today to unlock all pages.
Trusted by 1+ million students worldwide
3. Instrumentation
Each item in the instrument was a declarative sentence with answer alternatives that
indicated different degrees of agreement with the proposition. Strongly Disagree,
Disagree, Neither Agree nor Disagree, Agree and Strongly Agree were the response
options for service quality aspects. These ratings were determined using a numerical
scale of 1 to 5, with 1 denoting "strongly disagree," 2 denoting "disagree," 3 denoting
"neither agree nor disagree," 4 denoting "agree," and 5 denoting "strongly agree."
4. Data Collection
In this study, the online questionnaire survey will be used (Google form). Cost
savings, time savings, and convenience are all advantages of doing online surveys.
Respondents may conduct online surveys anytime they want and from wherever they
are, making them feel more at ease. Another advantage of online surveys is their reach
and scalability(Participation and factors associated with late or non‐response to an
online survey in primary care - Aerny‐Perreten - 2015 - Journal of Evaluation in
Clinical Practice - Wiley Online Library, no date)
We will be sending links to teachers at both schools through personal relationships. In
addition, we will send the survey link through the school's confession pages to the
teachers.
The survey instrument was submitted to the Google form of the researcher’s Gmail.
The survey URL was included as a hyperlink in the email content. The invitation letter
and survey links were emailed to the chosen research participants. The survey was
immediately routed to a webpage where potential responders may view it. After
signing the consent form, participants will be allowed to take the survey.
5. Data Analysis
The collected data were entered into a Microsoft Excel spreadsheet. The data was then
uploaded and analyzed by using IBM® SPSS version 20. The data in this study were
described using descriptive analysis in terms of frequencies, proportions, means, and
standard deviations. The IBM® SPSS descriptive statistics frequency option was used
to check for missing and anomalous values in the gathered data. Scholars can use
inferential statistics to test hypotheses regarding variable connections and draw
conclusions based on statistical evidence(Misra and Mishra, 2020). Inferential
statistics were used in this study to deeply analyze data and observations to make
predictions.
Finally, using IBM® SPSS, frequency distributions were produced to visually analyze
the presence of homoscedasticity in the data:
6
Paraphrase This Document
Need a fresh take? Get an instant paraphrase of this document with our AI Paraphraser
CHAPTER 3
DATA ANALYSIS
1. Demographic analysis
1.1. Age
16%
33%
31%
18%
2%
Table 3.1: Age
Dưới 25 tuổi Từ 26 đến 35 tuổi Từ 36 đến 45 tuổi
Từ 46 đến 55 tuổi Trên 56 tuổi
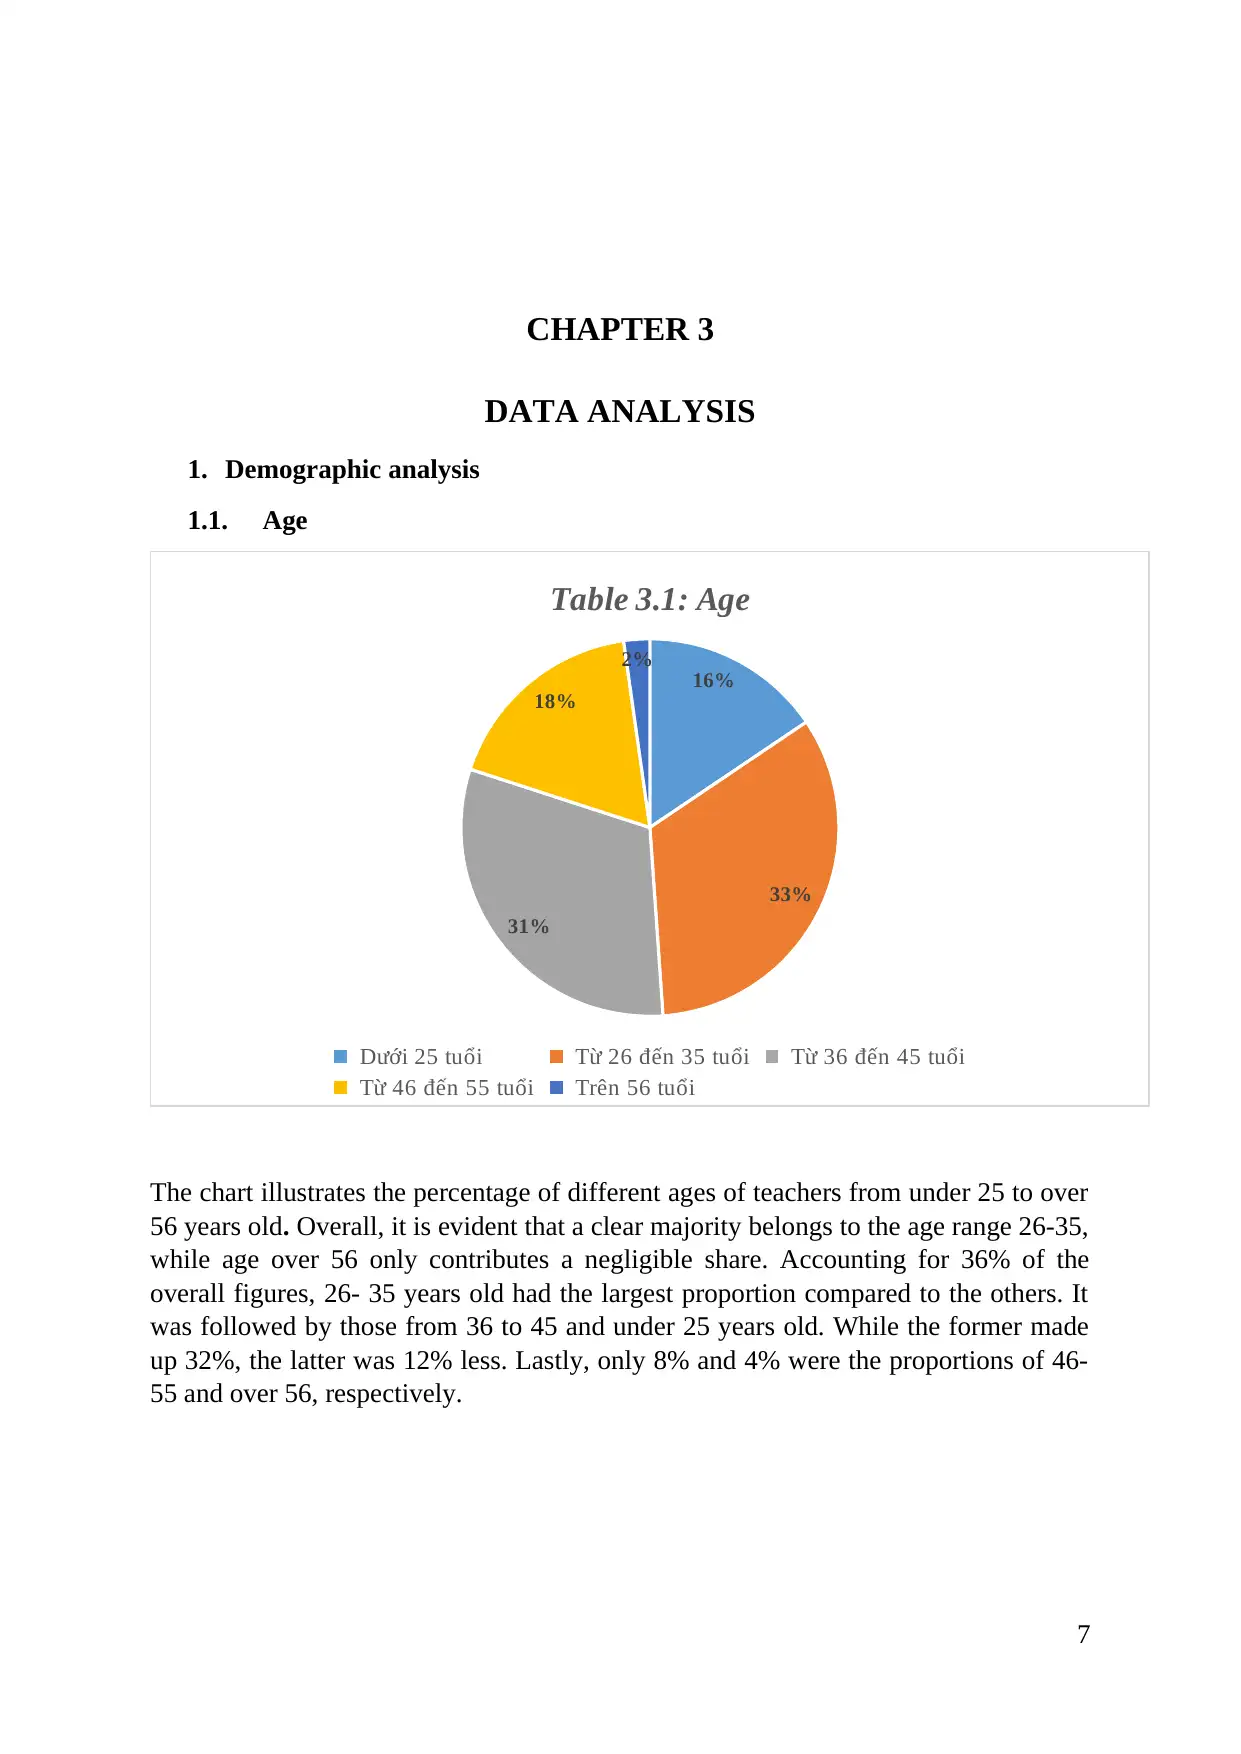
The chart illustrates the percentage of different ages of teachers from under 25 to over
56 years old. Overall, it is evident that a clear majority belongs to the age range 26-35,
while age over 56 only contributes a negligible share. Accounting for 36% of the
overall figures, 26- 35 years old had the largest proportion compared to the others. It
was followed by those from 36 to 45 and under 25 years old. While the former made
up 32%, the latter was 12% less. Lastly, only 8% and 4% were the proportions of 46-
55 and over 56, respectively.
7
DATA ANALYSIS
1. Demographic analysis
1.1. Age
16%
33%
31%
18%
2%
Table 3.1: Age
Dưới 25 tuổi Từ 26 đến 35 tuổi Từ 36 đến 45 tuổi
Từ 46 đến 55 tuổi Trên 56 tuổi
The chart illustrates the percentage of different ages of teachers from under 25 to over
56 years old. Overall, it is evident that a clear majority belongs to the age range 26-35,
while age over 56 only contributes a negligible share. Accounting for 36% of the
overall figures, 26- 35 years old had the largest proportion compared to the others. It
was followed by those from 36 to 45 and under 25 years old. While the former made
up 32%, the latter was 12% less. Lastly, only 8% and 4% were the proportions of 46-
55 and over 56, respectively.
7
1.2. Education and training qualifications
38%
42%
11%
9%
Table 3.2: Education Level
Cử nhân Thạc sĩ Phó Tiến sĩ Tiến sĩ
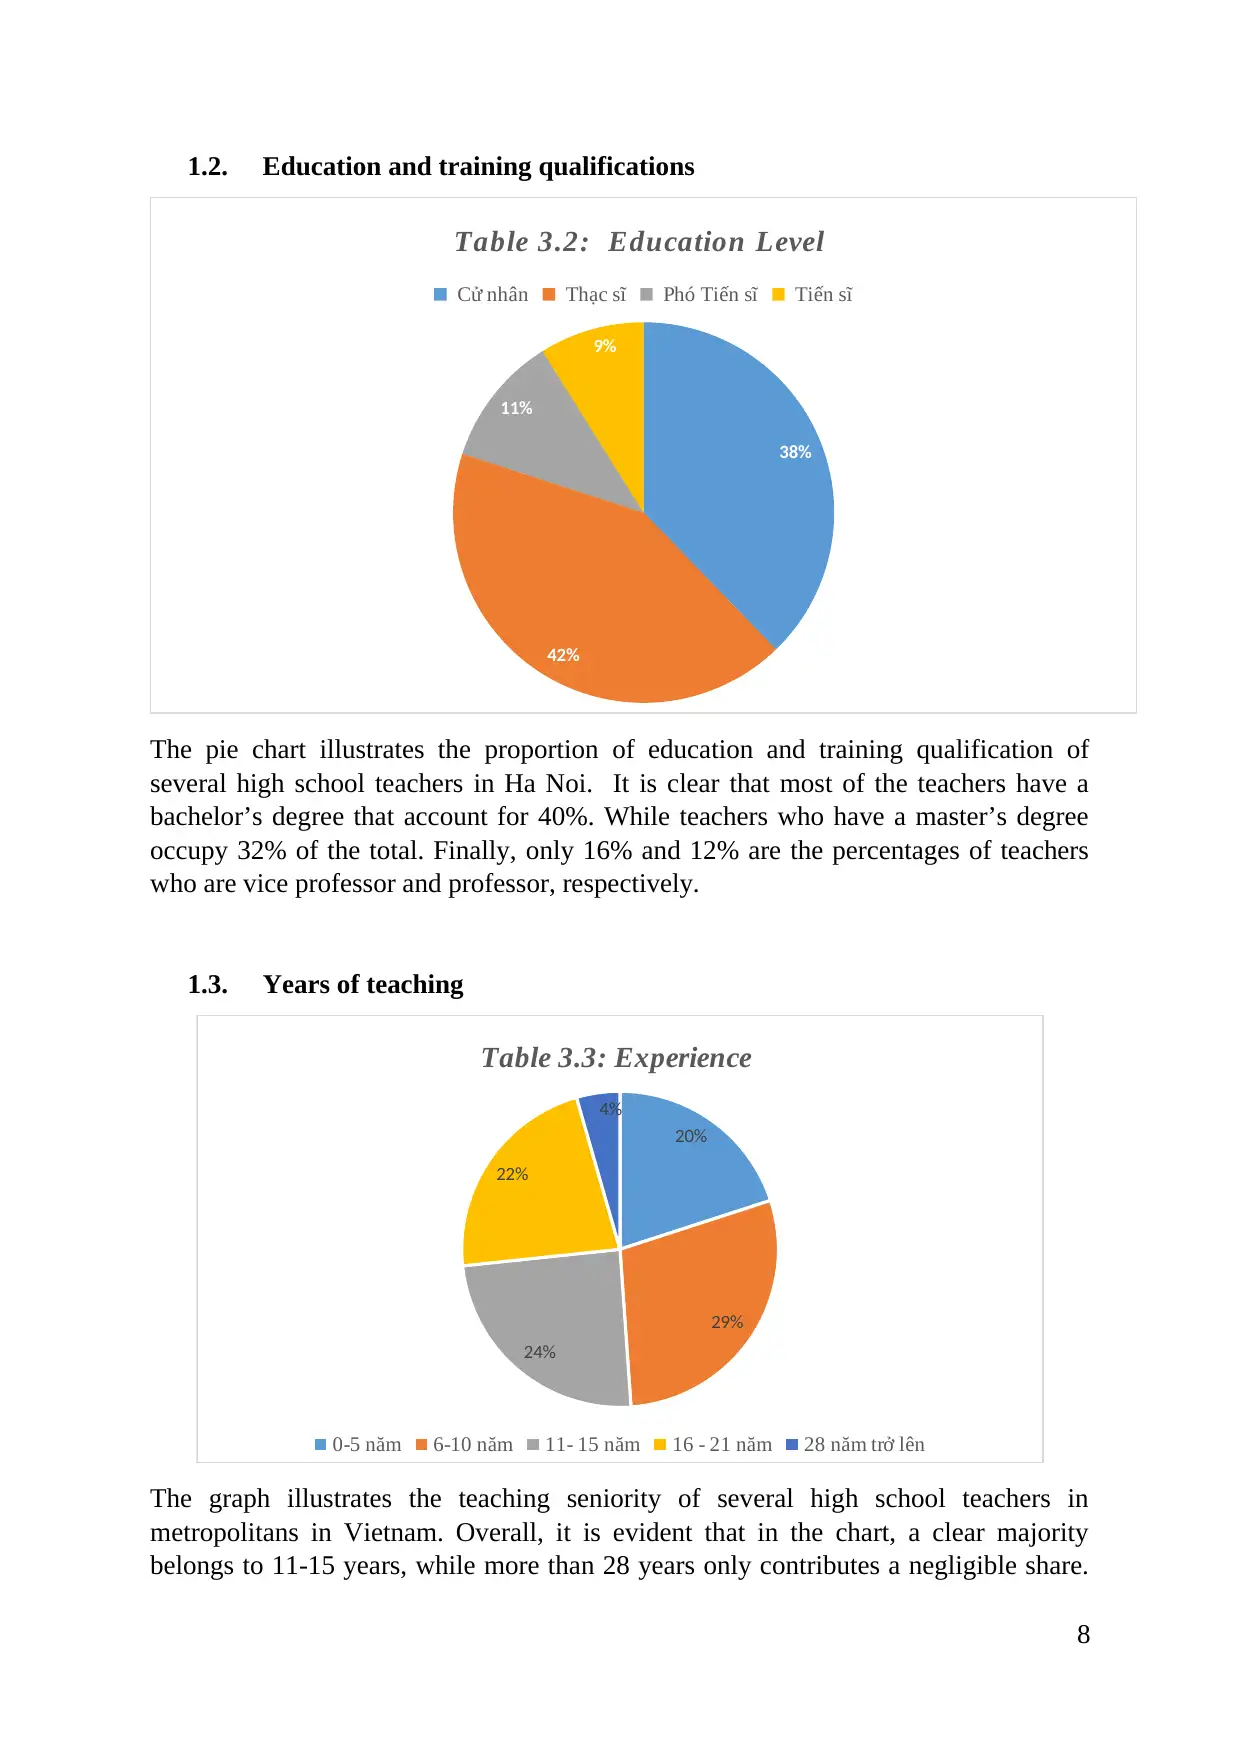
The pie chart illustrates the proportion of education and training qualification of
several high school teachers in Ha Noi. It is clear that most of the teachers have a
bachelor’s degree that account for 40%. While teachers who have a master’s degree
occupy 32% of the total. Finally, only 16% and 12% are the percentages of teachers
who are vice professor and professor, respectively.
1.3. Years of teaching
20%
29%
24%
22%
4%
Table 3.3: Experience
0-5 năm 6-10 năm 11- 15 năm 16 - 21 năm 28 năm trở lên
The graph illustrates the teaching seniority of several high school teachers in
metropolitans in Vietnam. Overall, it is evident that in the chart, a clear majority
belongs to 11-15 years, while more than 28 years only contributes a negligible share.
8
38%
42%
11%
9%
Table 3.2: Education Level
Cử nhân Thạc sĩ Phó Tiến sĩ Tiến sĩ
The pie chart illustrates the proportion of education and training qualification of
several high school teachers in Ha Noi. It is clear that most of the teachers have a
bachelor’s degree that account for 40%. While teachers who have a master’s degree
occupy 32% of the total. Finally, only 16% and 12% are the percentages of teachers
who are vice professor and professor, respectively.
1.3. Years of teaching
20%
29%
24%
22%
4%
Table 3.3: Experience
0-5 năm 6-10 năm 11- 15 năm 16 - 21 năm 28 năm trở lên
The graph illustrates the teaching seniority of several high school teachers in
metropolitans in Vietnam. Overall, it is evident that in the chart, a clear majority
belongs to 11-15 years, while more than 28 years only contributes a negligible share.
8
⊘ This is a preview!⊘
Do you want full access?
Subscribe today to unlock all pages.
Trusted by 1+ million students worldwide
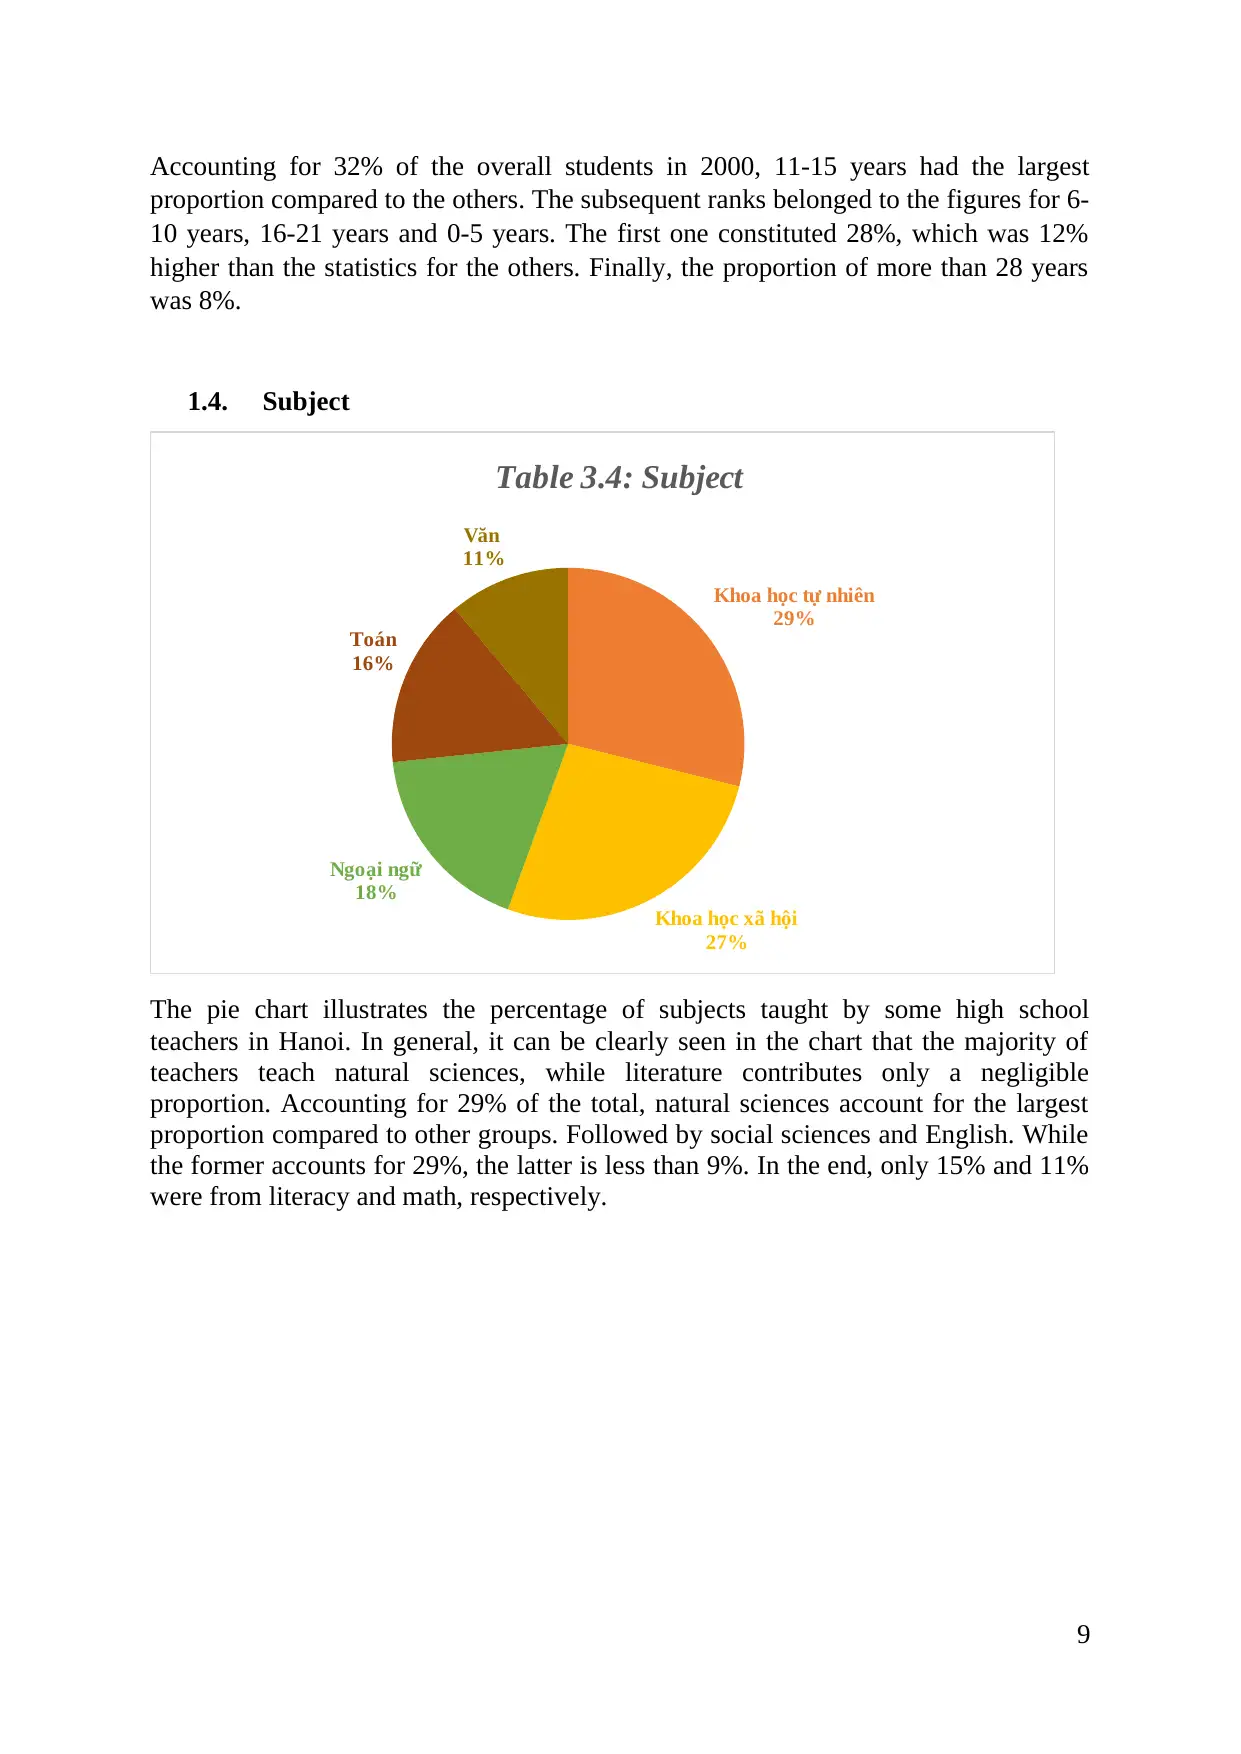
Accounting for 32% of the overall students in 2000, 11-15 years had the largest
proportion compared to the others. The subsequent ranks belonged to the figures for 6-
10 years, 16-21 years and 0-5 years. The first one constituted 28%, which was 12%
higher than the statistics for the others. Finally, the proportion of more than 28 years
was 8%.
1.4. Subject
Khoa học tự nhiên
29%
Khoa học xã hội
27%
Ngoại ngữ
18%
Toán
16%
Văn
11%
Table 3.4: Subject
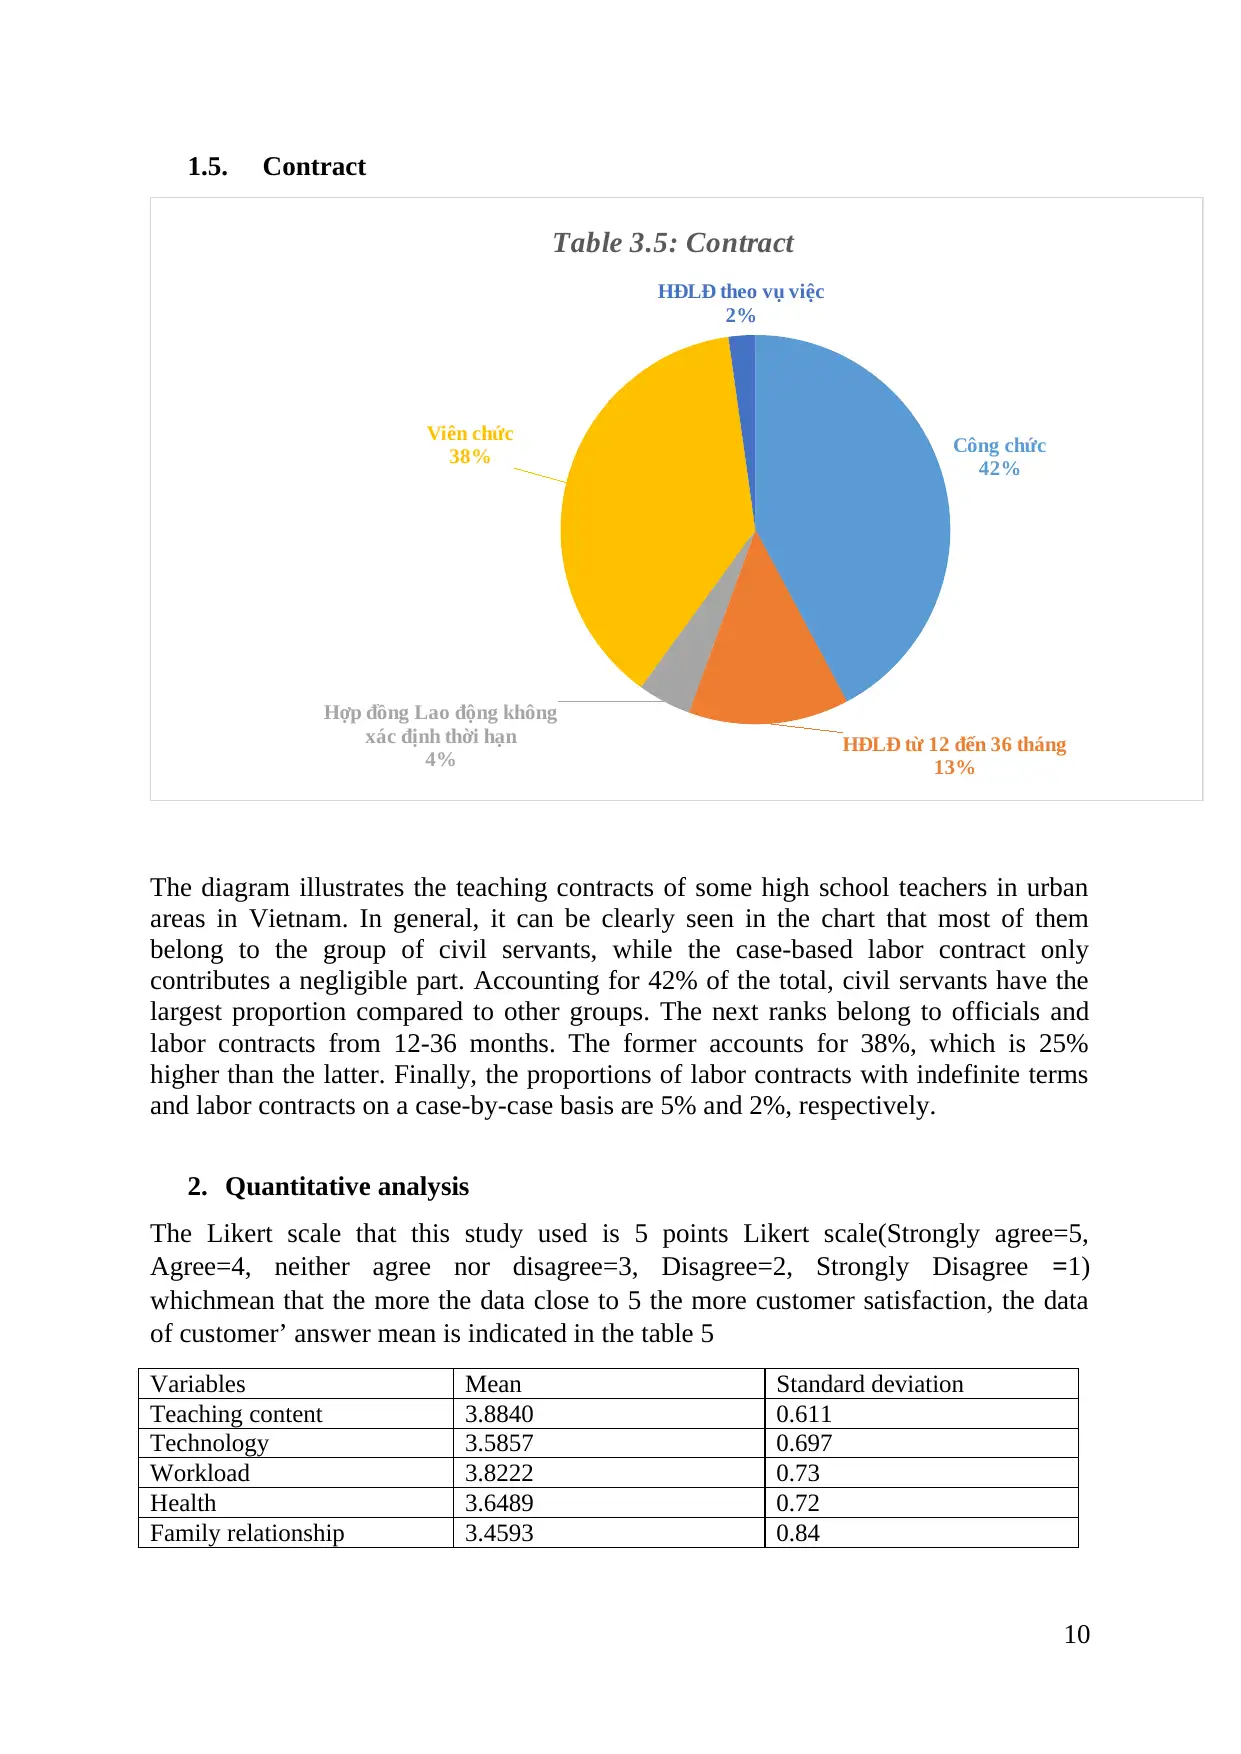
The pie chart illustrates the percentage of subjects taught by some high school
teachers in Hanoi. In general, it can be clearly seen in the chart that the majority of
teachers teach natural sciences, while literature contributes only a negligible
proportion. Accounting for 29% of the total, natural sciences account for the largest
proportion compared to other groups. Followed by social sciences and English. While
the former accounts for 29%, the latter is less than 9%. In the end, only 15% and 11%
were from literacy and math, respectively.
9
proportion compared to the others. The subsequent ranks belonged to the figures for 6-
10 years, 16-21 years and 0-5 years. The first one constituted 28%, which was 12%
higher than the statistics for the others. Finally, the proportion of more than 28 years
was 8%.
1.4. Subject
Khoa học tự nhiên
29%
Khoa học xã hội
27%
Ngoại ngữ
18%
Toán
16%
Văn
11%
Table 3.4: Subject
The pie chart illustrates the percentage of subjects taught by some high school
teachers in Hanoi. In general, it can be clearly seen in the chart that the majority of
teachers teach natural sciences, while literature contributes only a negligible
proportion. Accounting for 29% of the total, natural sciences account for the largest
proportion compared to other groups. Followed by social sciences and English. While
the former accounts for 29%, the latter is less than 9%. In the end, only 15% and 11%
were from literacy and math, respectively.
9
Paraphrase This Document
Need a fresh take? Get an instant paraphrase of this document with our AI Paraphraser
1.5. Contract
Công chức
42%
HĐLĐ từ 12 đến 36 tháng
13%
Hợp đồng Lao động không
xác định thời hạn
4%
Viên chức
38%
HĐLĐ theo vụ việc
2%
Table 3.5: Contract
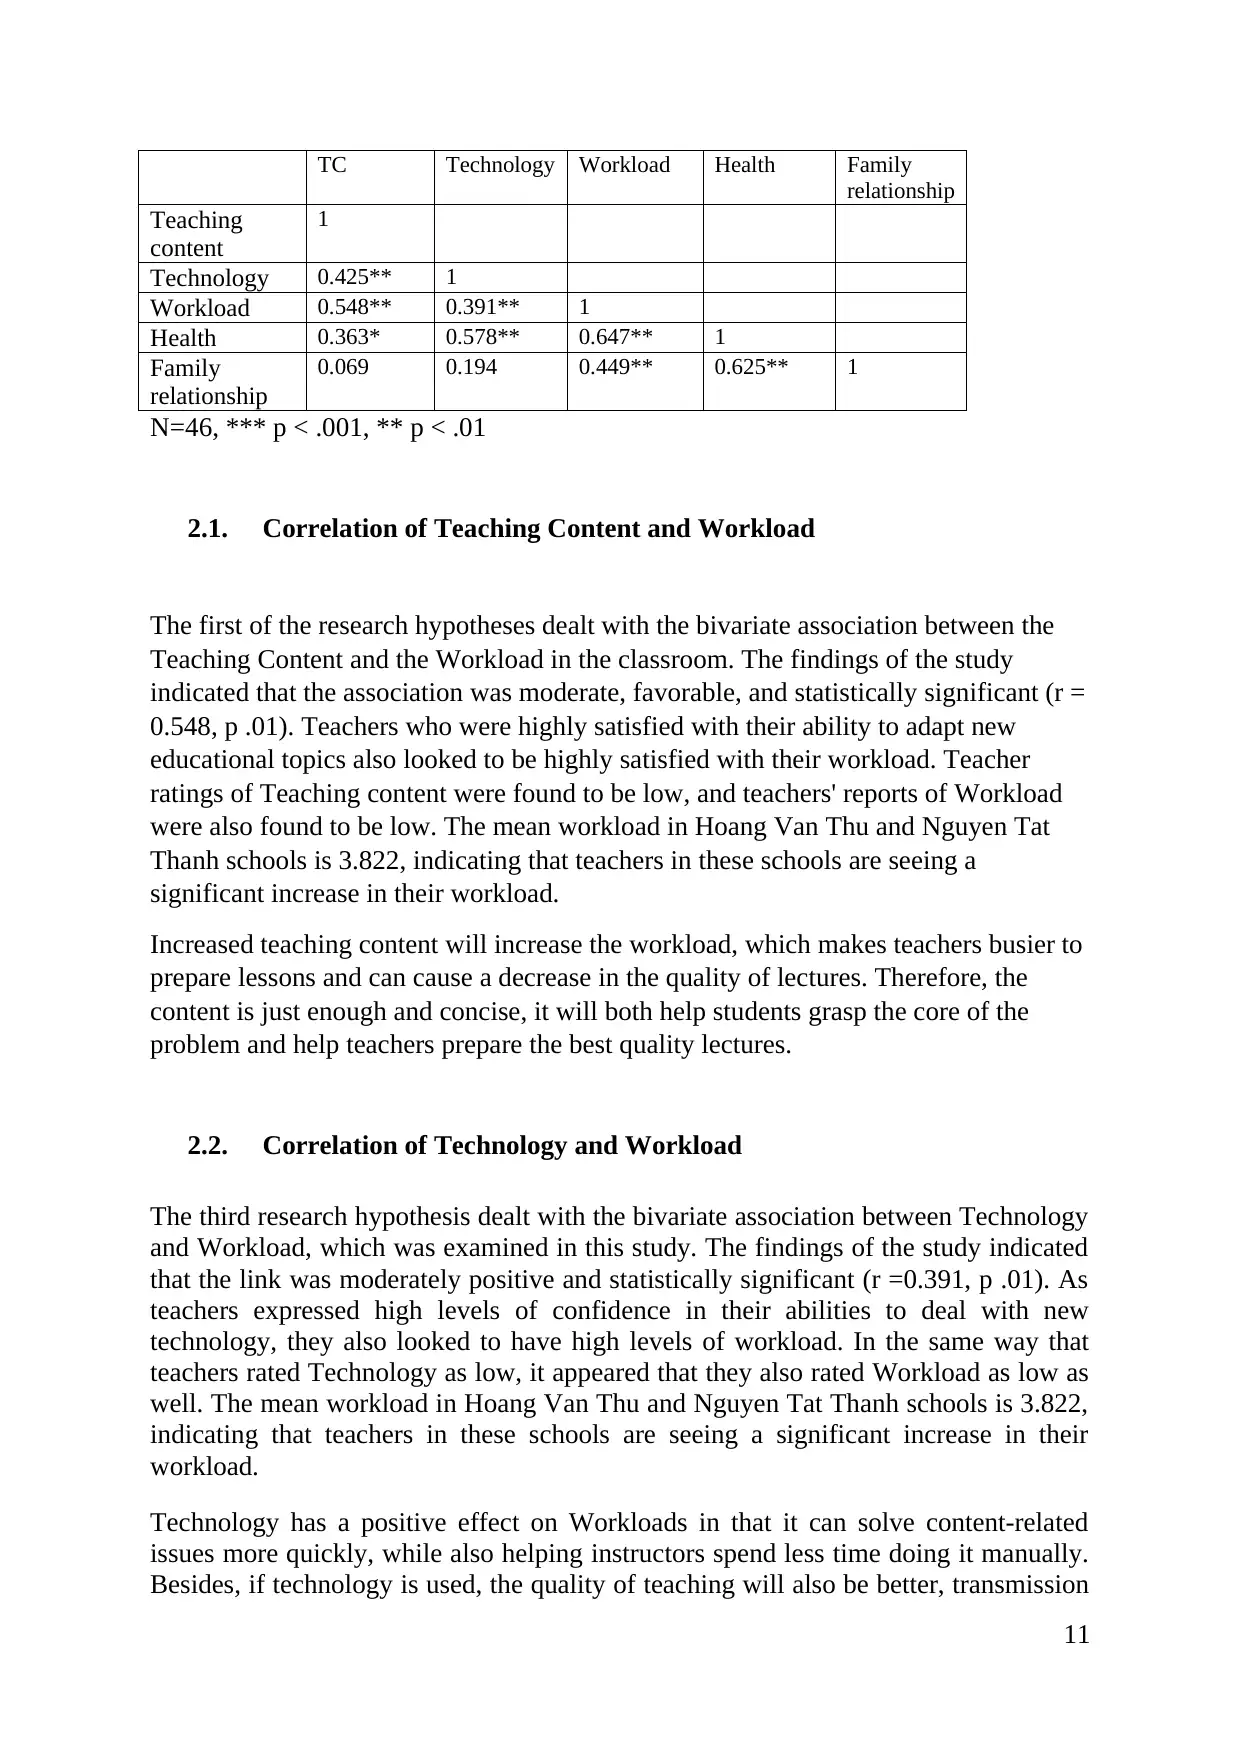
The diagram illustrates the teaching contracts of some high school teachers in urban
areas in Vietnam. In general, it can be clearly seen in the chart that most of them
belong to the group of civil servants, while the case-based labor contract only
contributes a negligible part. Accounting for 42% of the total, civil servants have the
largest proportion compared to other groups. The next ranks belong to officials and
labor contracts from 12-36 months. The former accounts for 38%, which is 25%
higher than the latter. Finally, the proportions of labor contracts with indefinite terms
and labor contracts on a case-by-case basis are 5% and 2%, respectively.
2. Quantitative analysis
The Likert scale that this study used is 5 points Likert scale(Strongly agree=5,
Agree=4, neither agree nor disagree=3, Disagree=2, Strongly Disagree =1)
whichmean that the more the data close to 5 the more customer satisfaction, the data
of customer’ answer mean is indicated in the table 5
Variables Mean Standard deviation
Teaching content 3.8840 0.611
Technology 3.5857 0.697
Workload 3.8222 0.73
Health 3.6489 0.72
Family relationship 3.4593 0.84
10
Công chức
42%
HĐLĐ từ 12 đến 36 tháng
13%
Hợp đồng Lao động không
xác định thời hạn
4%
Viên chức
38%
HĐLĐ theo vụ việc
2%
Table 3.5: Contract
The diagram illustrates the teaching contracts of some high school teachers in urban
areas in Vietnam. In general, it can be clearly seen in the chart that most of them
belong to the group of civil servants, while the case-based labor contract only
contributes a negligible part. Accounting for 42% of the total, civil servants have the
largest proportion compared to other groups. The next ranks belong to officials and
labor contracts from 12-36 months. The former accounts for 38%, which is 25%
higher than the latter. Finally, the proportions of labor contracts with indefinite terms
and labor contracts on a case-by-case basis are 5% and 2%, respectively.
2. Quantitative analysis
The Likert scale that this study used is 5 points Likert scale(Strongly agree=5,
Agree=4, neither agree nor disagree=3, Disagree=2, Strongly Disagree =1)
whichmean that the more the data close to 5 the more customer satisfaction, the data
of customer’ answer mean is indicated in the table 5
Variables Mean Standard deviation
Teaching content 3.8840 0.611
Technology 3.5857 0.697
Workload 3.8222 0.73
Health 3.6489 0.72
Family relationship 3.4593 0.84
10
TC Technology Workload Health Family
relationship
Teaching
content
1
Technology 0.425** 1
Workload 0.548** 0.391** 1
Health 0.363* 0.578** 0.647** 1
Family
relationship
0.069 0.194 0.449** 0.625** 1
N=46, *** p < .001, ** p < .01
2.1. Correlation of Teaching Content and Workload
The first of the research hypotheses dealt with the bivariate association between the
Teaching Content and the Workload in the classroom. The findings of the study
indicated that the association was moderate, favorable, and statistically significant (r =
0.548, p .01). Teachers who were highly satisfied with their ability to adapt new
educational topics also looked to be highly satisfied with their workload. Teacher
ratings of Teaching content were found to be low, and teachers' reports of Workload
were also found to be low. The mean workload in Hoang Van Thu and Nguyen Tat
Thanh schools is 3.822, indicating that teachers in these schools are seeing a
significant increase in their workload.
Increased teaching content will increase the workload, which makes teachers busier to
prepare lessons and can cause a decrease in the quality of lectures. Therefore, the
content is just enough and concise, it will both help students grasp the core of the
problem and help teachers prepare the best quality lectures.
2.2. Correlation of Technology and Workload
The third research hypothesis dealt with the bivariate association between Technology
and Workload, which was examined in this study. The findings of the study indicated
that the link was moderately positive and statistically significant (r =0.391, p .01). As
teachers expressed high levels of confidence in their abilities to deal with new
technology, they also looked to have high levels of workload. In the same way that
teachers rated Technology as low, it appeared that they also rated Workload as low as
well. The mean workload in Hoang Van Thu and Nguyen Tat Thanh schools is 3.822,
indicating that teachers in these schools are seeing a significant increase in their
workload.
Technology has a positive effect on Workloads in that it can solve content-related
issues more quickly, while also helping instructors spend less time doing it manually.
Besides, if technology is used, the quality of teaching will also be better, transmission
11
relationship
Teaching
content
1
Technology 0.425** 1
Workload 0.548** 0.391** 1
Health 0.363* 0.578** 0.647** 1
Family
relationship
0.069 0.194 0.449** 0.625** 1
N=46, *** p < .001, ** p < .01
2.1. Correlation of Teaching Content and Workload
The first of the research hypotheses dealt with the bivariate association between the
Teaching Content and the Workload in the classroom. The findings of the study
indicated that the association was moderate, favorable, and statistically significant (r =
0.548, p .01). Teachers who were highly satisfied with their ability to adapt new
educational topics also looked to be highly satisfied with their workload. Teacher
ratings of Teaching content were found to be low, and teachers' reports of Workload
were also found to be low. The mean workload in Hoang Van Thu and Nguyen Tat
Thanh schools is 3.822, indicating that teachers in these schools are seeing a
significant increase in their workload.
Increased teaching content will increase the workload, which makes teachers busier to
prepare lessons and can cause a decrease in the quality of lectures. Therefore, the
content is just enough and concise, it will both help students grasp the core of the
problem and help teachers prepare the best quality lectures.
2.2. Correlation of Technology and Workload
The third research hypothesis dealt with the bivariate association between Technology
and Workload, which was examined in this study. The findings of the study indicated
that the link was moderately positive and statistically significant (r =0.391, p .01). As
teachers expressed high levels of confidence in their abilities to deal with new
technology, they also looked to have high levels of workload. In the same way that
teachers rated Technology as low, it appeared that they also rated Workload as low as
well. The mean workload in Hoang Van Thu and Nguyen Tat Thanh schools is 3.822,
indicating that teachers in these schools are seeing a significant increase in their
workload.
Technology has a positive effect on Workloads in that it can solve content-related
issues more quickly, while also helping instructors spend less time doing it manually.
Besides, if technology is used, the quality of teaching will also be better, transmission
11
⊘ This is a preview!⊘
Do you want full access?
Subscribe today to unlock all pages.
Trusted by 1+ million students worldwide
1 out of 17
Your All-in-One AI-Powered Toolkit for Academic Success.
+13062052269
info@desklib.com
Available 24*7 on WhatsApp / Email
![[object Object]](/_next/static/media/star-bottom.7253800d.svg)
Unlock your academic potential
Copyright © 2020–2026 A2Z Services. All Rights Reserved. Developed and managed by ZUCOL.