Statistics Report: Analysis of Employee Data and Starting Salaries

Verified

Added on  2020/05/11

|6
|667
|161
Report
AI Summary
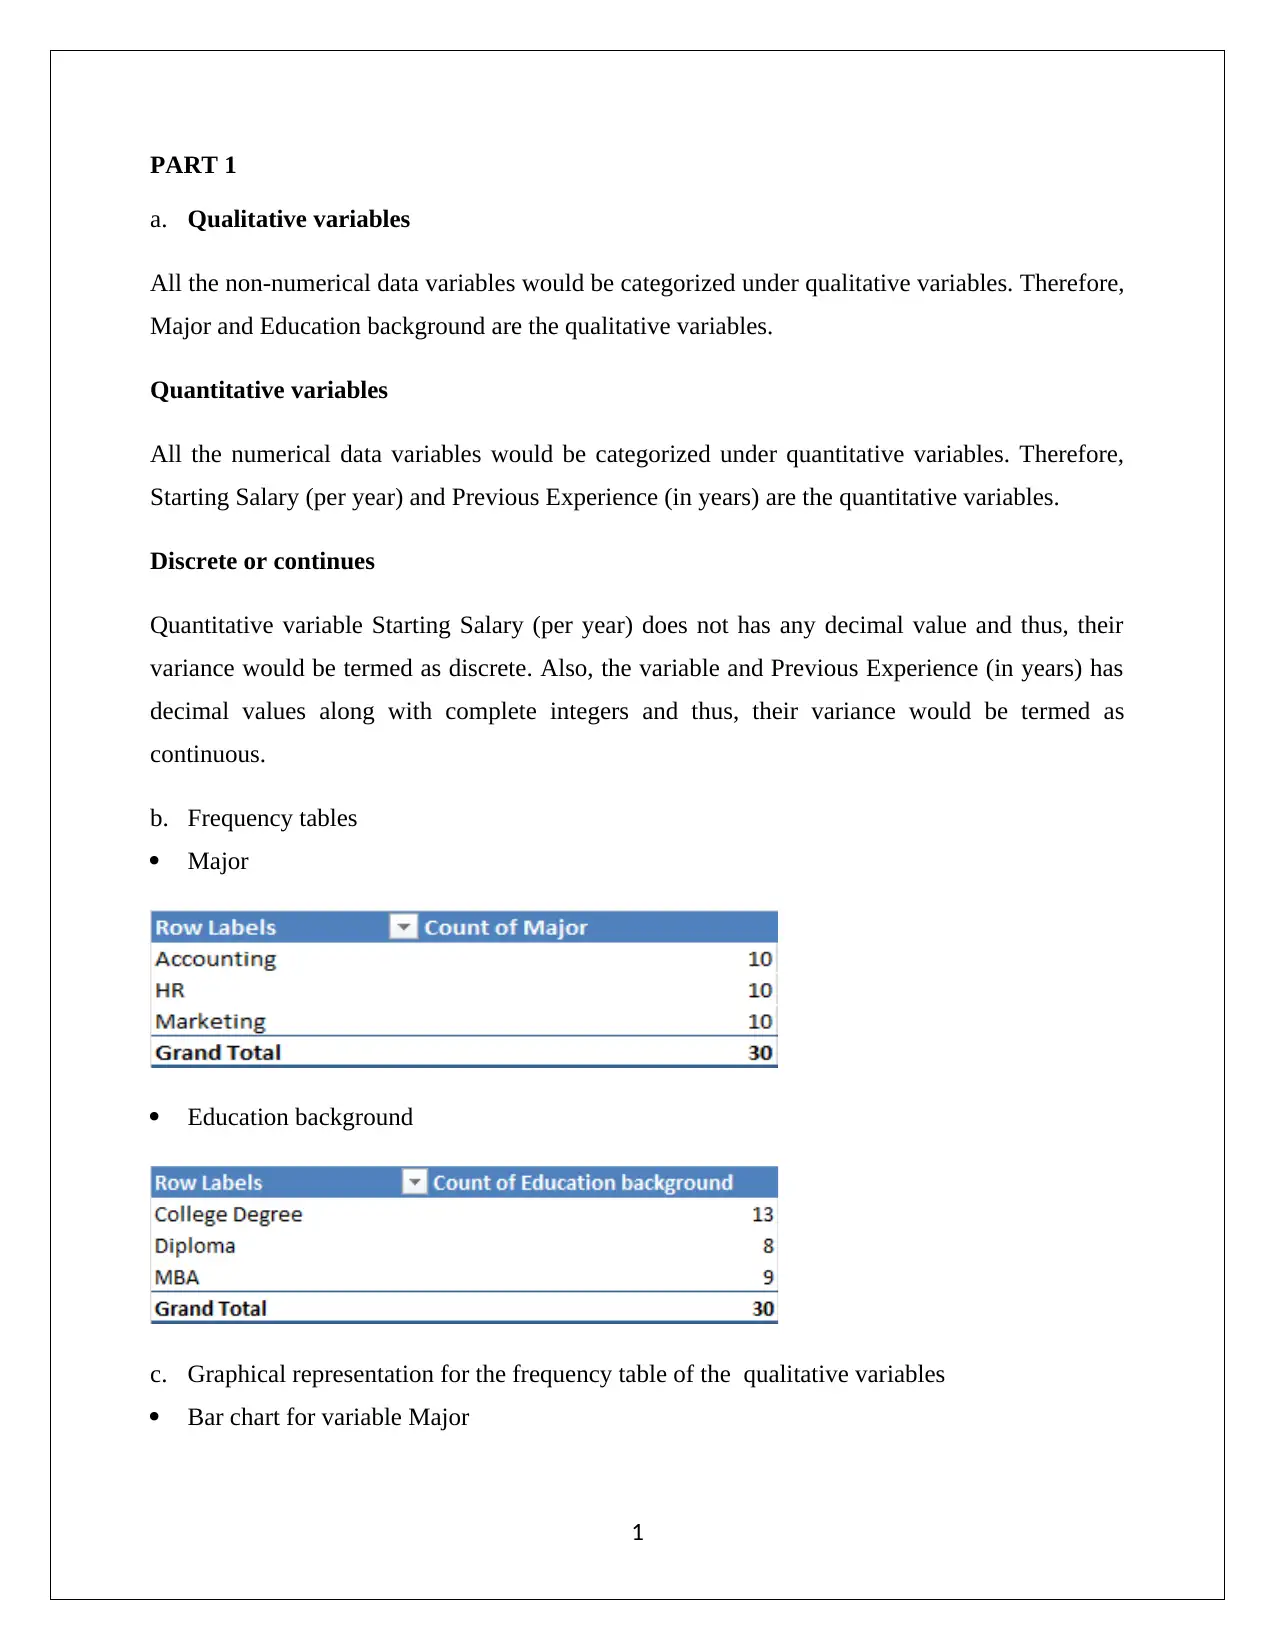
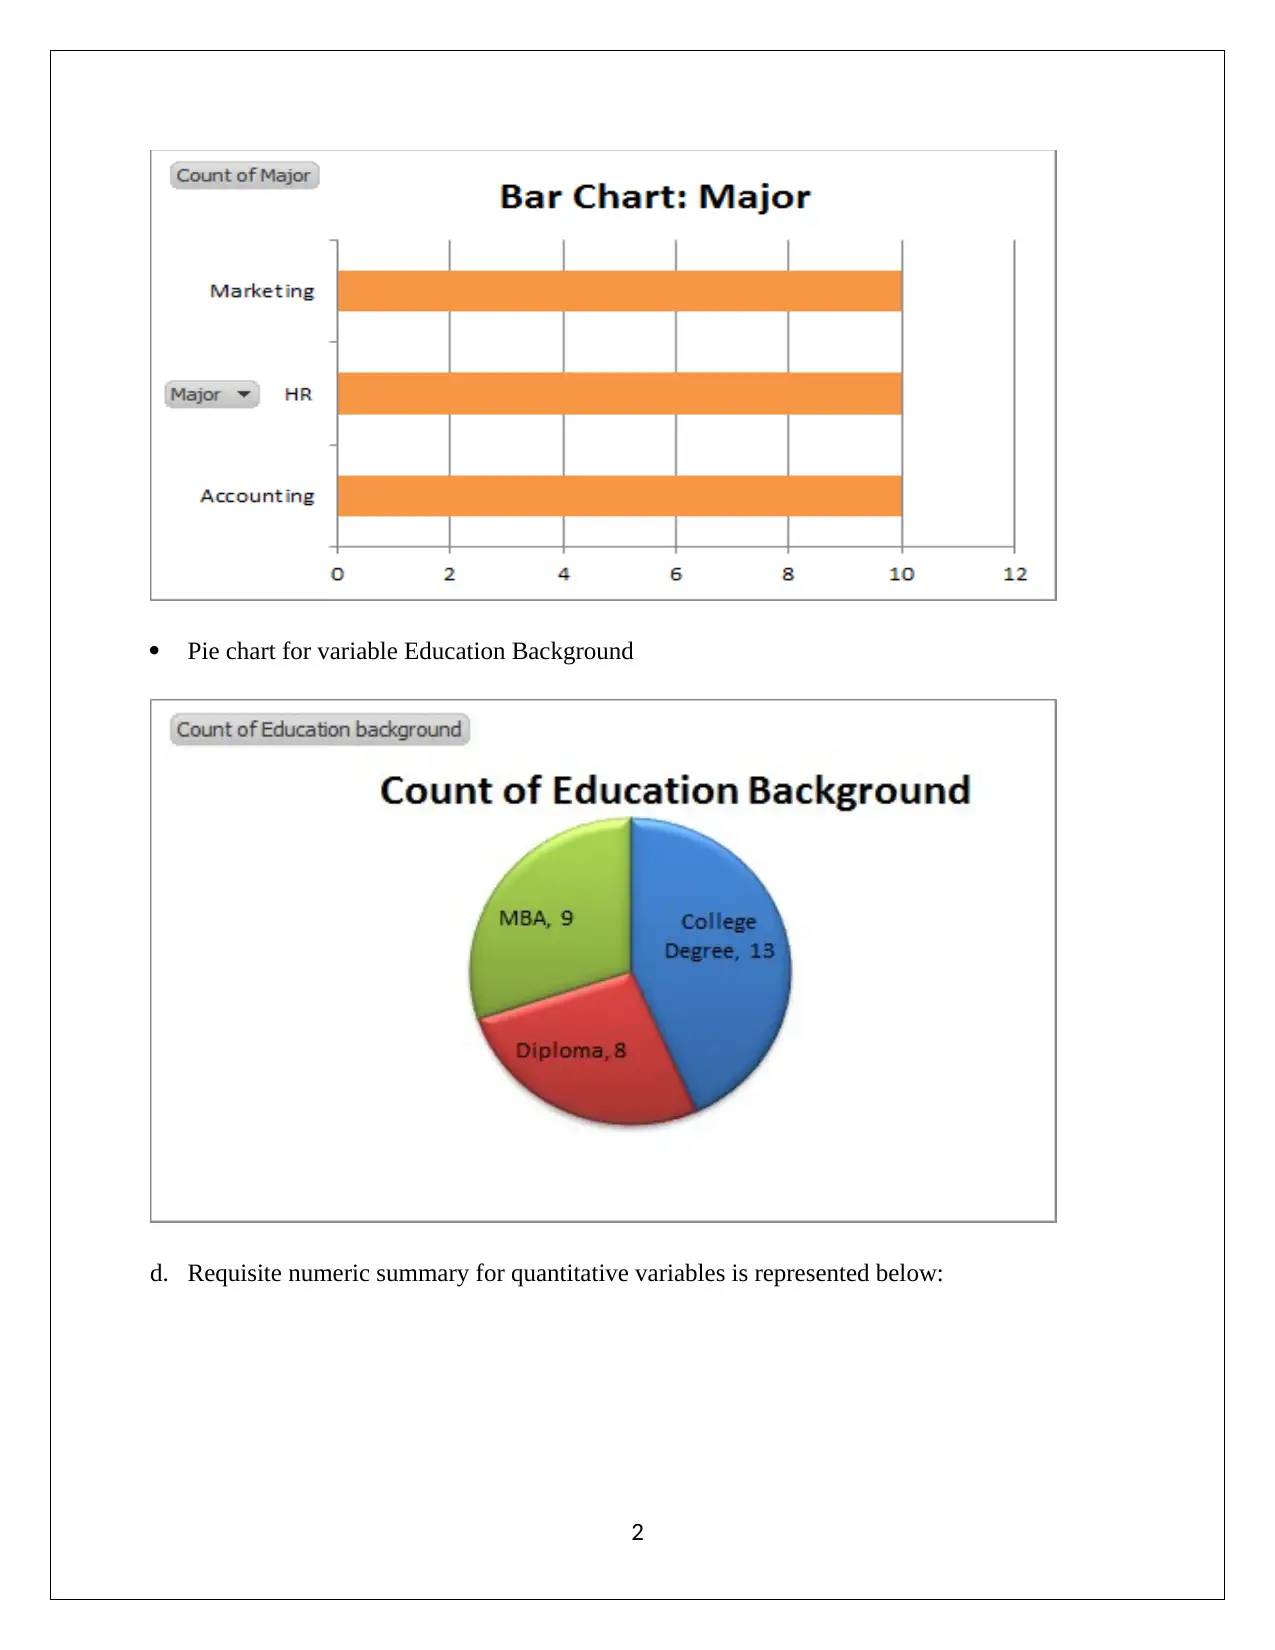
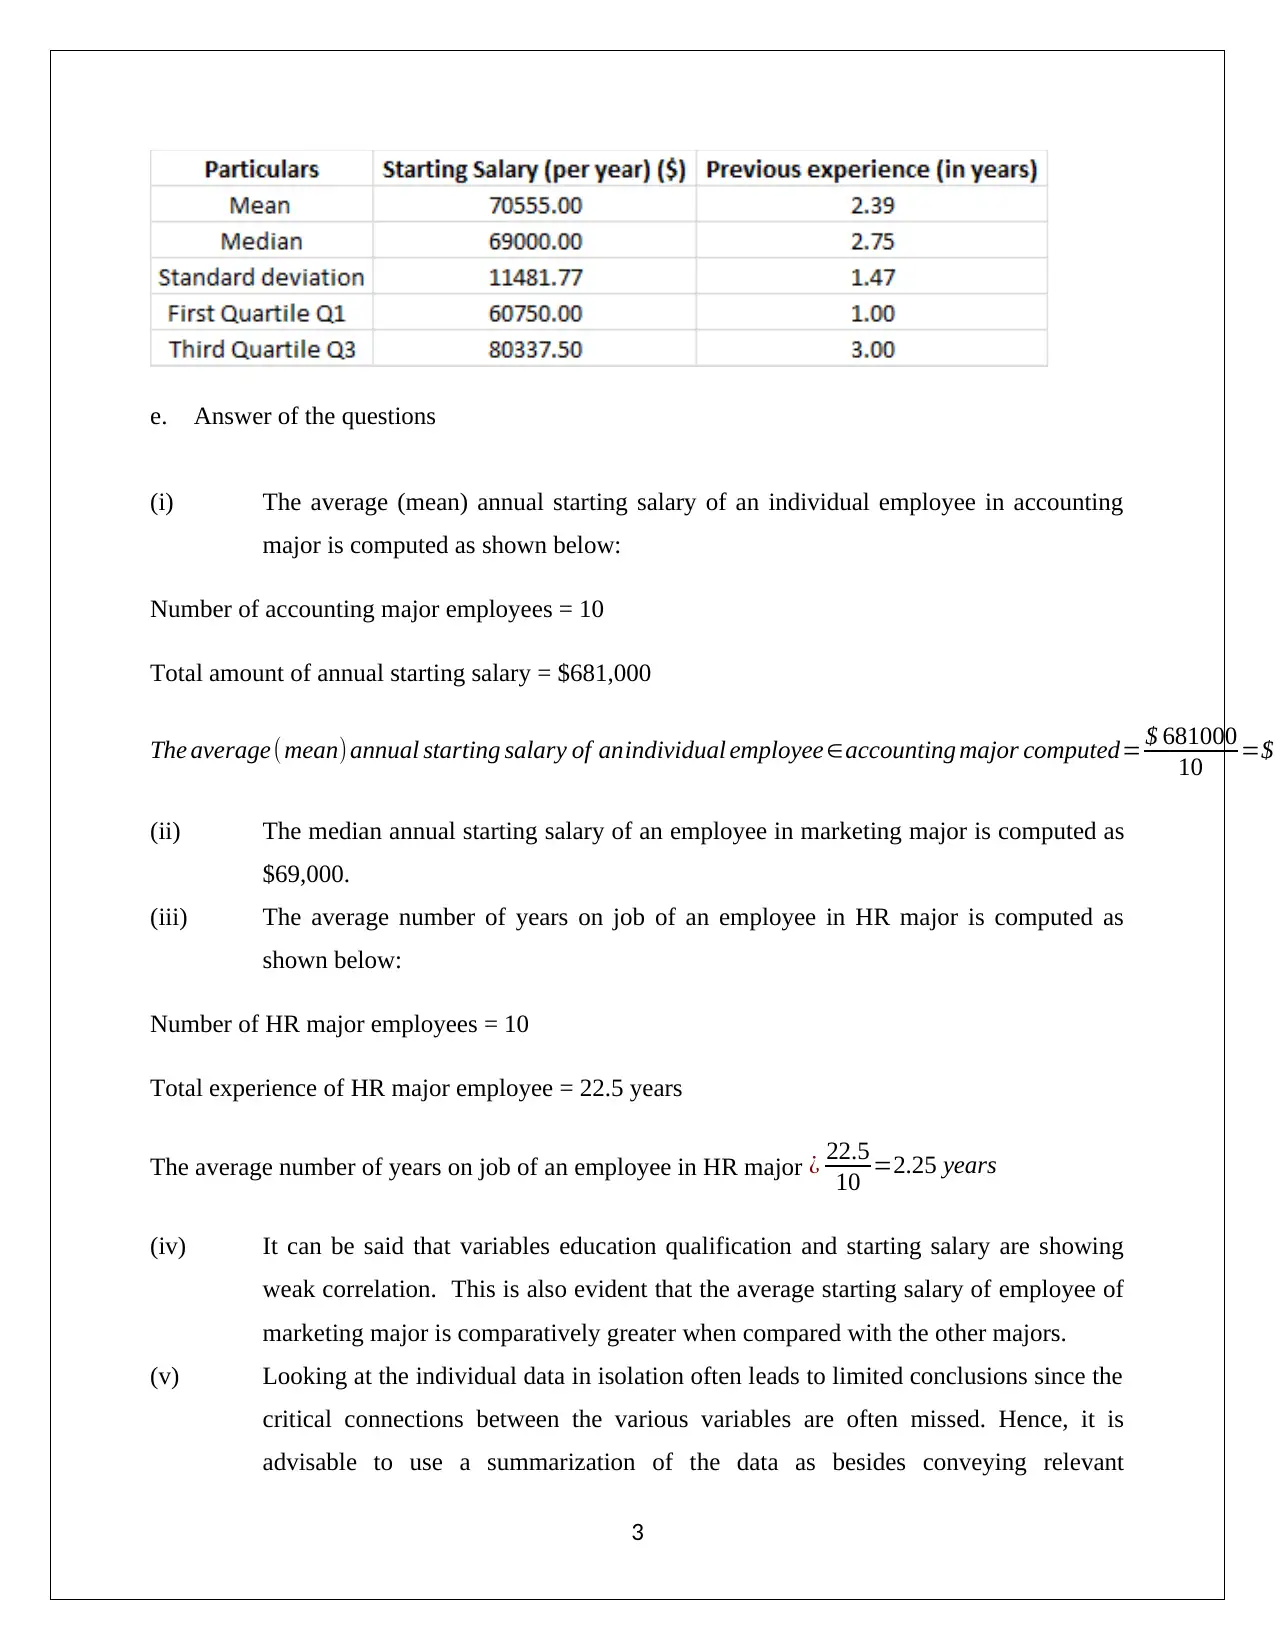
This report presents a statistical analysis of employee data, covering qualitative and quantitative variables such as education, starting salary, and years of experience. It includes frequency tables, bar charts, and pie charts to visualize the data. The report calculates the average starting salaries for different majors and analyzes the correlation between education and salary. The findings suggest that an MBA tends to fetch the highest salary, and that education background significantly impacts starting salaries. The report also highlights the importance of data summarization for making informed career decisions. The dataset includes 30 staff members, and the report acknowledges the limitations of the dataset size while providing valuable insights. The report is aimed at guiding students in making career decisions based on the analysis of the provided data.
Document Page
Introduction To Statistics
Student id & Name
[Pick the date]
tabler-icon-diamond-filled.svg

Paraphrase This Document

Need a fresh take? Get an instant paraphrase of this document with our AI Paraphraser
Document Page
PART 1
a. Qualitative variables
All the non-numerical data variables would be categorized under qualitative variables. Therefore,
Major and Education background are the qualitative variables.
Quantitative variables
All the numerical data variables would be categorized under quantitative variables. Therefore,
Starting Salary (per year) and Previous Experience (in years) are the quantitative variables.
Discrete or continues
Quantitative variable Starting Salary (per year) does not has any decimal value and thus, their
variance would be termed as discrete. Also, the variable and Previous Experience (in years) has
decimal values along with complete integers and thus, their variance would be termed as
continuous.
b. Frequency tables
Major
Education background
c. Graphical representation for the frequency table of the qualitative variables
Bar chart for variable Major
1
Document Page
Pie chart for variable Education Background
d. Requisite numeric summary for quantitative variables is represented below:
2
Document Page
e. Answer of the questions
(i) The average (mean) annual starting salary of an individual employee in accounting
major is computed as shown below:
Number of accounting major employees = 10
Total amount of annual starting salary = $681,000
The average( mean) annual starting salary of anindividual employee accounting major computed= $ 681000
10 =$
(ii) The median annual starting salary of an employee in marketing major is computed as
$69,000.
(iii) The average number of years on job of an employee in HR major is computed as
shown below:
Number of HR major employees = 10
Total experience of HR major employee = 22.5 years
The average number of years on job of an employee in HR major ¿ 22.5
10 =2.25 years
(iv) It can be said that variables education qualification and starting salary are showing
weak correlation. This is also evident that the average starting salary of employee of
marketing major is comparatively greater when compared with the other majors.
(v) Looking at the individual data in isolation often leads to limited conclusions since the
critical connections between the various variables are often missed. Hence, it is
advisable to use a summarization of the data as besides conveying relevant
3
tabler-icon-diamond-filled.svg

Paraphrase This Document

Need a fresh take? Get an instant paraphrase of this document with our AI Paraphraser
Document Page
information about the individual variables, it would also give insight on the inter-
connections prevalent and thereby ensure better decisions are made.
PART 2
4
Document Page
This report has the objective of presenting an analysis on the various majors particularly in
relation to the prospects offered in career terms. The use of this report is directed at the students
who have to make a career decision and hence can be provided suitable guidance. Further, the
dataset is based on the staff members who total 30 and the information collected tend to reflect
various aspects such as experience, education background and also the starting salary.
It seems evident that college degree seems to the most prevalent education degree amongst the
respondents and also the MBA seems quite popular. Further, the highest education level is in the
form of MBA which tends to fetch the highest amount of salary. Further, the lowest education
level is diploma and the corresponding salary levels are the lowest. Also, this observation is
consistent across the majors and is not restricted to a particular major. The average salary levels
across the three majors do not show any significant difference with annual starting salaries of
around $ 70,000.
However, caution needs to be exhibited in the use of the various trends which are reflected based
on the given data. This is imperative as the current dataset is quite lesser in size and more
observations and respondents would lead to more valid and reliable conclusions drawn. But
having said that there is no denying the fact that education background makes a significant
different to starting salaries. This trend is quite expected also. However, experience and majors
do not seem to have any significant impact on the starting salaries and hence are of lesser
importance.
5
chevron_up_icon
1 out of 6
circle_padding
hide_on_mobile
zoom_out_icon
[object Object]