Business Statistics Report: Analysis of Job Satisfaction in a Company
VerifiedAdded on 2022/09/23
|18
|1751
|22
Report
AI Summary
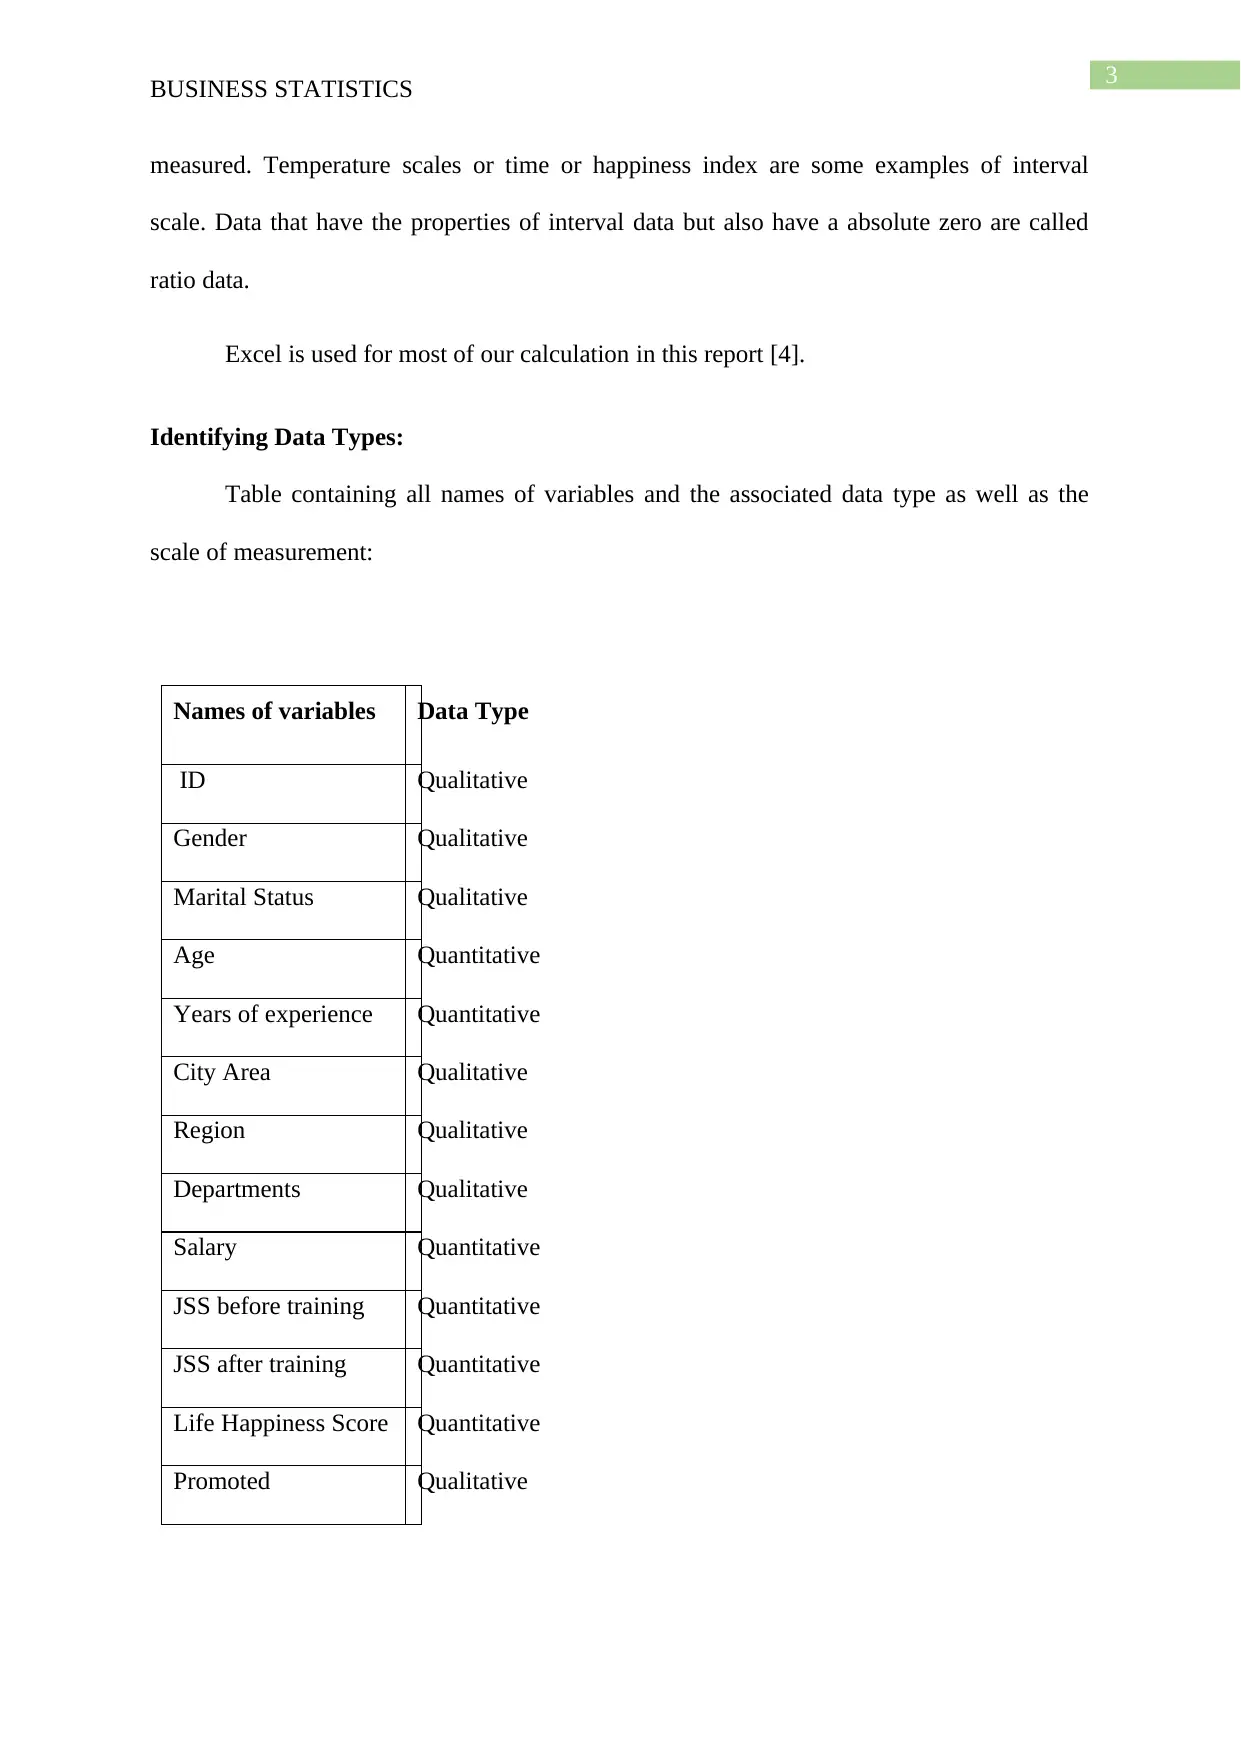
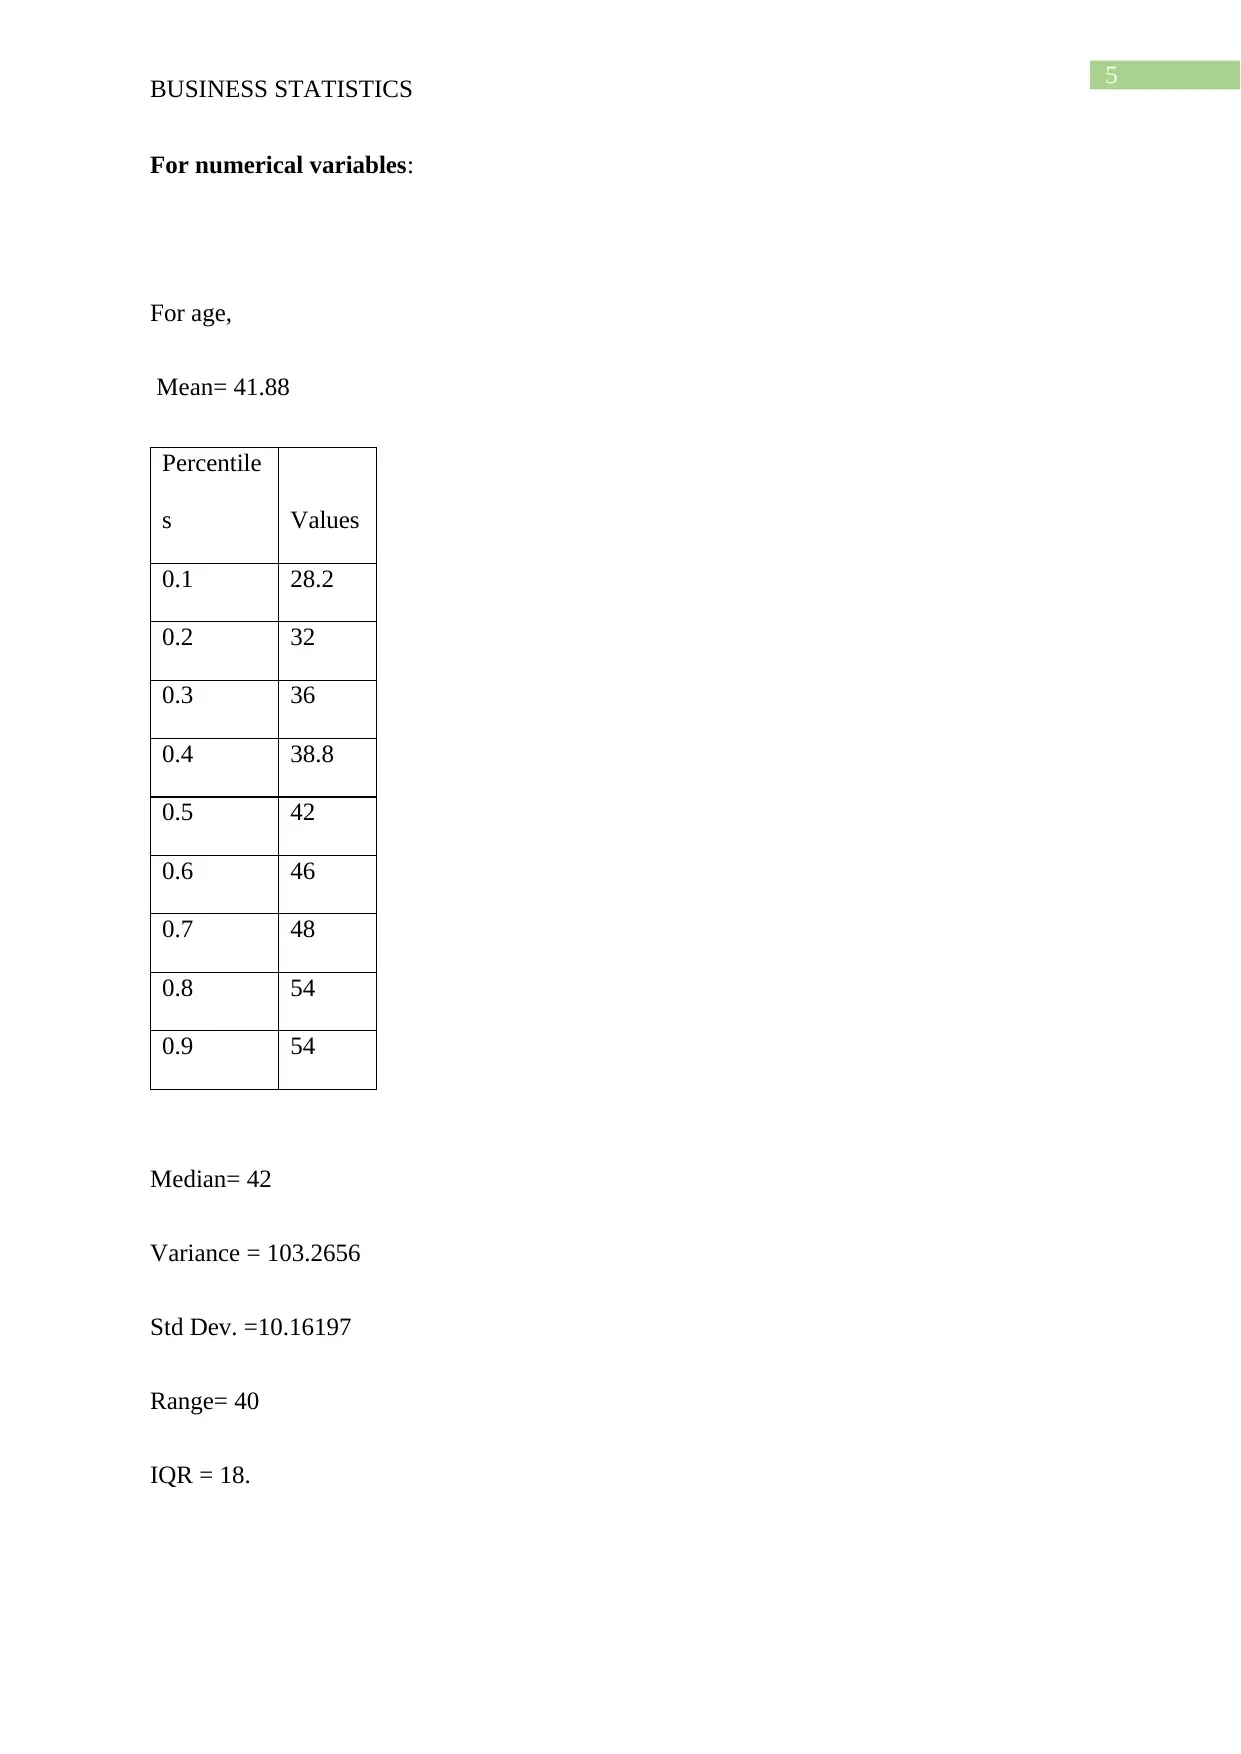
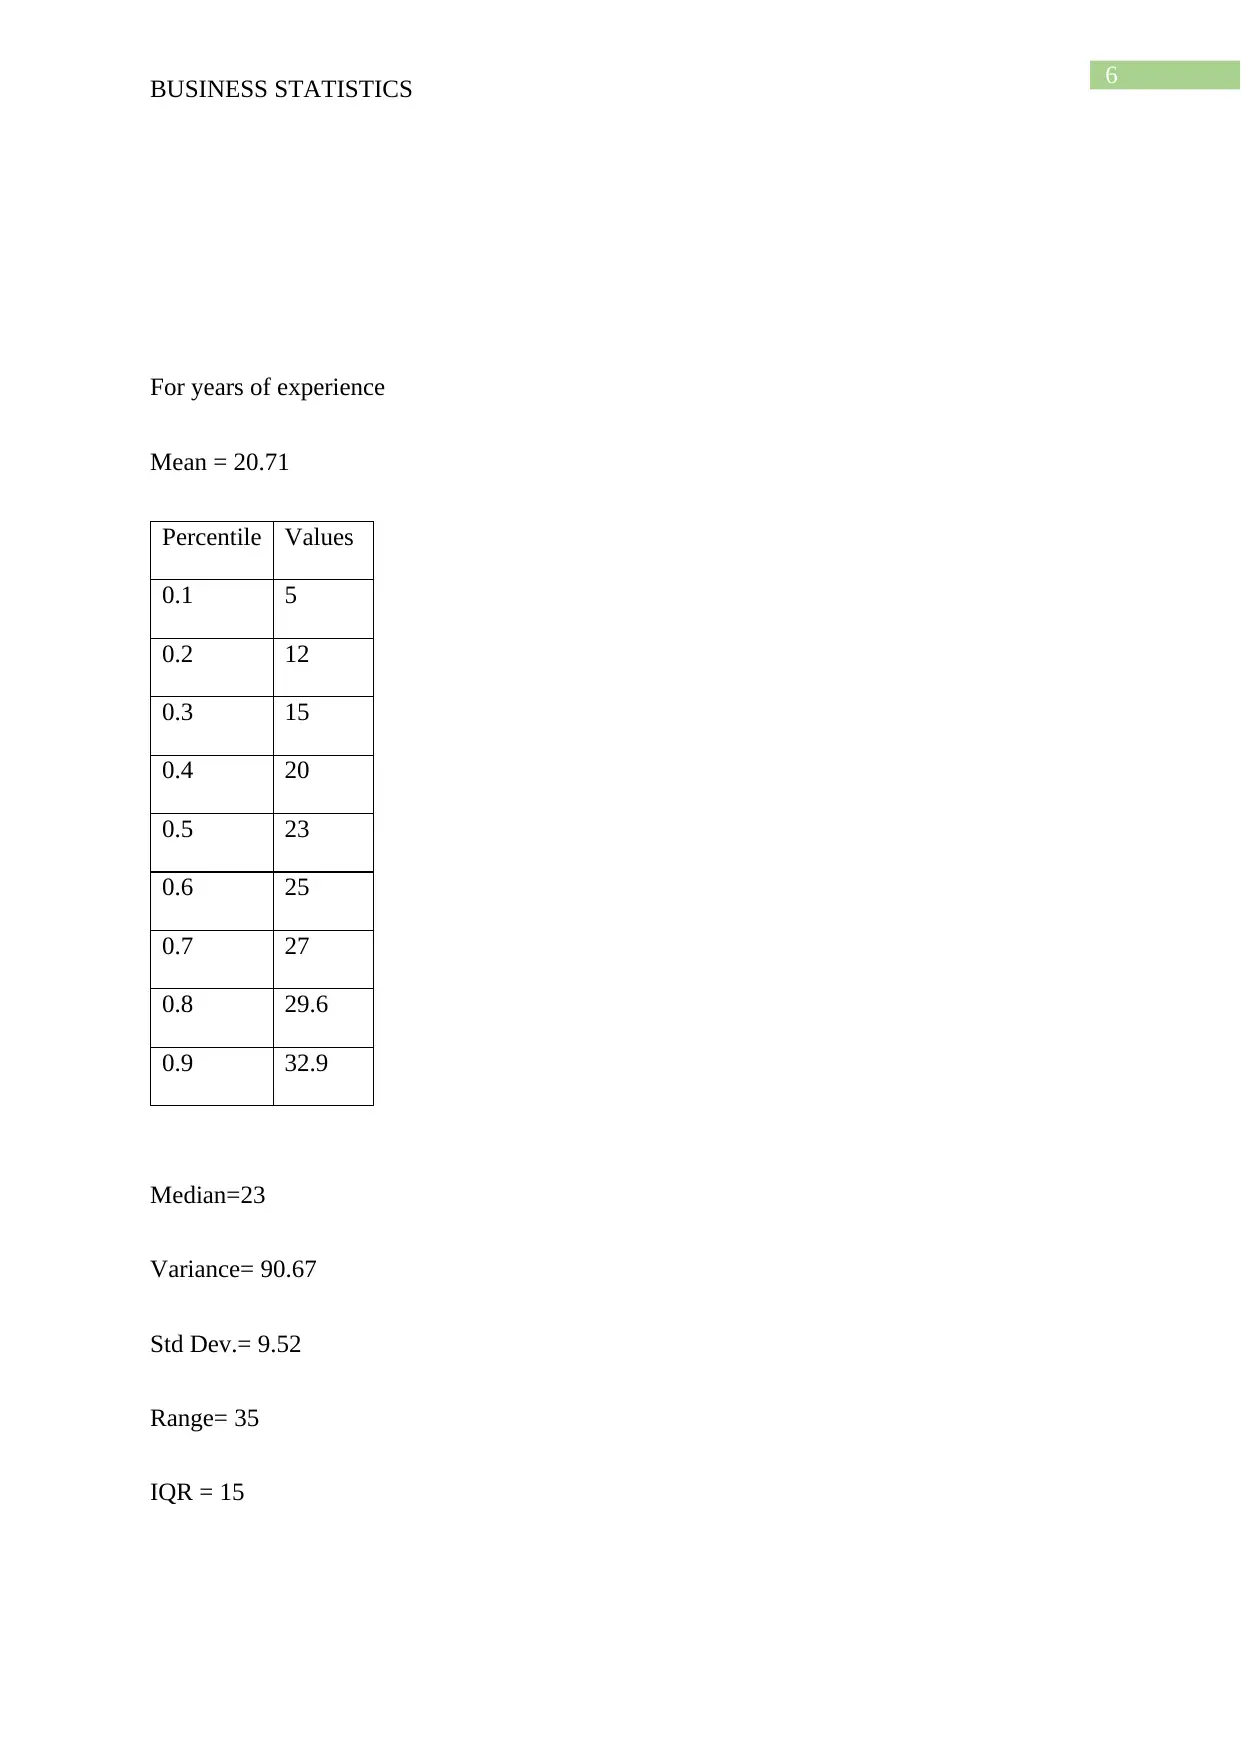
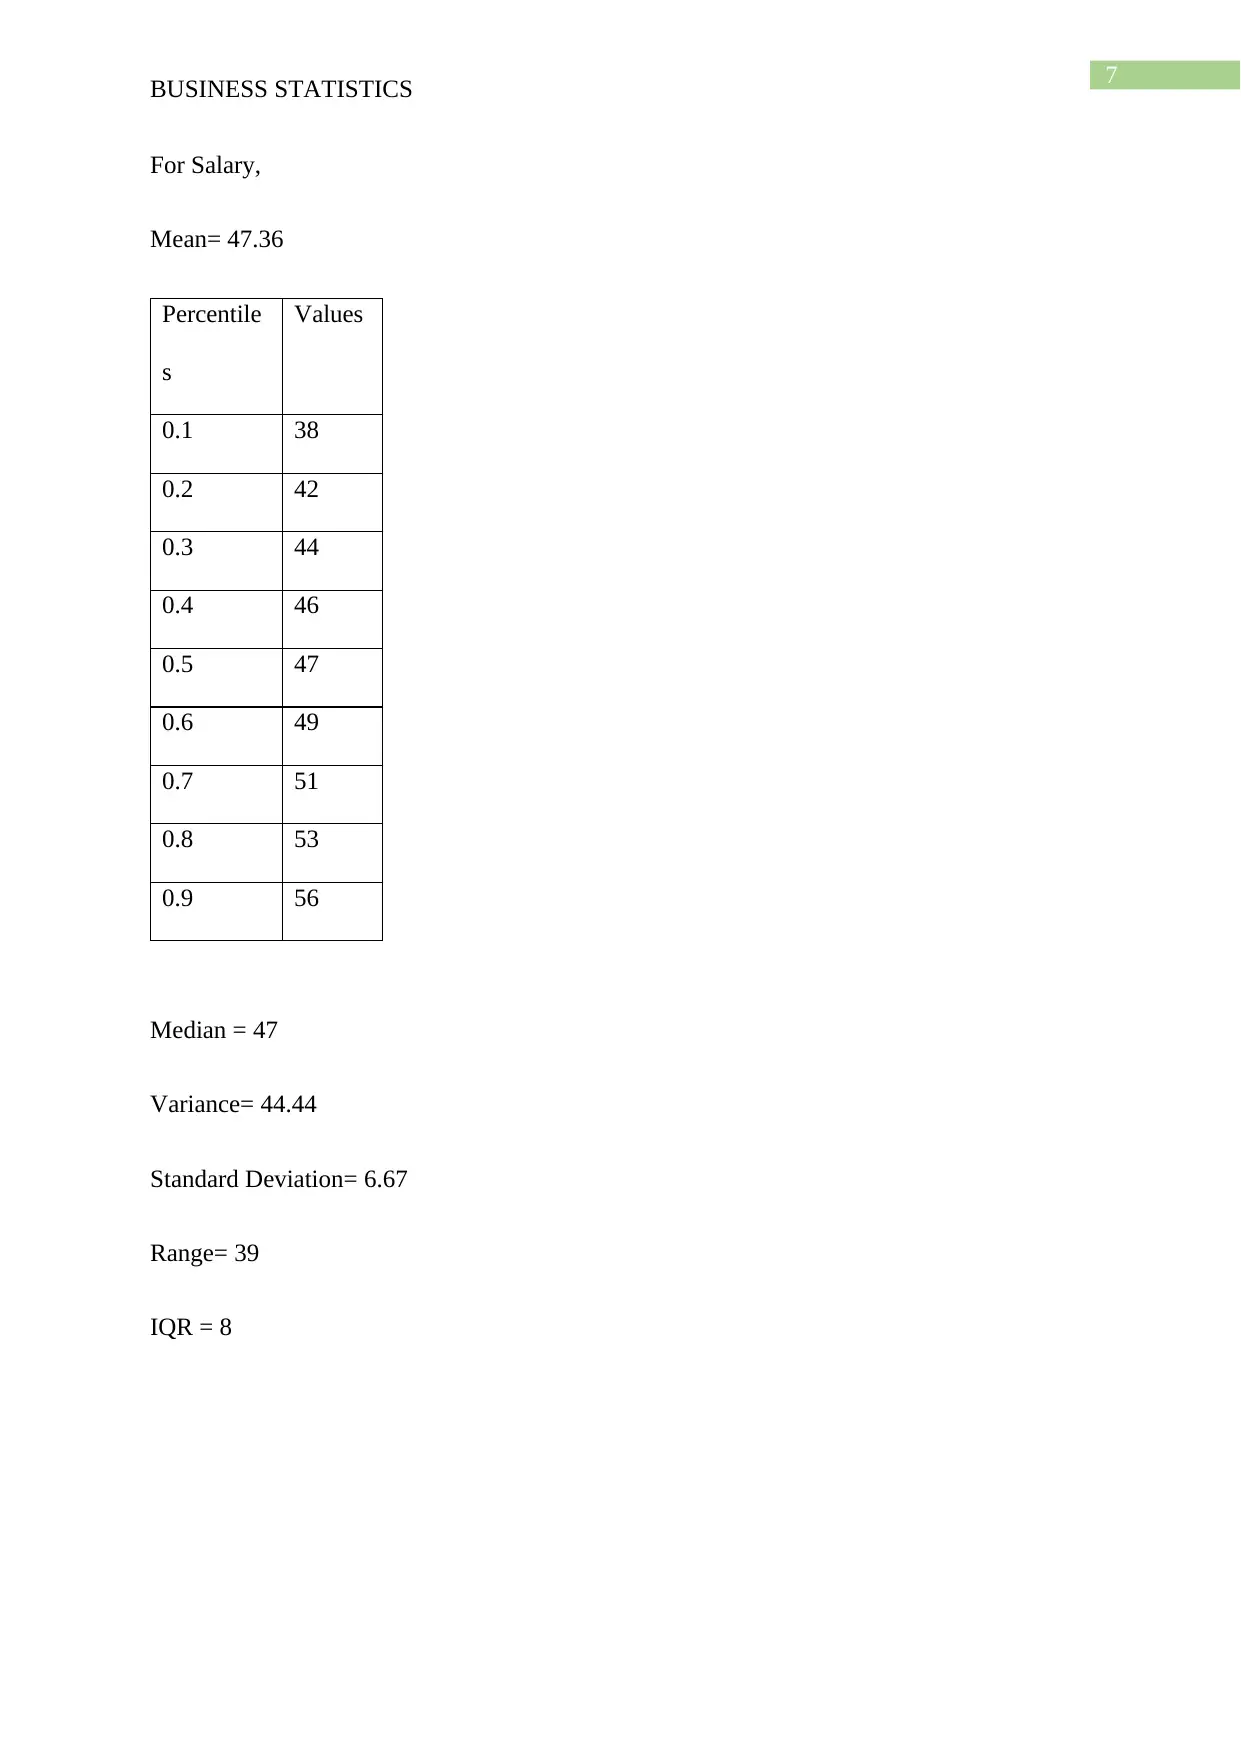
This report presents an analysis of employee job satisfaction within a company, utilizing various business statistical methods. The study begins by identifying different data types and their scales of measurement, including nominal, ordinal, interval, and ratio data. Descriptive statistics such as mean, median, standard deviation, and percentiles are calculated for numerical variables like age, years of experience, and salary. The report also examines categorical variables through frequency tables, including distributions for regions, job satisfaction scores before and after training, and marital status. Scatter plots are used to visualize relationships between variables, such as age and years of experience, age and salary, and job satisfaction and happiness, with correlation coefficients calculated to quantify the strength of these relationships. The findings suggest that employee satisfaction increases post-training and that age correlates positively with years of experience, while the relationship between age and salary is weak. The report concludes with a discussion of the results and recommendations for the company based on the statistical analysis of the collected data.

Running head: BUSINESS STATISTICS
Business Statistics
Name Of Student:
Name Of University:
Authors Note:
Business Statistics
Name Of Student:
Name Of University:
Authors Note:
Paraphrase This Document
Need a fresh take? Get an instant paraphrase of this document with our AI Paraphraser

1
BUSINESS STATISTICS
Table of Contents
Introduction:...............................................................................................................................3
Identifying Data Types:..............................................................................................................3
Descriptive Statistics..................................................................................................................4
For numerical variables..........................................................................................................4
Numerical measure for categorical variable:.............................................................................6
Data summarising:.....................................................................................................................6
Frequency table for two different categorical variable:.........................................................7
Frequency table for two different numerical variable:...........................................................7
Two way frequency table for marital status and regions containing them:...........................9
Scatter plot of age and years of experience..........................................................................10
Scatter plot between age and salary:....................................................................................11
Discussion of the results and recommendations:.....................................................................12
References:...............................................................................................................................13

2
BUSINESS STATISTICS
Introduction:
The main goal of this study is estimating the job satisfaction of employees working
for a company. Job Satisfaction depends on many different factors from salary, the kind of
work and the overall environment of the company. There are some relation, in general
between, job satisfaction and happiness, years of experience and salary etc. For this report a
survey is conducted and various data relating to different categories were collected. The
values were of different data types and it has been categorized accordingly. Age, salary, years
of experience are taken and their statistic, such as mean, standard of deviation, is calculated.
Other variables are also considered to see any patterns linking them [1].
The data given is studied and graphs between variables that might indicate some
relationship between them are analysed. A questions might be answered from such
investigations, such as if there is a link between years of experience and job satisfaction, or
any links between age of an employee and job satisfaction or any variables that might have a
relationship [2].
Many statistical tools to achieve our objective. The variables is at first classified into
their respective data types. This helps us understand which of the statistical tools such as
mean, median, mode or others we have to apply to the classes of data. The higher the data
level, the more sophisticated is our level of analysis. There are four levels of data
measurement: nominal, interval,ordinal and ratio [3]. Nominal data’s are the weakest forms
of data. For example in our case the marital status of the employees can have only two
results: 1. Married or 2. Single. Id, Gender, Status of promotion fall under this category.
Ordinal data’s are next in the hierarchy in the data measurement level. These are used when
there is a ordered relationship between the value assigned to the variables. Interval Data is the
set of data that has the ordinal properties but also the distance between the data can be
⊘ This is a preview!⊘
Do you want full access?
Subscribe today to unlock all pages.

Trusted by 1+ million students worldwide

3
BUSINESS STATISTICS
measured. Temperature scales or time or happiness index are some examples of interval
scale. Data that have the properties of interval data but also have a absolute zero are called
ratio data.
Excel is used for most of our calculation in this report [4].
Identifying Data Types:
Table containing all names of variables and the associated data type as well as the
scale of measurement:
Names of variables Data Type
ID Qualitative
Gender Qualitative
Marital Status Qualitative
Age Quantitative
Years of experience Quantitative
City Area Qualitative
Region Qualitative
Departments Qualitative
Salary Quantitative
JSS before training Quantitative
JSS after training Quantitative
Life Happiness Score Quantitative
Promoted Qualitative
Paraphrase This Document
Need a fresh take? Get an instant paraphrase of this document with our AI Paraphraser

4
BUSINESS STATISTICS
Descriptive Statistics
BUSINESS STATISTICS
Descriptive Statistics

5
BUSINESS STATISTICS
For numerical variables:
For age,
Mean= 41.88
Percentile
s Values
0.1 28.2
0.2 32
0.3 36
0.4 38.8
0.5 42
0.6 46
0.7 48
0.8 54
0.9 54
Median= 42
Variance = 103.2656
Std Dev. =10.16197
Range= 40
IQR = 18.
BUSINESS STATISTICS
For numerical variables:
For age,
Mean= 41.88
Percentile
s Values
0.1 28.2
0.2 32
0.3 36
0.4 38.8
0.5 42
0.6 46
0.7 48
0.8 54
0.9 54
Median= 42
Variance = 103.2656
Std Dev. =10.16197
Range= 40
IQR = 18.
⊘ This is a preview!⊘
Do you want full access?
Subscribe today to unlock all pages.

Trusted by 1+ million students worldwide

6
BUSINESS STATISTICS
For years of experience
Mean = 20.71
Percentile Values
0.1 5
0.2 12
0.3 15
0.4 20
0.5 23
0.6 25
0.7 27
0.8 29.6
0.9 32.9
Median=23
Variance= 90.67
Std Dev.= 9.52
Range= 35
IQR = 15
BUSINESS STATISTICS
For years of experience
Mean = 20.71
Percentile Values
0.1 5
0.2 12
0.3 15
0.4 20
0.5 23
0.6 25
0.7 27
0.8 29.6
0.9 32.9
Median=23
Variance= 90.67
Std Dev.= 9.52
Range= 35
IQR = 15
Paraphrase This Document
Need a fresh take? Get an instant paraphrase of this document with our AI Paraphraser

7
BUSINESS STATISTICS
For Salary,
Mean= 47.36
Percentile
s
Values
0.1 38
0.2 42
0.3 44
0.4 46
0.5 47
0.6 49
0.7 51
0.8 53
0.9 56
Median = 47
Variance= 44.44
Standard Deviation= 6.67
Range= 39
IQR = 8
BUSINESS STATISTICS
For Salary,
Mean= 47.36
Percentile
s
Values
0.1 38
0.2 42
0.3 44
0.4 46
0.5 47
0.6 49
0.7 51
0.8 53
0.9 56
Median = 47
Variance= 44.44
Standard Deviation= 6.67
Range= 39
IQR = 8

8
BUSINESS STATISTICS
Numerical measure for categorical variable:
Data can be categorized into the levels of their measurement. Nominal, Interval,
Ordinal and Ratio in increasing order of priority for analysis of data.
Nominal categorical variables offer the lowest levels of analysis and all we can calculate is
the frequency for them. The codes attached to them have no particular significance as they
don’t have priority. For example, for the relationship status of a person, we may use 1=
Married, 2= Single, 3= Divorced and 4= others for collecting the data set. The code does not
have to be numeric. For such data we can calculate the frequency only. Ordinal categorical
variable rank higher up the level of measurement and we can calculate frequency tables or
two way frequency tables with them. At this level the data elements can be ordered on the
basis of a hierarchy among them, and values may be assigned indicating the order of
hierarchy. For example in our data set, the values for City where an employee is from, or
region where an employee is from, represents ordinal data.
Data summarising:
Frequency table for two different categorical variable:
We take the region coded east, west, north and south and calculate the frequency distribution
of people living in those regions.
FREQUENCY DISTRIBUTION OF REGIONS
⊘ This is a preview!⊘
Do you want full access?
Subscribe today to unlock all pages.

Trusted by 1+ million students worldwide

9
BUSINESS STATISTICS
Region Frequency
East 71
North 47
South 59
West 123
Grand
Total
300
Next, the job satisfaction scores before training and the frequency distribution are calculated
in a tabular form:
FREQUENCY OF JSS SCORE BEFORE TRAINING:
JSS
SCORE
Frequency
1 93
2 224
3 207
4 96
5 10
Frequency of JSS score after training:
JSS score after
training
Frequency
1 8
2 31
Paraphrase This Document
Need a fresh take? Get an instant paraphrase of this document with our AI Paraphraser

10
BUSINESS STATISTICS
3 134
4 44
5 83
Grand Total 300
Frequency table for two different numerical variable:
Frequency table of salary received by the members.
Frequency table of Ages among the people.
Salary(in
thousands)
Frequen
cy
20-29 2
30-39 36
40-49 152
50-59 100
60-70 10
Grand Total 300
BUSINESS STATISTICS
3 134
4 44
5 83
Grand Total 300
Frequency table for two different numerical variable:
Frequency table of salary received by the members.
Frequency table of Ages among the people.
Salary(in
thousands)
Frequen
cy
20-29 2
30-39 36
40-49 152
50-59 100
60-70 10
Grand Total 300

11
BUSINESS STATISTICS
Age
Freque
ncy
20-29 30
30-39 90
40-49 99
50-60 81
Grand
Total 300
20-29 30-39 40-49 50-60
0
20
40
60
80
100
120
Histogram of Age
Total
Two way frequency table for marital status and regions containing them:
BUSINESS STATISTICS
Age
Freque
ncy
20-29 30
30-39 90
40-49 99
50-60 81
Grand
Total 300
20-29 30-39 40-49 50-60
0
20
40
60
80
100
120
Histogram of Age
Total
Two way frequency table for marital status and regions containing them:
⊘ This is a preview!⊘
Do you want full access?
Subscribe today to unlock all pages.

Trusted by 1+ million students worldwide
1 out of 18
Related Documents

Your All-in-One AI-Powered Toolkit for Academic Success.
+13062052269
info@desklib.com
Available 24*7 on WhatsApp / Email
Unlock your academic potential
Copyright © 2020–2025 A2Z Services. All Rights Reserved. Developed and managed by ZUCOL.