Data Analysis Assignment: Employee Engagement and Performance
VerifiedAdded on 2022/12/29
|16
|3061
|6
Homework Assignment
AI Summary
This assignment presents an analysis of employee engagement data, focusing on three key variables: WorkEnjoyment, JobEngagement, and AgencyEngagement. The analysis utilizes statistical methods and SPSS output to summarize and interpret the data. The 'WorkEnjoyment' variable, a categorical measure, reveals that the majority of employees report enjoying their work, with the mean at 4.02, and mode at 4, indicating a positive work environment. The 'JobEngagement' variable, a metric measurement, shows a mean of 15.01, with most employees scoring high on engagement. The 'AgencyEngagement' variable, also a metric, reveals a mean of 8.49, indicating a moderate level of engagement with their respective agencies or departments. The assignment also includes a practical problem where James the postman's delivery times are compared to other posties, requiring the calculation of z-scores to determine unusual slowness on specific routes. The assignment provides comprehensive statistical outputs, including means, standard deviations, skewness, kurtosis, and frequency distributions to support the analysis. The overall findings suggest that employees generally have positive experiences with their work, job engagement, and agency engagement, although some areas for improvement are identified.
Running head: 2 - ANALYSIS OF DATA – PART 1 1
2: Analysis of data – Part 1
2: Analysis of data – Part 1
Paraphrase This Document
Need a fresh take? Get an instant paraphrase of this document with our AI Paraphraser
2 - ANALYSIS OF DATA – PART 1 2
2: Analysis of data – Part 1
Question 1 – Summary of a categorical variable
The variable ‘WorkEnjoyment’ indicates the extent to which each employee agrees
with the statement 'I enjoy my work'.
Produce the relevant graph and table to summarise the ‘WorkEnjoyment’ variable
and write a paragraph explaining the key features of the data observed in the output
in the style presented in the course materials.
Negatively skewed
83.2 % of people either agreed or strongly agreed they enjoyed their work
The data has shown that the majority of people (mean 4.02, mode 4) agreed
that they enjoyed their work.
Answer would go here.
In the survey of work environment has been conducted to analyze the number of
people loving their work. The question about ' I enjoy my work' was asked from 1500
respondents to know how many employees are satisfied with their work. It directly influence
the work environment and productivity of the organization as whole. The outcomes of the
analysis has been derived using the statistical analysis. It shows that the mean value is 4.02 of
the given data set of people is 4.02 and the standard deviation is 0.22 which shows that the
result shows very low variation from the mean value (Plonsky and Ghanbar, 2018). Mode is
4 which means that number of people who agree with the statement are more frequent as
compared with other. Variance is 0.732 for the given values and skewness is -1.216 and error
is 0.63 in skewness which means the symmetric measure is negative. On the other kurtosis is
2.106 which shows the data is heavy tailed relative to the normal distribution.
Question 1 – Summary of a categorical variable – SPSS Output
Output would go here.
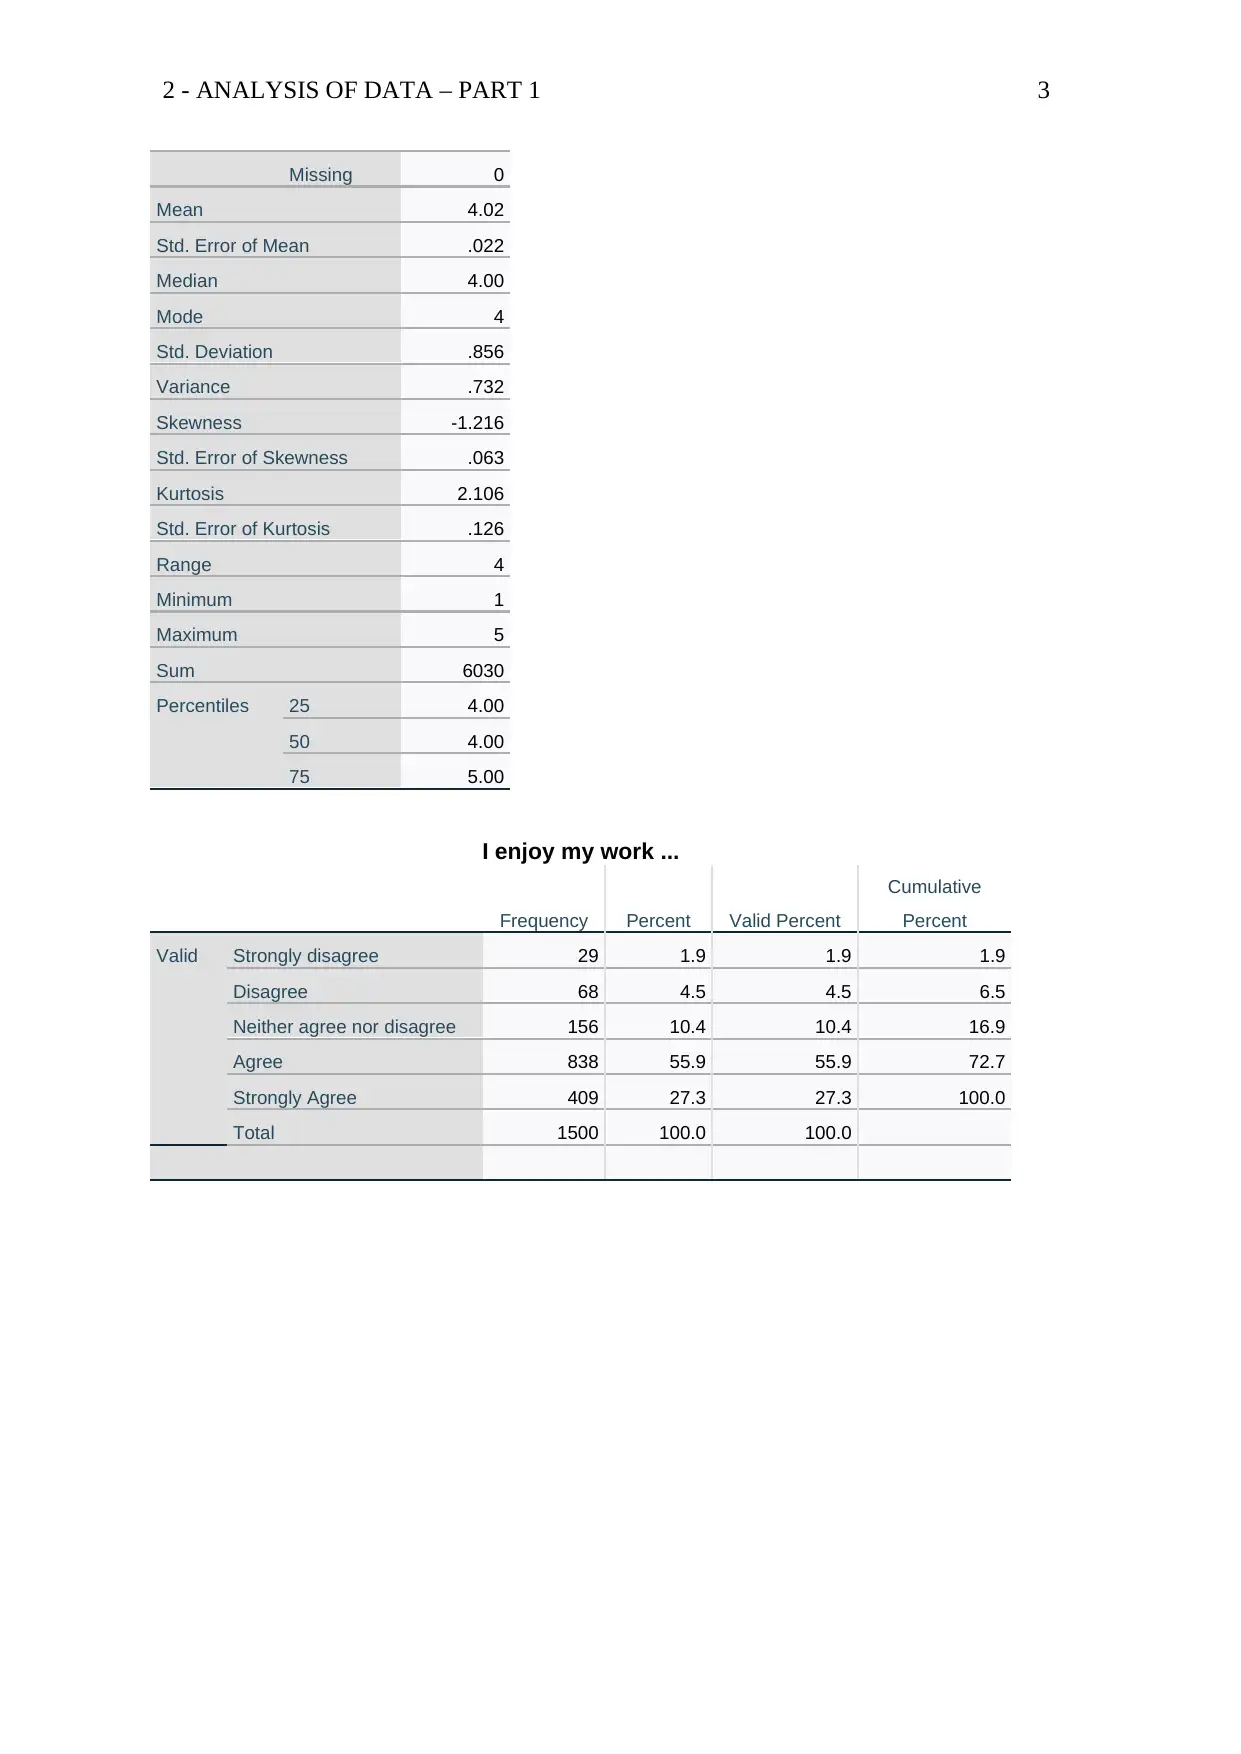
Statistics
I enjoy my work ...
N Valid 1500
2: Analysis of data – Part 1
Question 1 – Summary of a categorical variable
The variable ‘WorkEnjoyment’ indicates the extent to which each employee agrees
with the statement 'I enjoy my work'.
Produce the relevant graph and table to summarise the ‘WorkEnjoyment’ variable
and write a paragraph explaining the key features of the data observed in the output
in the style presented in the course materials.
Negatively skewed
83.2 % of people either agreed or strongly agreed they enjoyed their work
The data has shown that the majority of people (mean 4.02, mode 4) agreed
that they enjoyed their work.
Answer would go here.
In the survey of work environment has been conducted to analyze the number of
people loving their work. The question about ' I enjoy my work' was asked from 1500
respondents to know how many employees are satisfied with their work. It directly influence
the work environment and productivity of the organization as whole. The outcomes of the
analysis has been derived using the statistical analysis. It shows that the mean value is 4.02 of
the given data set of people is 4.02 and the standard deviation is 0.22 which shows that the
result shows very low variation from the mean value (Plonsky and Ghanbar, 2018). Mode is
4 which means that number of people who agree with the statement are more frequent as
compared with other. Variance is 0.732 for the given values and skewness is -1.216 and error
is 0.63 in skewness which means the symmetric measure is negative. On the other kurtosis is
2.106 which shows the data is heavy tailed relative to the normal distribution.
Question 1 – Summary of a categorical variable – SPSS Output
Output would go here.
Statistics
I enjoy my work ...
N Valid 1500
2 - ANALYSIS OF DATA – PART 1 3
Missing 0
Mean 4.02
Std. Error of Mean .022
Median 4.00
Mode 4
Std. Deviation .856
Variance .732
Skewness -1.216
Std. Error of Skewness .063
Kurtosis 2.106
Std. Error of Kurtosis .126
Range 4
Minimum 1
Maximum 5
Sum 6030
Percentiles 25 4.00
50 4.00
75 5.00
I enjoy my work ...
Frequency Percent Valid Percent
Cumulative
Percent
Valid Strongly disagree 29 1.9 1.9 1.9
Disagree 68 4.5 4.5 6.5
Neither agree nor disagree 156 10.4 10.4 16.9
Agree 838 55.9 55.9 72.7
Strongly Agree 409 27.3 27.3 100.0
Total 1500 100.0 100.0
⊘ This is a preview!⊘
Do you want full access?
Subscribe today to unlock all pages.
Trusted by 1+ million students worldwide
2 - ANALYSIS OF DATA – PART 1 4
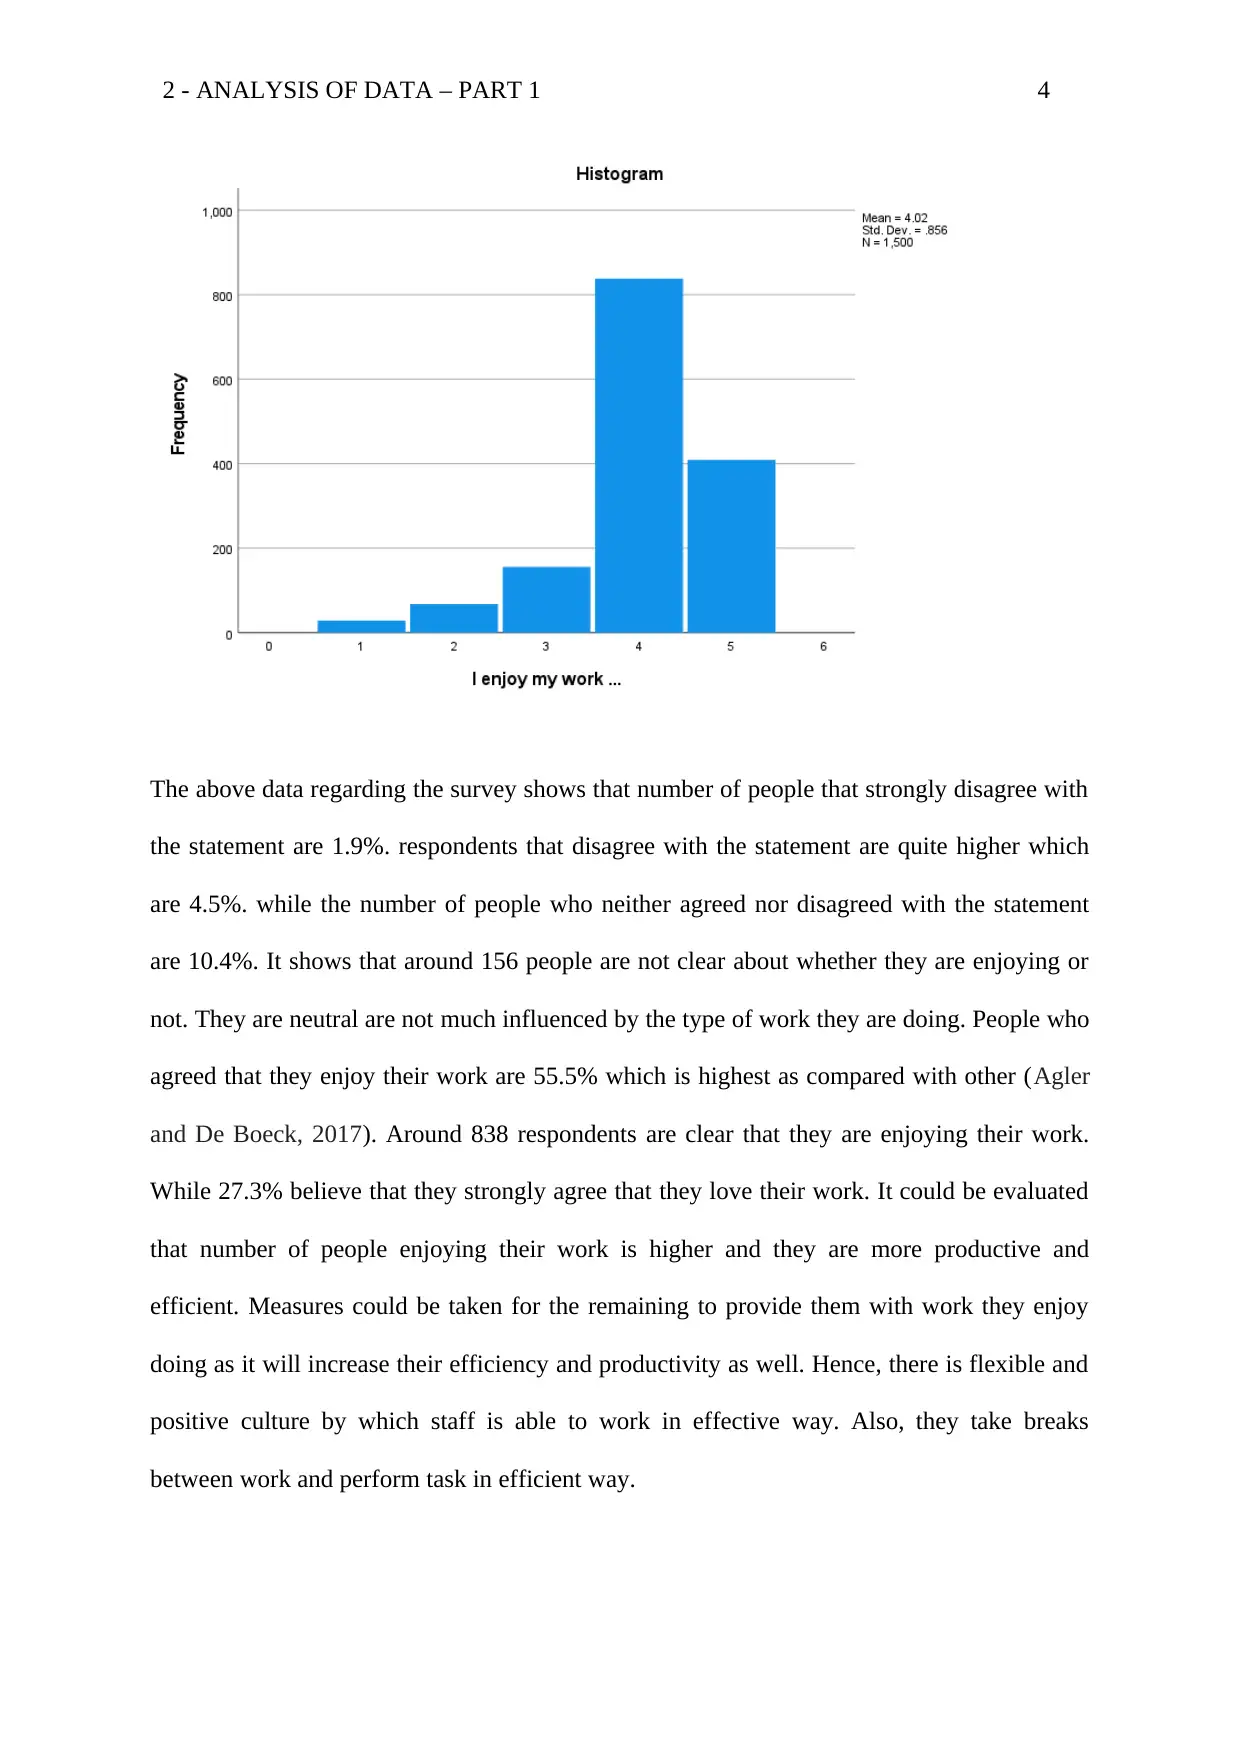
The above data regarding the survey shows that number of people that strongly disagree with
the statement are 1.9%. respondents that disagree with the statement are quite higher which
are 4.5%. while the number of people who neither agreed nor disagreed with the statement
are 10.4%. It shows that around 156 people are not clear about whether they are enjoying or
not. They are neutral are not much influenced by the type of work they are doing. People who
agreed that they enjoy their work are 55.5% which is highest as compared with other (Agler
and De Boeck, 2017). Around 838 respondents are clear that they are enjoying their work.
While 27.3% believe that they strongly agree that they love their work. It could be evaluated
that number of people enjoying their work is higher and they are more productive and
efficient. Measures could be taken for the remaining to provide them with work they enjoy
doing as it will increase their efficiency and productivity as well. Hence, there is flexible and
positive culture by which staff is able to work in effective way. Also, they take breaks
between work and perform task in efficient way.
Paraphrase This Document
Need a fresh take? Get an instant paraphrase of this document with our AI Paraphraser
2 - ANALYSIS OF DATA – PART 1 5
Question 2 – Summary of a metric variable
The variable ‘JobEngagement’ is a scale measurement that indicates how engaged
an employee is with the job they work in. This variable was measured on a scale that
can take values from 0 to 20, with higher values representing greater employee
engagement with their job.
Produce the relevant graph and tables to summarise the ‘JobEngagement’ variable
and write a paragraph explaining the key features of the data observed in the output
in the style presented in the course materials.
Answer would go here.
The job engagement means t active participation of the people in their jobs. It significantly
influences the effectiveness of the work and overall output. From the descriptive statistical
analysis it could be found that among the 1500 people 1452 had only responded to the
question. It could be evaluated that the mean value of the data is 15 which means most of the
employees are scaled at 15 for job engagement. The deviation from mean is 0.103 which is
not high. Median of data is 16 and mode is 18 means the most frequent scale used is 18 for
the job engagement. Skewness is -1.071 which there is lack of symmetry. Kurosis of 0.887
shows that it is heavy tailed.
Question 2 – Summary of a metric variable – SPSS Output
Output would go here.
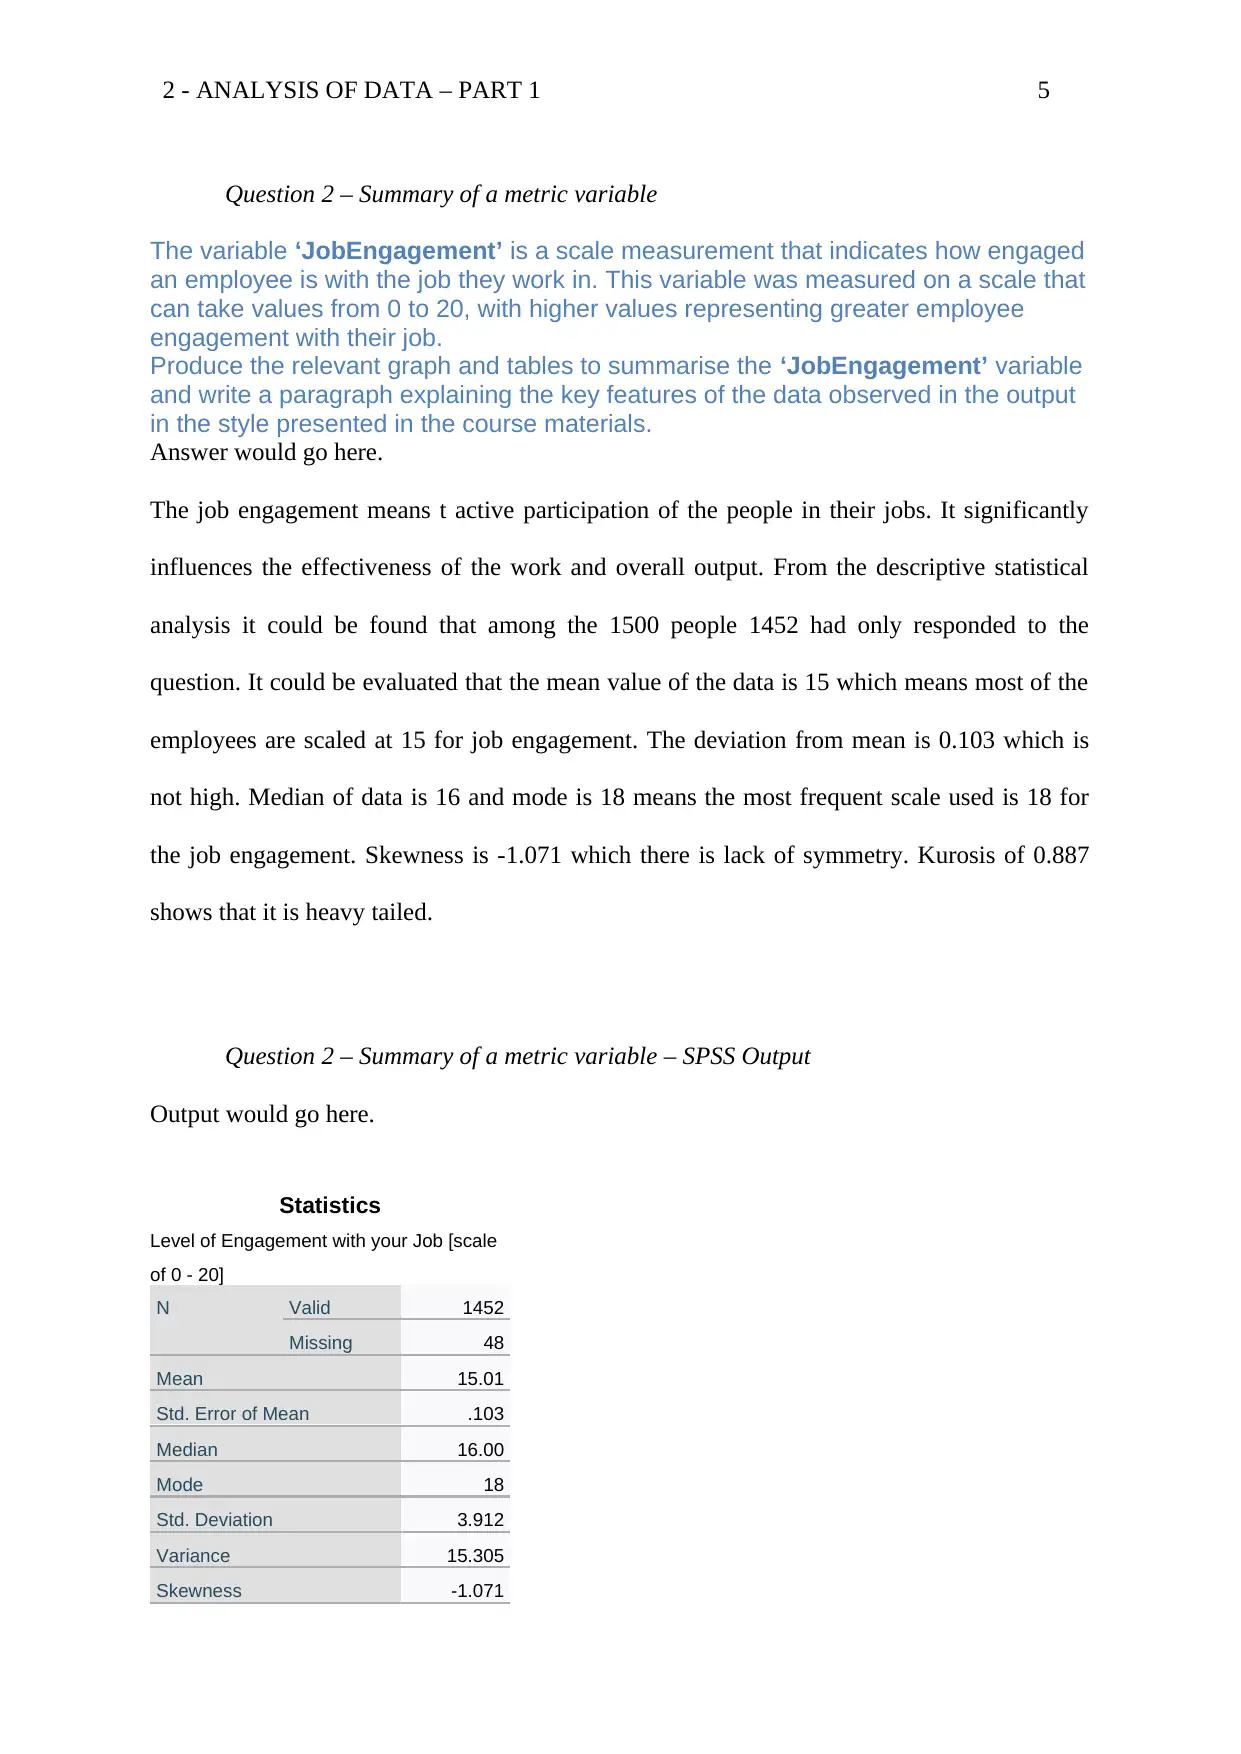
Statistics
Level of Engagement with your Job [scale
of 0 - 20]
N Valid 1452
Missing 48
Mean 15.01
Std. Error of Mean .103
Median 16.00
Mode 18
Std. Deviation 3.912
Variance 15.305
Skewness -1.071
Question 2 – Summary of a metric variable
The variable ‘JobEngagement’ is a scale measurement that indicates how engaged
an employee is with the job they work in. This variable was measured on a scale that
can take values from 0 to 20, with higher values representing greater employee
engagement with their job.
Produce the relevant graph and tables to summarise the ‘JobEngagement’ variable
and write a paragraph explaining the key features of the data observed in the output
in the style presented in the course materials.
Answer would go here.
The job engagement means t active participation of the people in their jobs. It significantly
influences the effectiveness of the work and overall output. From the descriptive statistical
analysis it could be found that among the 1500 people 1452 had only responded to the
question. It could be evaluated that the mean value of the data is 15 which means most of the
employees are scaled at 15 for job engagement. The deviation from mean is 0.103 which is
not high. Median of data is 16 and mode is 18 means the most frequent scale used is 18 for
the job engagement. Skewness is -1.071 which there is lack of symmetry. Kurosis of 0.887
shows that it is heavy tailed.
Question 2 – Summary of a metric variable – SPSS Output
Output would go here.
Statistics
Level of Engagement with your Job [scale
of 0 - 20]
N Valid 1452
Missing 48
Mean 15.01
Std. Error of Mean .103
Median 16.00
Mode 18
Std. Deviation 3.912
Variance 15.305
Skewness -1.071
2 - ANALYSIS OF DATA – PART 1 6
Std. Error of Skewness .064
Kurtosis .887
Std. Error of Kurtosis .128
Range 20
Minimum 0
Maximum 20
Sum 21795
Percentiles 25 13.00
50 16.00
75 18.00
Level of Engagement with your Job [scale of 0 - 20]
Frequency Percent Valid Percent
Cumulative
Percent
Valid 0 5 .3 .3 .3
1 8 .5 .6 .9
5 18 1.2 1.2 2.1
6 28 1.9 1.9 4.1
7 20 1.3 1.4 5.4
8 29 1.9 2.0 7.4
9 40 2.7 2.8 10.2
10 79 5.3 5.4 15.6
11 47 3.1 3.2 18.9
12 70 4.7 4.8 23.7
13 39 2.6 2.7 26.4
14 134 8.9 9.2 35.6
15 160 10.7 11.0 46.6
16 115 7.7 7.9 54.5
17 198 13.2 13.6 68.2
18 206 13.7 14.2 82.4
19 167 11.1 11.5 93.9
20 89 5.9 6.1 100.0
Total 1452 96.8 100.0
Missing System 48 3.2
Total 1500 100.0
⊘ This is a preview!⊘
Do you want full access?
Subscribe today to unlock all pages.
Trusted by 1+ million students worldwide
2 - ANALYSIS OF DATA – PART 1 7
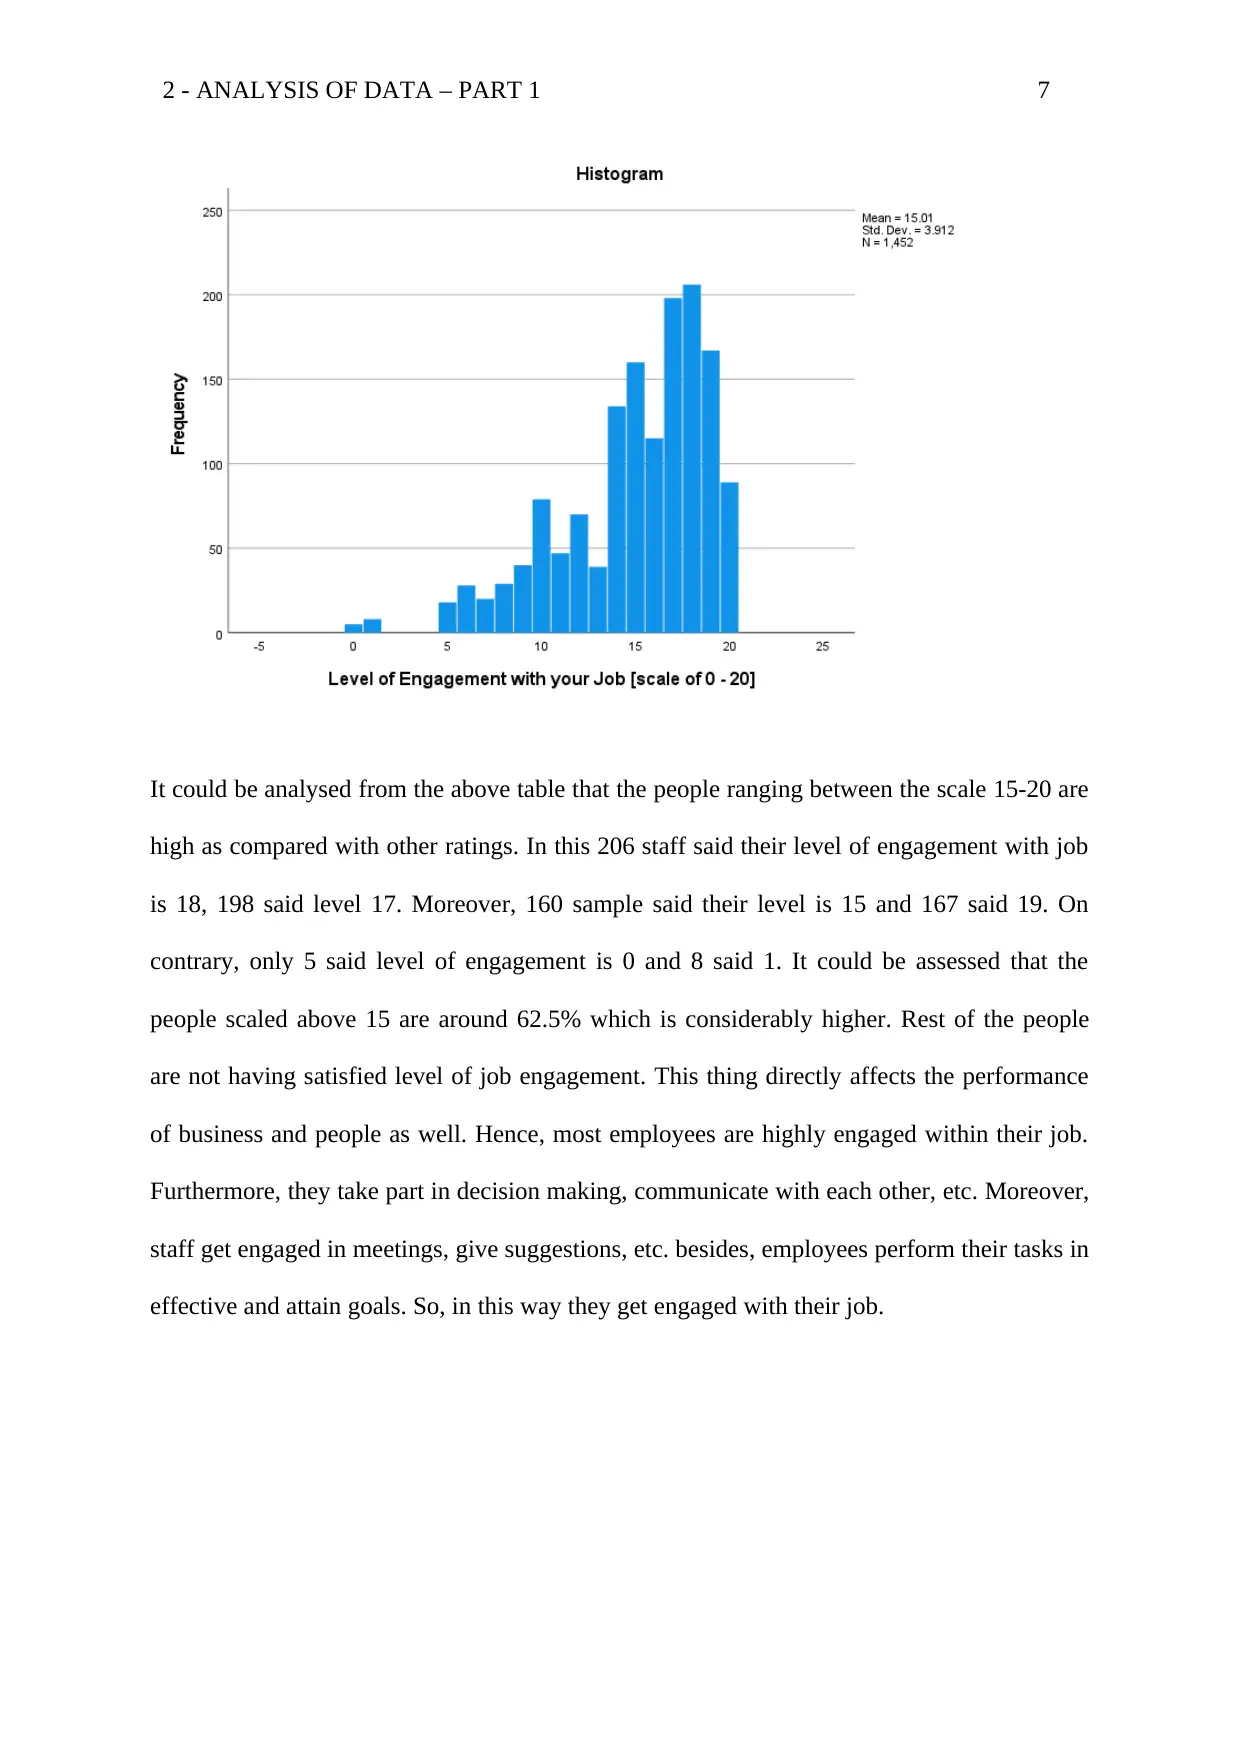
It could be analysed from the above table that the people ranging between the scale 15-20 are
high as compared with other ratings. In this 206 staff said their level of engagement with job
is 18, 198 said level 17. Moreover, 160 sample said their level is 15 and 167 said 19. On
contrary, only 5 said level of engagement is 0 and 8 said 1. It could be assessed that the
people scaled above 15 are around 62.5% which is considerably higher. Rest of the people
are not having satisfied level of job engagement. This thing directly affects the performance
of business and people as well. Hence, most employees are highly engaged within their job.
Furthermore, they take part in decision making, communicate with each other, etc. Moreover,
staff get engaged in meetings, give suggestions, etc. besides, employees perform their tasks in
effective and attain goals. So, in this way they get engaged with their job.
Paraphrase This Document
Need a fresh take? Get an instant paraphrase of this document with our AI Paraphraser
2 - ANALYSIS OF DATA – PART 1 8
Question 3 – Summary of a metric variable
The variable ‘AgencyEngagement’ is a scale measurement that indicates how
engaged an employee is with their Agency/Department. This variable was measured
on a scale that can take values from 0 to 20, with higher values representing greater
employee engagement with their Agency/Department. Produce the relevant graph
and tables to summarise the AgencyEngagement variable and write a paragraph
explaining the key features of the data observed in the output in the style presented
in the course materials.
Instructions
Produce the relevant graph and tables to summarise
the ‘AgencyEngagement’ variable and write a paragraph explaining the key
features of the data observed in the output in the style presented in the course
materials.
Produce the relevant graph and table to summarise
the ‘AgencyEngagement’ variable and write a paragraph explaining the key
features of the data observed in the output in the style presented in the course
materials.
Answer would go here.
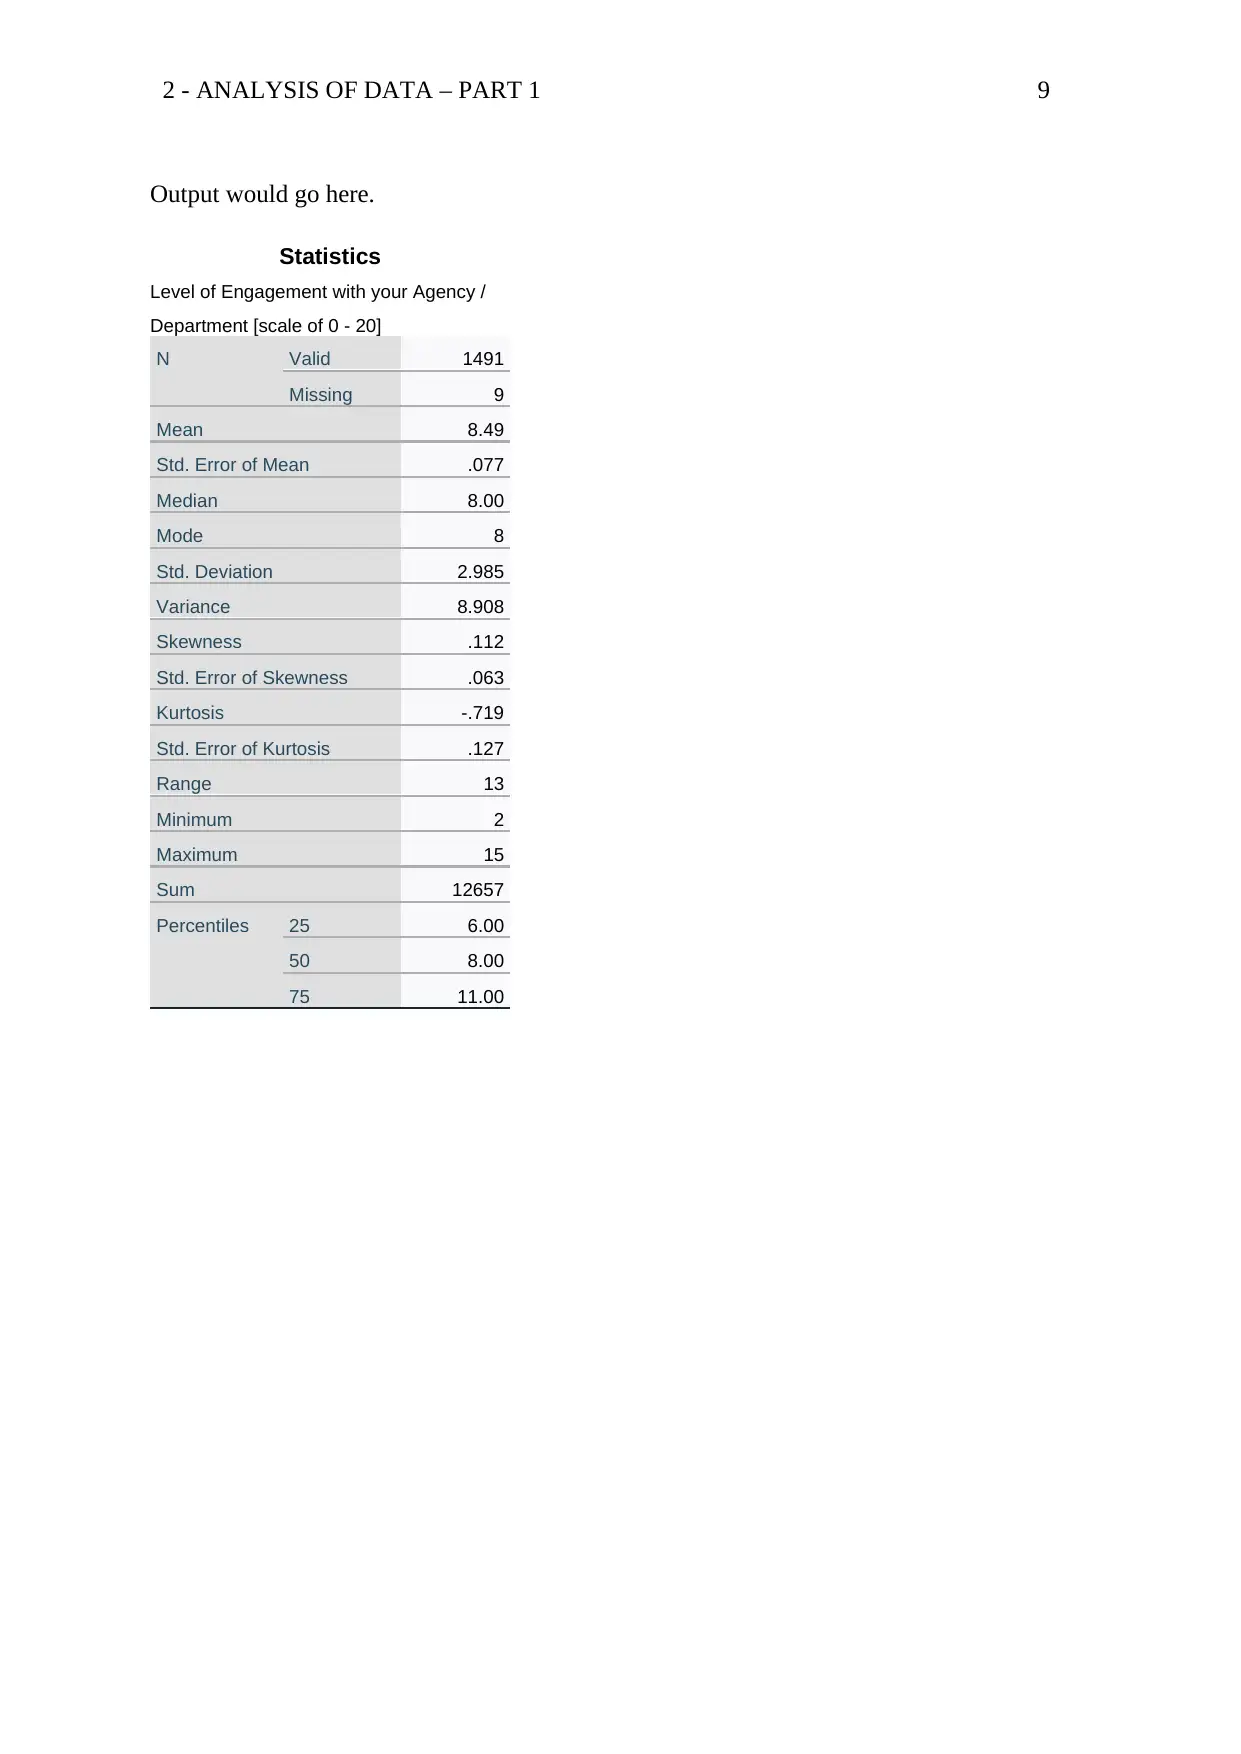
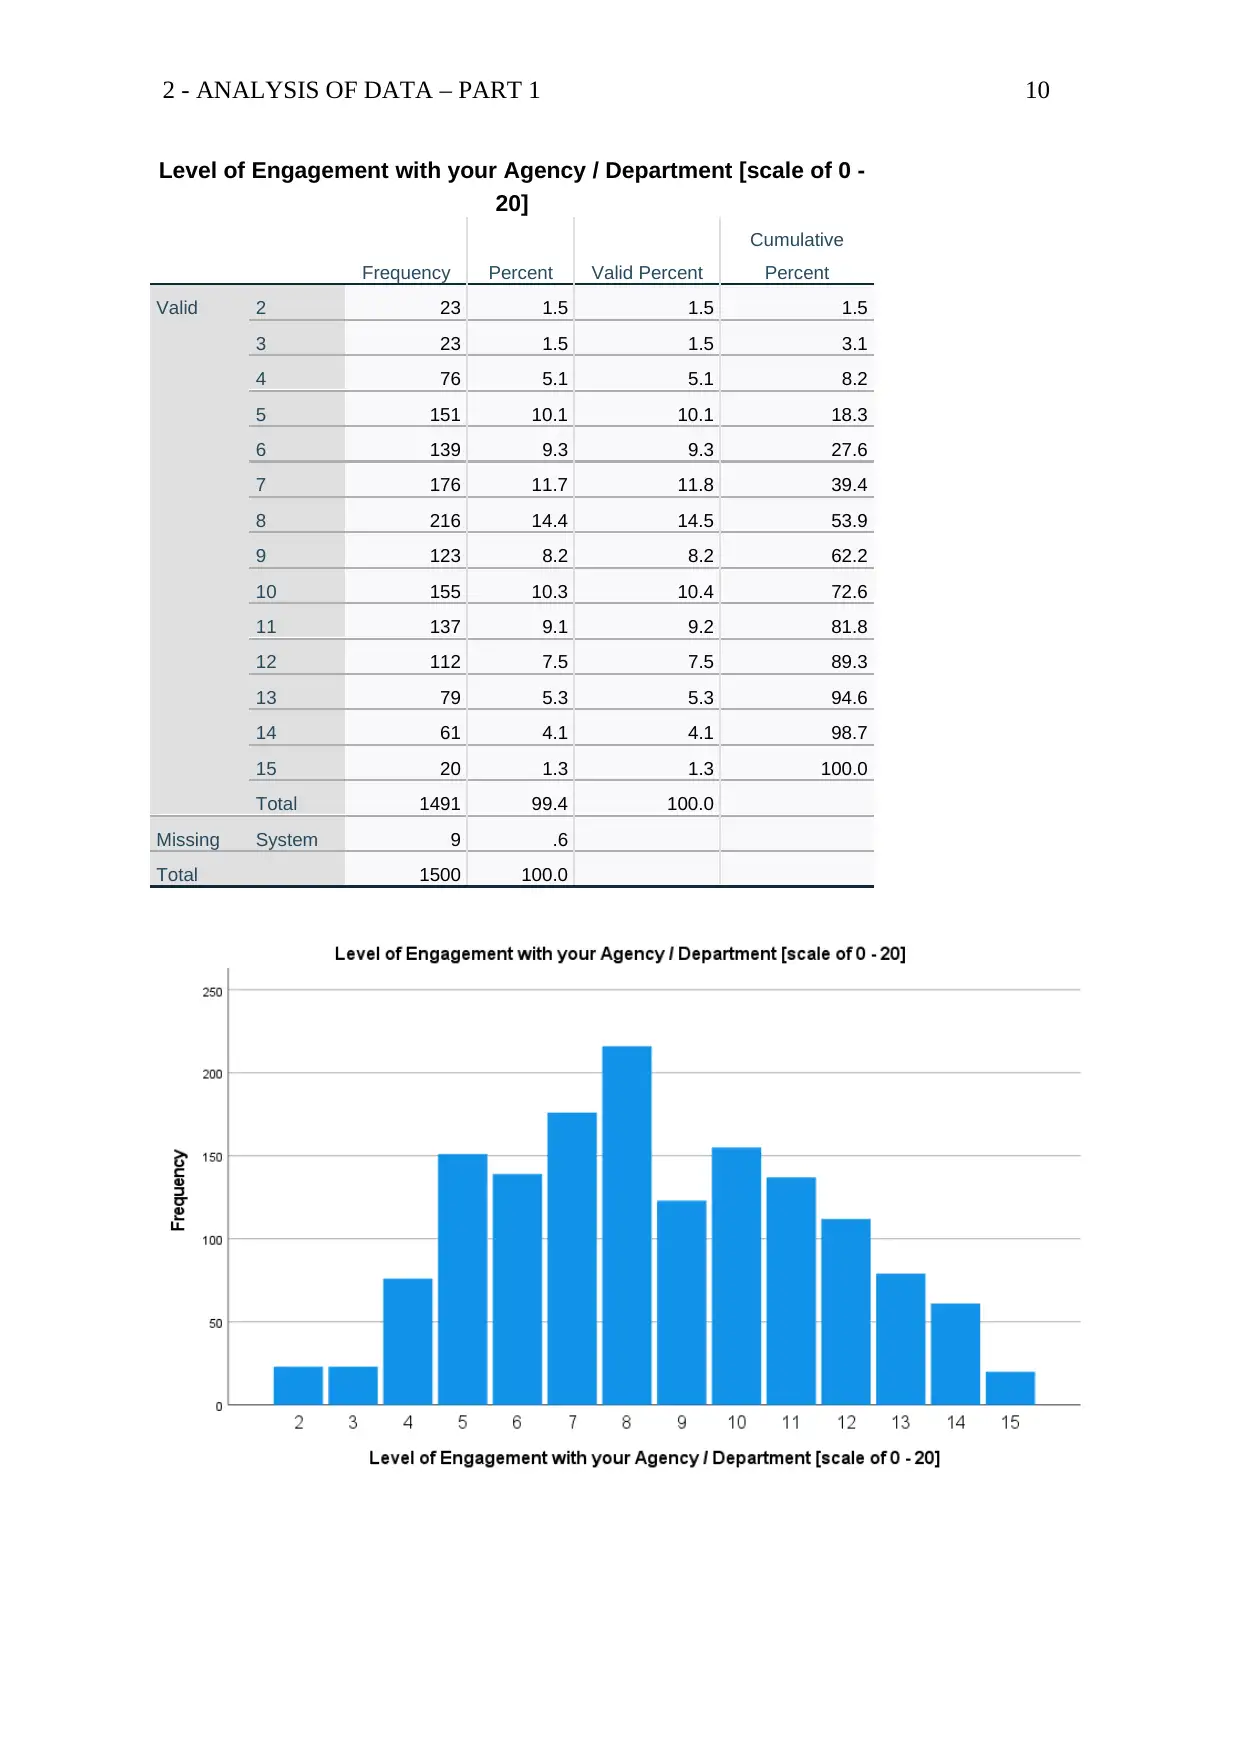
Interpretation – Here, a survey was done in which data of 1500 samples were taken. Thus, a
question were asked to measure how much employee is engaged with their department. By
analyzing table it can be summarized from table that mean value obtained is 8.49 and
standard deviation is .077. Besides that, median obtained is 8 and mode is also 8. So, it can
be stated that out of 1500 samples 216 number of staff said that their level of engagement is
8. Also, 176 said their level is 7. Then, it can be analysed that 155 employees said their level
of engagement is 10 and 151 said 5. Moreover, it is interpreted that 20 samples said that their
level of engagement is 15 and 23 each said for 2 and 3 level. Therefore, it is summarized that,
most employees are highly engaged with their agency department. So, with that they remain
engaged with their job. Moreover, they work in effective way with their department and
attain goals. Besides, there is regular communication with their department in regard of goals,
task to be done. In addition, employees are also engaged in decision making with department
so it leads to get engaged easily. Hence, with frequent discussion employee remain engaged.
Question 3 – Summary of a metric variable – SPSS Output
Question 3 – Summary of a metric variable
The variable ‘AgencyEngagement’ is a scale measurement that indicates how
engaged an employee is with their Agency/Department. This variable was measured
on a scale that can take values from 0 to 20, with higher values representing greater
employee engagement with their Agency/Department. Produce the relevant graph
and tables to summarise the AgencyEngagement variable and write a paragraph
explaining the key features of the data observed in the output in the style presented
in the course materials.
Instructions
Produce the relevant graph and tables to summarise
the ‘AgencyEngagement’ variable and write a paragraph explaining the key
features of the data observed in the output in the style presented in the course
materials.
Produce the relevant graph and table to summarise
the ‘AgencyEngagement’ variable and write a paragraph explaining the key
features of the data observed in the output in the style presented in the course
materials.
Answer would go here.
Interpretation – Here, a survey was done in which data of 1500 samples were taken. Thus, a
question were asked to measure how much employee is engaged with their department. By
analyzing table it can be summarized from table that mean value obtained is 8.49 and
standard deviation is .077. Besides that, median obtained is 8 and mode is also 8. So, it can
be stated that out of 1500 samples 216 number of staff said that their level of engagement is
8. Also, 176 said their level is 7. Then, it can be analysed that 155 employees said their level
of engagement is 10 and 151 said 5. Moreover, it is interpreted that 20 samples said that their
level of engagement is 15 and 23 each said for 2 and 3 level. Therefore, it is summarized that,
most employees are highly engaged with their agency department. So, with that they remain
engaged with their job. Moreover, they work in effective way with their department and
attain goals. Besides, there is regular communication with their department in regard of goals,
task to be done. In addition, employees are also engaged in decision making with department
so it leads to get engaged easily. Hence, with frequent discussion employee remain engaged.
Question 3 – Summary of a metric variable – SPSS Output
2 - ANALYSIS OF DATA – PART 1 9
Output would go here.
Statistics
Level of Engagement with your Agency /
Department [scale of 0 - 20]
N Valid 1491
Missing 9
Mean 8.49
Std. Error of Mean .077
Median 8.00
Mode 8
Std. Deviation 2.985
Variance 8.908
Skewness .112
Std. Error of Skewness .063
Kurtosis -.719
Std. Error of Kurtosis .127
Range 13
Minimum 2
Maximum 15
Sum 12657
Percentiles 25 6.00
50 8.00
75 11.00
⊘ This is a preview!⊘
Do you want full access?
Subscribe today to unlock all pages.
Trusted by 1+ million students worldwide
2 - ANALYSIS OF DATA – PART 1 10
Level of Engagement with your Agency / Department [scale of 0 -
20]
Frequency Percent Valid Percent
Cumulative
Percent
Valid 2 23 1.5 1.5 1.5
3 23 1.5 1.5 3.1
4 76 5.1 5.1 8.2
5 151 10.1 10.1 18.3
6 139 9.3 9.3 27.6
7 176 11.7 11.8 39.4
8 216 14.4 14.5 53.9
9 123 8.2 8.2 62.2
10 155 10.3 10.4 72.6
11 137 9.1 9.2 81.8
12 112 7.5 7.5 89.3
13 79 5.3 5.3 94.6
14 61 4.1 4.1 98.7
15 20 1.3 1.3 100.0
Total 1491 99.4 100.0
Missing System 9 .6
Total 1500 100.0
Paraphrase This Document
Need a fresh take? Get an instant paraphrase of this document with our AI Paraphraser
2 - ANALYSIS OF DATA – PART 1 11
Question 4 – Short answer question
James the postman is accused by his manager of being too slow in completing his mail
deliveries. James feels he is completing his designated routes within a reasonable amount of
time and calls for an investigation. He makes a point of recording the time it takes him to
complete each of his four routes and it turns out they each take 110 minutes.
On which of the following routes would James be considered unusually slow compared to the
other posties who deliver on the same routes?
Route 1 where the mean time is μ = 60 minutes and the standard deviation σ = 20 minutes.
Route 2 where the mean time is μ = 120 minutes and the standard deviation σ = 10 minutes.
Route 3 where the mean time is μ = 100 minutes and the standard deviation σ = 10 minutes.
Route 4 where the mean time is μ = 140 minutes and the standard deviation σ = 15 minutes.
On which of the routes would James be considered unusually slow compared to the
other posties who deliver on the same routes?
Justify your answer, quoting the relevant statistics as part of your explanation.
Assume the route times are normally distributed.
It can be analysed from above that James would have been slow in route 4 where the mean
time is 140 minute and SD is 15 minutes. This is because here average time of James is 110
that is less than 140. Thus, he is slow from this route from all others. Besides that, it is found
in all route mean time is 40, 120 and 100 that less than mean time of James of all 4 routes.
Therefore, it is justified james speed is less than route 4.
2 - ANALYSIS OF DATA – PART 1 12
Question 5 (a) – Short answer question
Answer would go here.
The Tinned Fruit Company introduced a new range of mid-sized tins of fruit earlier
this year. The company claims that the mean weight of these tins of fruit are on
average 200 g, with a standard deviation of 12 g. Recently however, a consumer
organization has received a number of complaints from consumers who believe that
the mean weight of their tins containing nectarines is actually less than 200 g. To
investigate this discrepancy, the consumer organization randomly selects 1500 tins
of nectarines produced in July and records the weight of these tins. This sample is
then used to assess whether the company is marketing tins of nectarines that weigh
on average less than 200g.
What is the population we can draw conclusions about in this study?
From study it can be examined that population taken is of tins of fruit which mean value is
200g. thus, here sample of 1500 tins are taken as sample size. Besides that, average of mean
of population is 200g. also, sample taken is of nectarines produced in July. Also, equal weigh
of all 1500 tins is taken from population.
⊘ This is a preview!⊘
Do you want full access?
Subscribe today to unlock all pages.
Trusted by 1+ million students worldwide
1 out of 16

Your All-in-One AI-Powered Toolkit for Academic Success.
+13062052269
info@desklib.com
Available 24*7 on WhatsApp / Email
![[object Object]](/_next/static/media/star-bottom.7253800d.svg)
Unlock your academic potential
Copyright © 2020–2026 A2Z Services. All Rights Reserved. Developed and managed by ZUCOL.