Correlation Between Employee Turnover and Performance at Ford Motors

Verified

Added on  2020/04/01

|10
|1683
|208
Report
AI Summary
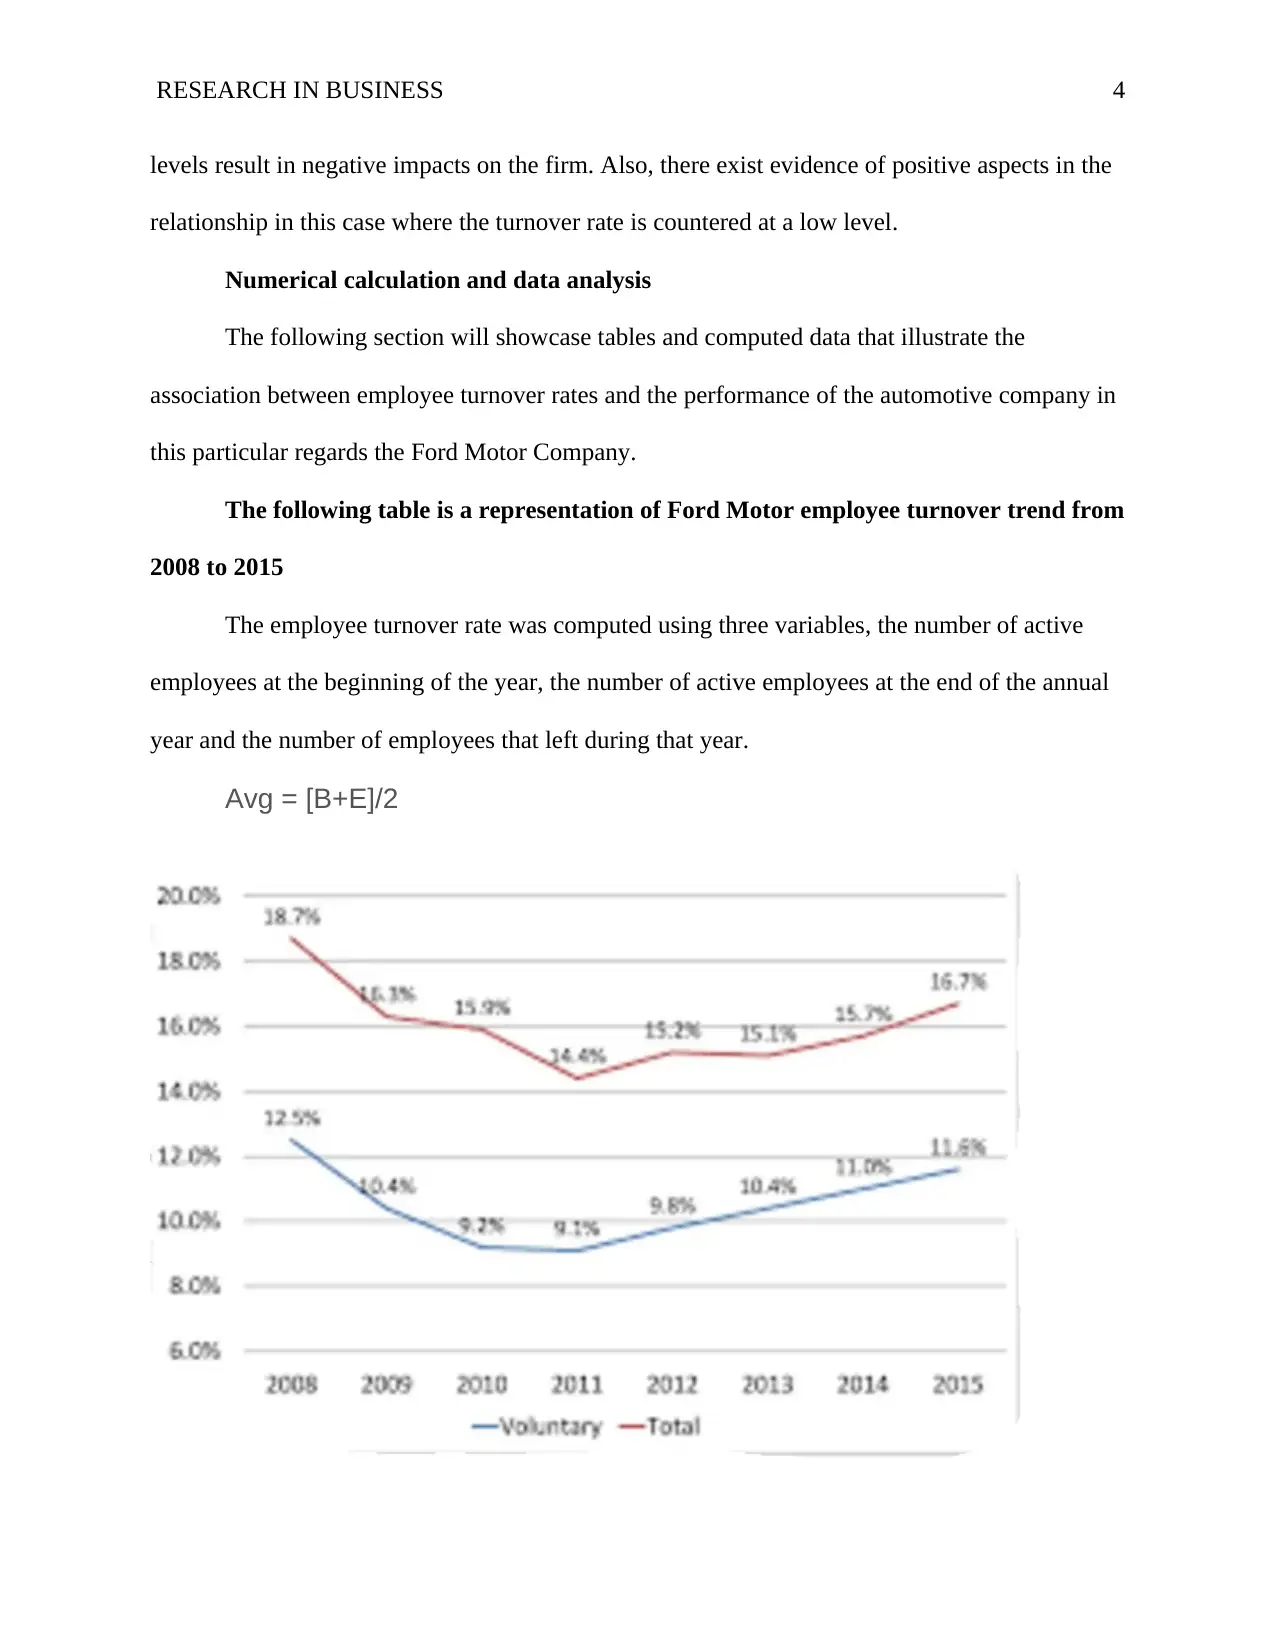
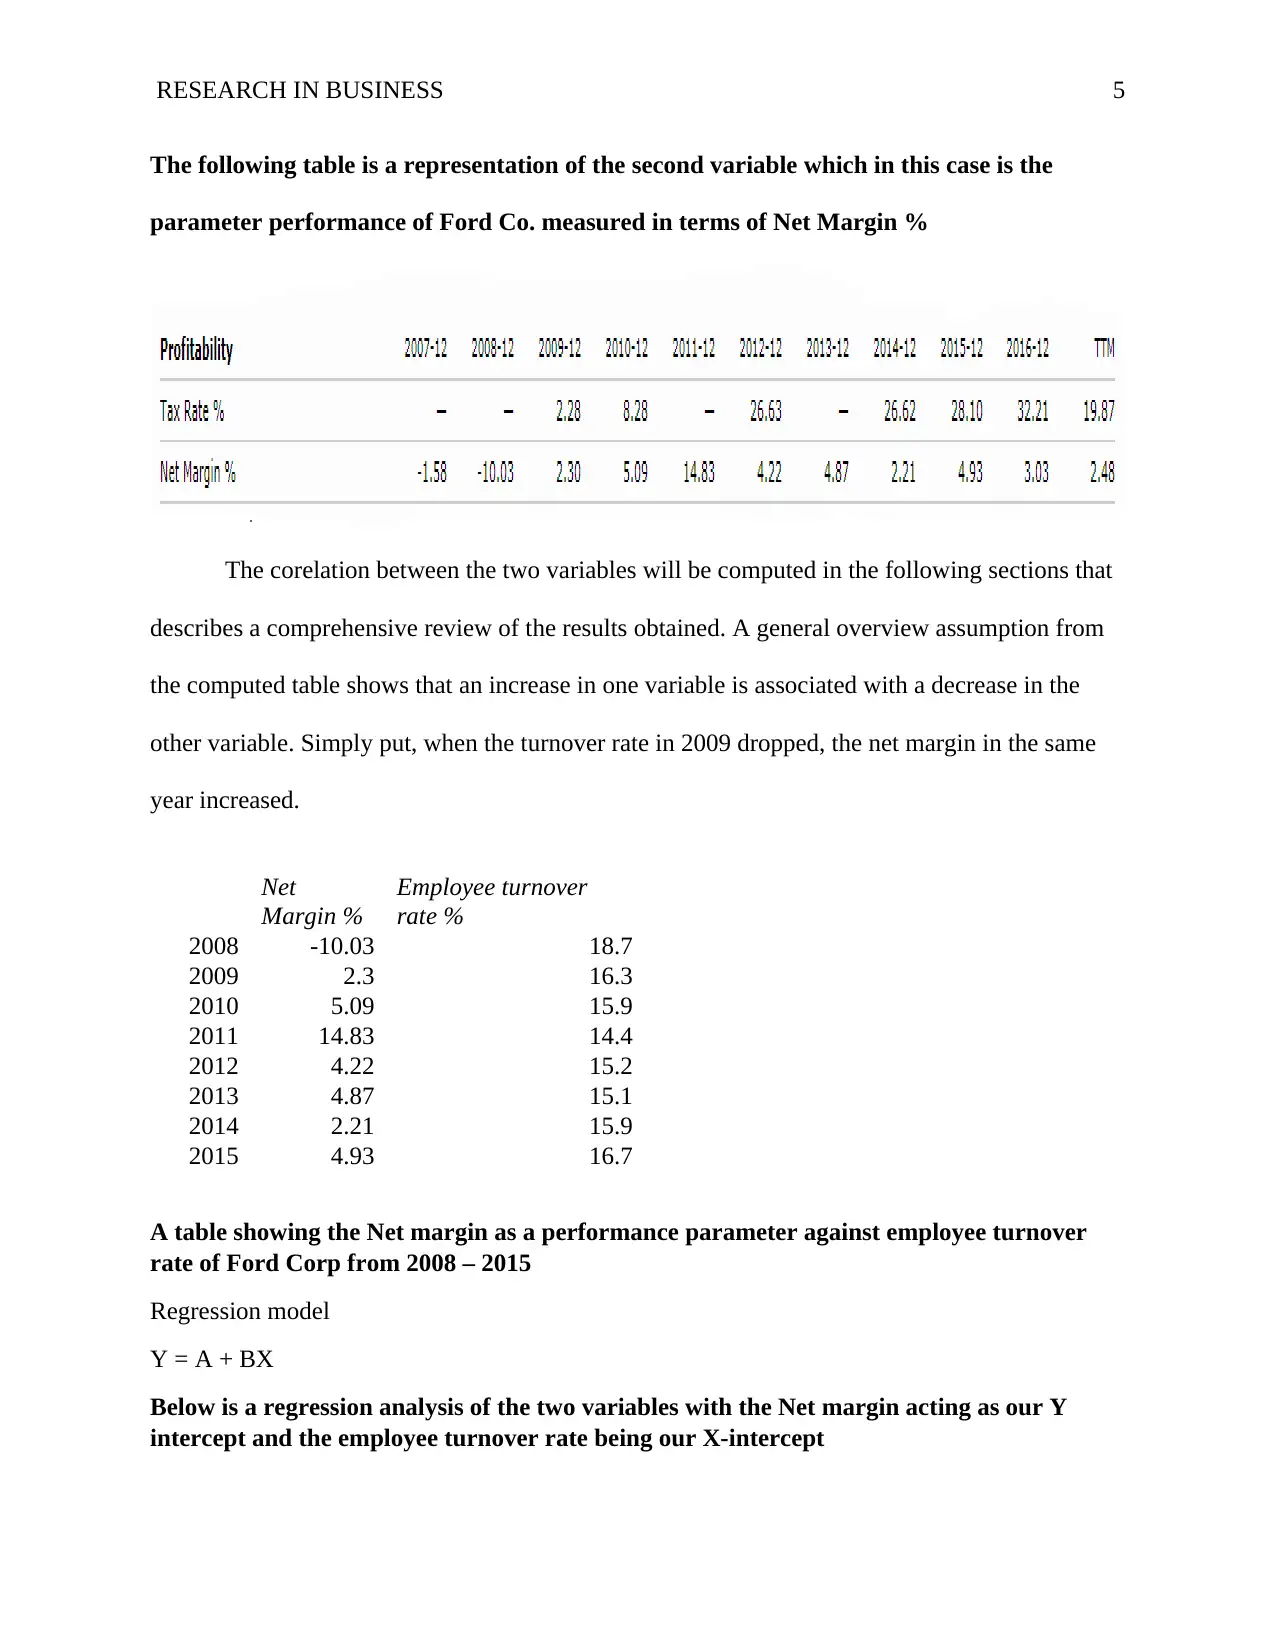
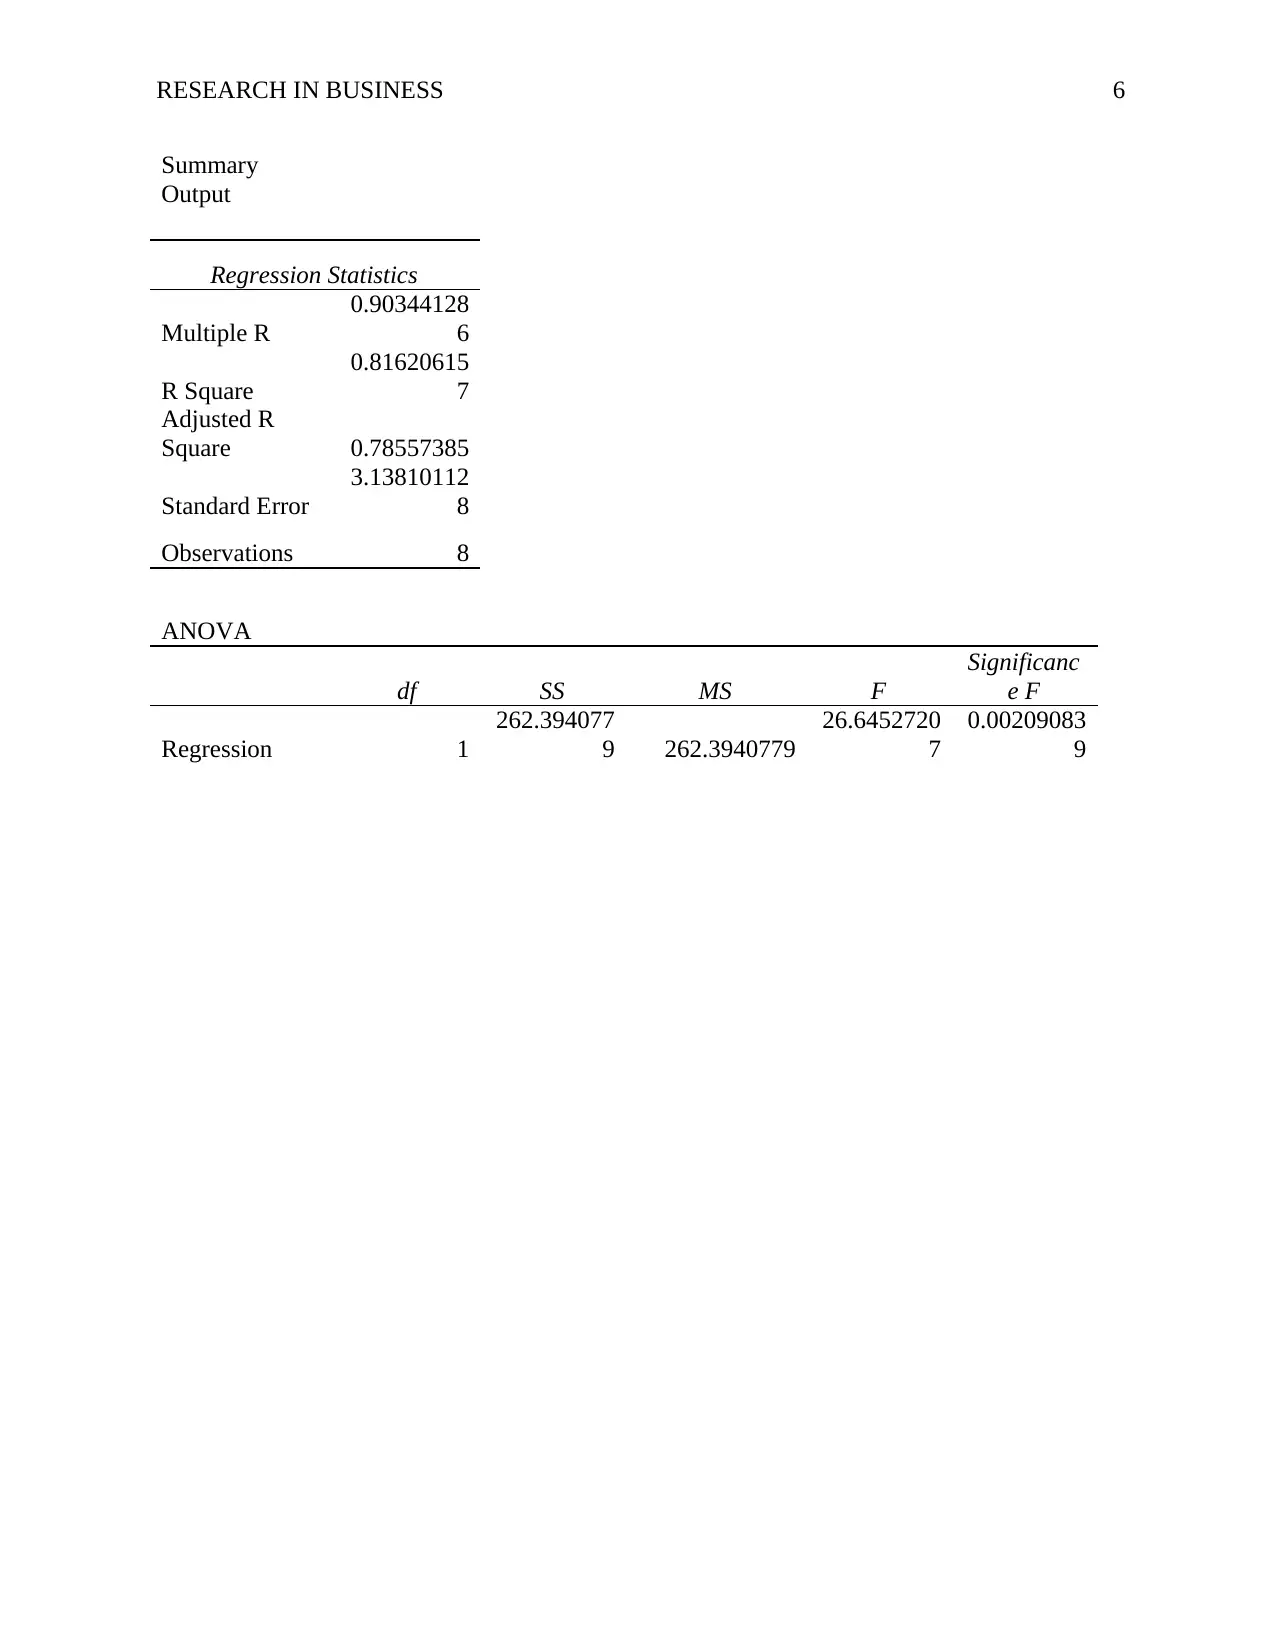
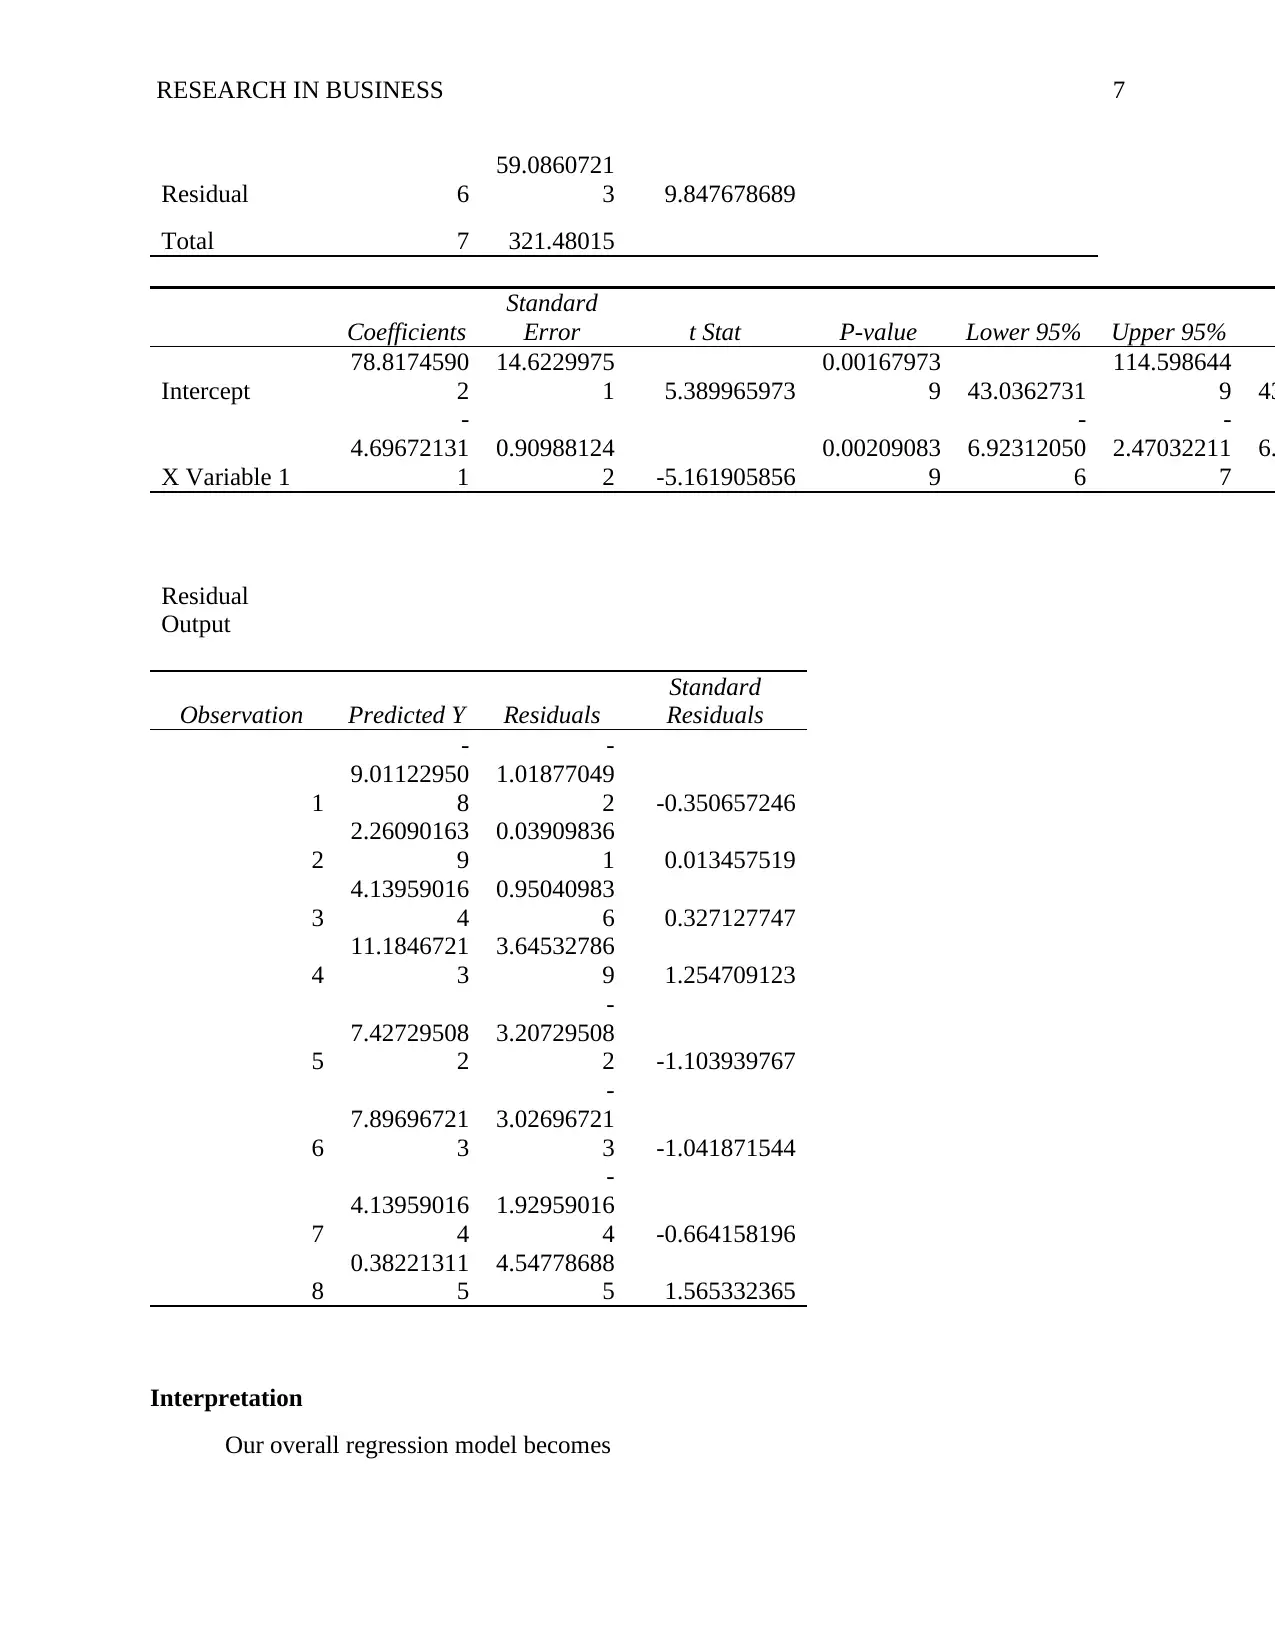
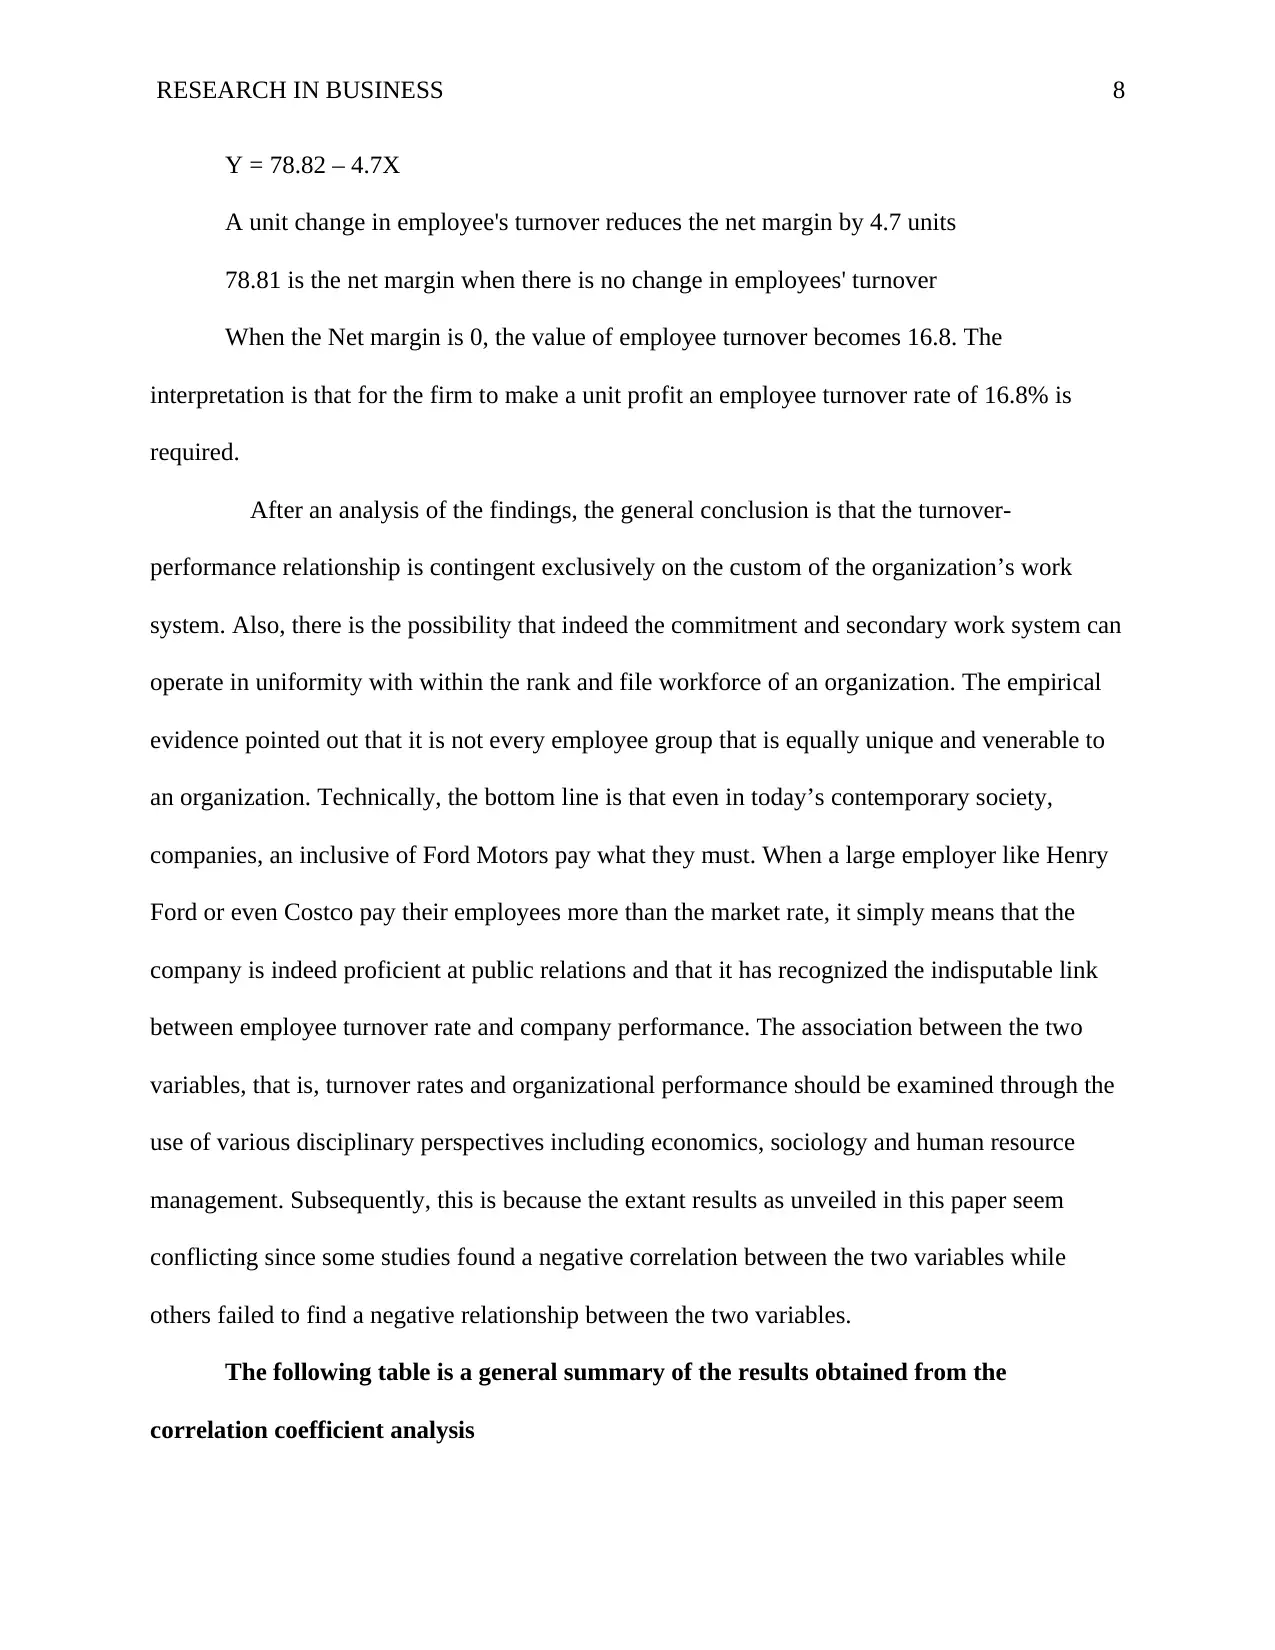
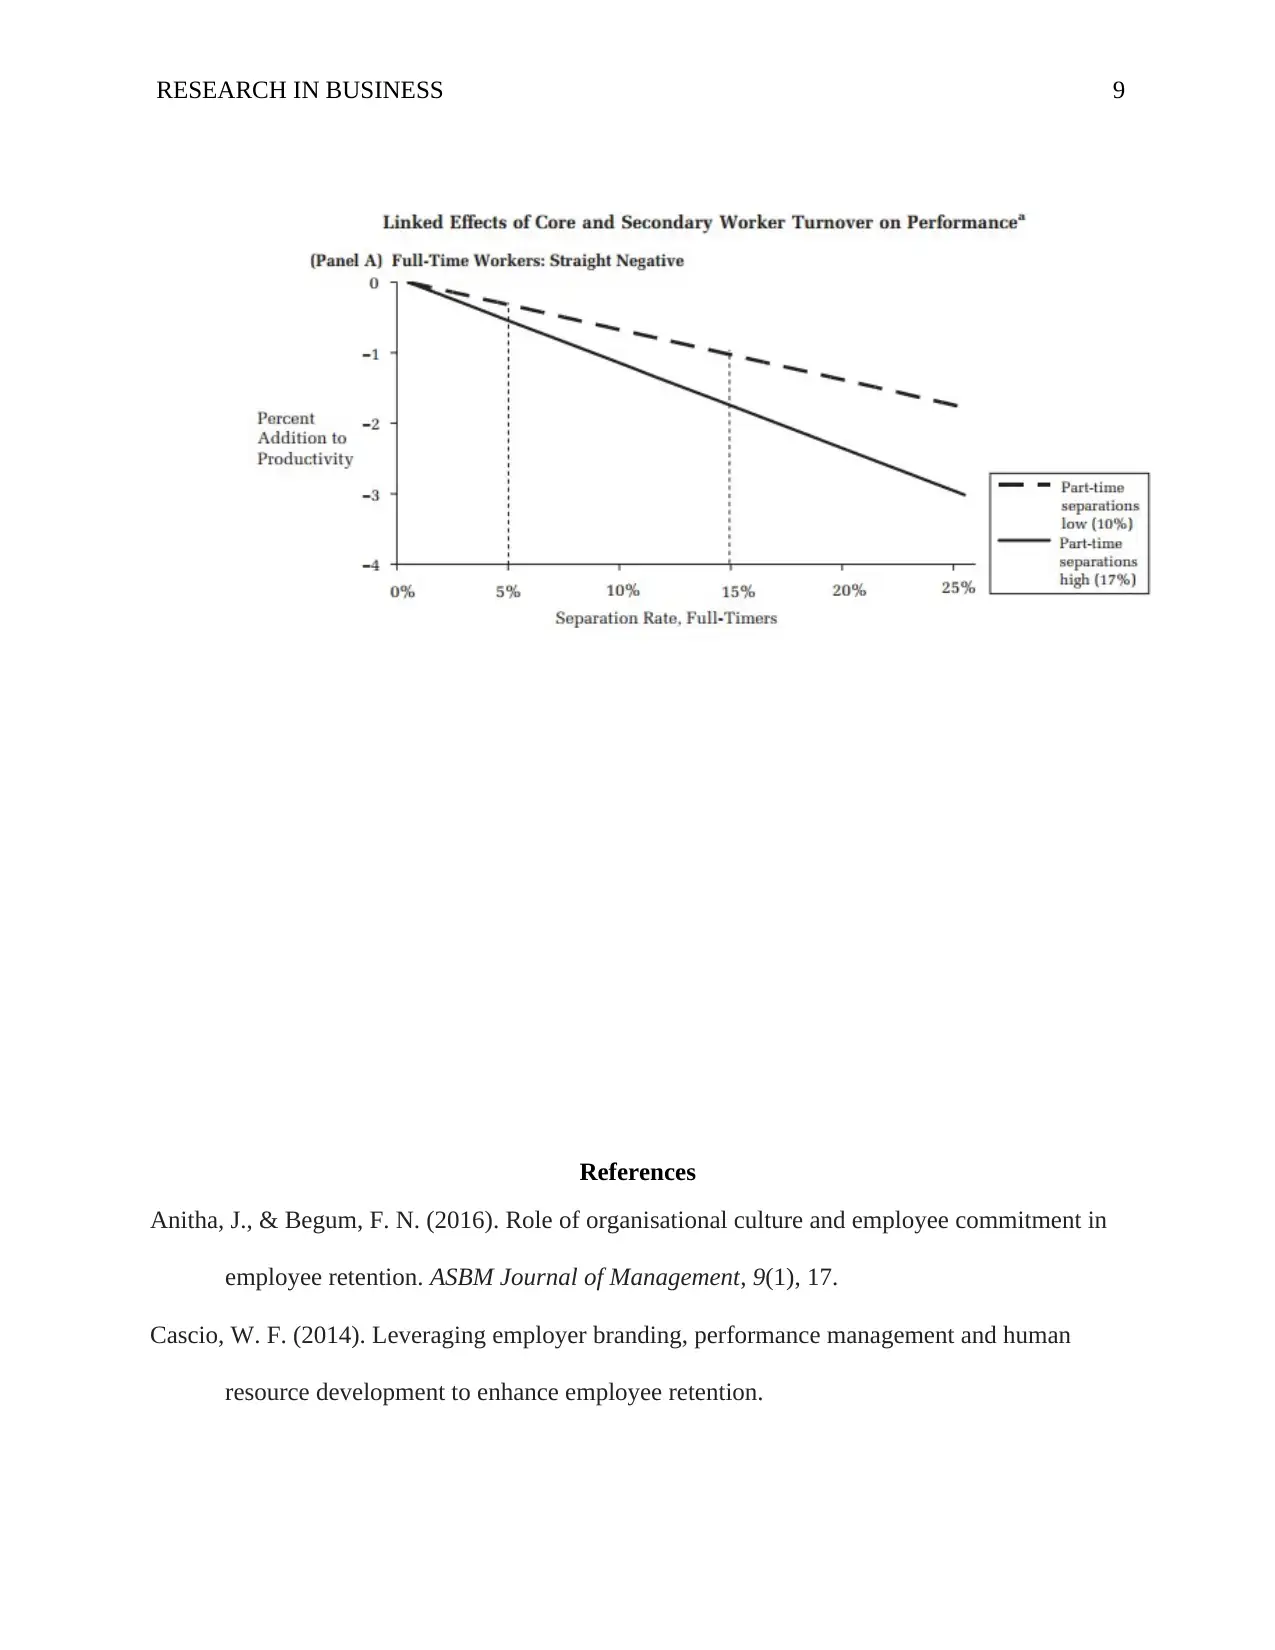
This report investigates the relationship between employee turnover and performance at Ford Motor Company. The study examines the correlation between employee turnover rates and the company's net margin, utilizing data from 2008 to 2015. Regression analysis is performed to determine the impact of employee turnover on performance. The research explores the theoretical framework of human capital and its relevance to the automotive industry, considering factors such as employee satisfaction, social relationships, and the effects of turnover on the company's overall success. The report concludes that there is a strong negative correlation between employee turnover and the performance of Ford Motors, providing a detailed analysis of the data and results obtained, along with interpretations of the regression model. The report also references relevant studies and literature to support the findings, examining the relationship between the two variables from various disciplinary perspectives.
Document Page
Running head: RESEARCH IN BUSINESS 1
Research in business
Name
Institution
tabler-icon-diamond-filled.svg

Paraphrase This Document

Need a fresh take? Get an instant paraphrase of this document with our AI Paraphraser
Document Page
RESEARCH IN BUSINESS 2
Research in Business
Ford Motor Company, is a company that has had its fair share of business success and
downfalls. Technically, a standard scenario is that in which an organization achieves a
comfortable and front-line lead regarding competition. As a result, its media coverage goes up as
well as shareholders satisfaction is also on the rise. However, most of the time complacency will
set in and in return, this will the projected continuous improvement that is vital for growth. In the
worst case scenario, the company will lose its vision, and this results in the most talented people
leaving first, and soon enough brokenness abounds. One primary ideology that Ford motors have
held on to is the idea that staying competitive requires more than the concept of improving
numbers. The problem is also not embedded on declining sales, negative cash flow, slumping
profit margins and rising debt levels. Some of the important aspects that have been pointed out
by the automobile giant enterprise are the variables of employee turnover rate which in this case
will be analyzed as the first variable and performance parameter which is the second variable.
The paper will in an in-depth analysis examine the correlation between employee turnover rate
and performance parameter in Ford Co. in the last 5 to 10 years. Computation of numerical
calculations and data analysis will also be used in support of the conclusions found.
Theoretical, as well as empirical research, points out that there indeed exists a perfect
negative correlation between employee retention rates and a performance parameter.
Subsequently, this simply means that an increase in variable x, let’s say in this case employee
turnover rate is associated with a decrease in variable y which is the company performance.
Employee turnover can be explained in different dimensions, at times, it is as a result of an
attraction of a new job, or they are pushed due to a series of dissatisfaction or the push and pull
factors (Chen, Feldmann & Tang, 2015). Technically, the importance of maintaining qualified
Document Page
RESEARCH IN BUSINESS 3
employees for the general success of the organization is a concept that is well versed with Ford
Co. The theory of human capital by Becker is well versed in indicating the relationship between
the two variables. However, one of the challenges that are particularly on the increase in the
organization is the increase in the interdependence of various social actors and the society in
general. Simply put, this means that social relationships and self-initiative of employees
regarding anticipation and implementation of changes are gaining more grounds not only in the
organization but across the automobile industry (Lee, Hom, Eberly & Li, 2017). In the same
perspective, losing employee tends to be more detrimental to enterprises. The results of the
investigations in Ford Motors agreed with previous assumptions that there is a strong negative
correlation that indeed exists between worker turnover and the performance level of the
institution. Ford motors have been classified as one of the organizations in the automobile
industry with amongst the lowest employee turnover trend.
Drawing from a relevant secondary material, more light can be shed in attempts to
explain the association between the two variables. More recently, Shaw, Gupta, and Delery
(2005) pointed out that the relation between the turnover and performance parameter is not linear
because negative effects are attenuated as the rate of turnover increases. Technically, this simply
means that turnover rates are technically more harmful at the start of the curve than it is at the
end of the curve especially with high indicators. However, the management of Ford Co. is also
making attempts to examine whether the relationship between the two variables is always
negative (Purl, Hall, & Griffeth, 2016). Through this, they are mitigating towards examining
more positive dimensions like discussing the organizational, social, economic and psychological
effects (Cascio, 2014). From the results of this process, the company found that high rotation
Document Page
RESEARCH IN BUSINESS 4
levels result in negative impacts on the firm. Also, there exist evidence of positive aspects in the
relationship in this case where the turnover rate is countered at a low level.
Numerical calculation and data analysis
The following section will showcase tables and computed data that illustrate the
association between employee turnover rates and the performance of the automotive company in
this particular regards the Ford Motor Company.
The following table is a representation of Ford Motor employee turnover trend from
2008 to 2015
The employee turnover rate was computed using three variables, the number of active
employees at the beginning of the year, the number of active employees at the end of the annual
year and the number of employees that left during that year.
Avg = [B+E]/2
tabler-icon-diamond-filled.svg

Paraphrase This Document

Need a fresh take? Get an instant paraphrase of this document with our AI Paraphraser
Document Page
RESEARCH IN BUSINESS 5
The following table is a representation of the second variable which in this case is the
parameter performance of Ford Co. measured in terms of Net Margin %
The corelation between the two variables will be computed in the following sections that
describes a comprehensive review of the results obtained. A general overview assumption from
the computed table shows that an increase in one variable is associated with a decrease in the
other variable. Simply put, when the turnover rate in 2009 dropped, the net margin in the same
year increased.
Net
Margin %
Employee turnover
rate %
2008 -10.03 18.7
2009 2.3 16.3
2010 5.09 15.9
2011 14.83 14.4
2012 4.22 15.2
2013 4.87 15.1
2014 2.21 15.9
2015 4.93 16.7
A table showing the Net margin as a performance parameter against employee turnover
rate of Ford Corp from 2008 – 2015
Regression model
Y = A + BX
Below is a regression analysis of the two variables with the Net margin acting as our Y
intercept and the employee turnover rate being our X-intercept
Document Page
RESEARCH IN BUSINESS 6
Summary
Output
Regression Statistics
Multiple R
0.90344128
6
R Square
0.81620615
7
Adjusted R
Square 0.78557385
Standard Error
3.13810112
8
Observations 8
ANOVA
df SS MS F
Significanc
e F
Regression 1
262.394077
9 262.3940779
26.6452720
7
0.00209083
9
Document Page
RESEARCH IN BUSINESS 7
Residual 6
59.0860721
3 9.847678689
Total 7 321.48015
Coefficients
Standard
Error t Stat P-value Lower 95% Upper 95%
Intercept
78.8174590
2
14.6229975
1 5.389965973
0.00167973
9 43.0362731
114.598644
9 43
X Variable 1
-
4.69672131
1
0.90988124
2 -5.161905856
0.00209083
9
-
6.92312050
6
-
2.47032211
7
6.
Residual
Output
Observation Predicted Y Residuals
Standard
Residuals
1
-
9.01122950
8
-
1.01877049
2 -0.350657246
2
2.26090163
9
0.03909836
1 0.013457519
3
4.13959016
4
0.95040983
6 0.327127747
4
11.1846721
3
3.64532786
9 1.254709123
5
7.42729508
2
-
3.20729508
2 -1.103939767
6
7.89696721
3
-
3.02696721
3 -1.041871544
7
4.13959016
4
-
1.92959016
4 -0.664158196
8
0.38221311
5
4.54778688
5 1.565332365
Interpretation
Our overall regression model becomes
tabler-icon-diamond-filled.svg

Paraphrase This Document

Need a fresh take? Get an instant paraphrase of this document with our AI Paraphraser
Document Page
RESEARCH IN BUSINESS 8
Y = 78.82 – 4.7X
A unit change in employee's turnover reduces the net margin by 4.7 units
78.81 is the net margin when there is no change in employees' turnover
When the Net margin is 0, the value of employee turnover becomes 16.8. The
interpretation is that for the firm to make a unit profit an employee turnover rate of 16.8% is
required.
After an analysis of the findings, the general conclusion is that the turnover-
performance relationship is contingent exclusively on the custom of the organization’s work
system. Also, there is the possibility that indeed the commitment and secondary work system can
operate in uniformity with within the rank and file workforce of an organization. The empirical
evidence pointed out that it is not every employee group that is equally unique and venerable to
an organization. Technically, the bottom line is that even in today’s contemporary society,
companies, an inclusive of Ford Motors pay what they must. When a large employer like Henry
Ford or even Costco pay their employees more than the market rate, it simply means that the
company is indeed proficient at public relations and that it has recognized the indisputable link
between employee turnover rate and company performance. The association between the two
variables, that is, turnover rates and organizational performance should be examined through the
use of various disciplinary perspectives including economics, sociology and human resource
management. Subsequently, this is because the extant results as unveiled in this paper seem
conflicting since some studies found a negative correlation between the two variables while
others failed to find a negative relationship between the two variables.
The following table is a general summary of the results obtained from the
correlation coefficient analysis
Document Page
RESEARCH IN BUSINESS 9
References
Anitha, J., & Begum, F. N. (2016). Role of organisational culture and employee commitment in
employee retention. ASBM Journal of Management, 9(1), 17.
Cascio, W. F. (2014). Leveraging employer branding, performance management and human
resource development to enhance employee retention.
Document Page
RESEARCH IN BUSINESS
10
Chen, L., Feldmann, A., & Tang, O. (2015). The relationship between disclosures of corporate
social performance and financial performance: Evidences from GRI reports in
manufacturing industry. International Journal of Production Economics, 170, 445-456.
Lee, T. W., Hom, P., Eberly, M., & Li, J. J. (2017). Managing employee retention and turnover
with 21st century ideas. Organizational Dynamics.
Purl, J., Hall, K. E., & Griffeth, R. W. (2016). 12. A diagnostic methodology for discovering the
reasons for employee turnover using shocks and events. Research Handbook on
Employee Turnover, 213.
chevron_up_icon
1 out of 10
circle_padding
hide_on_mobile
zoom_out_icon
[object Object]