BB108 Business Statistics: Employee Satisfaction Report Analysis
VerifiedAdded on 2022/11/13
|9
|1607
|207
Report
AI Summary
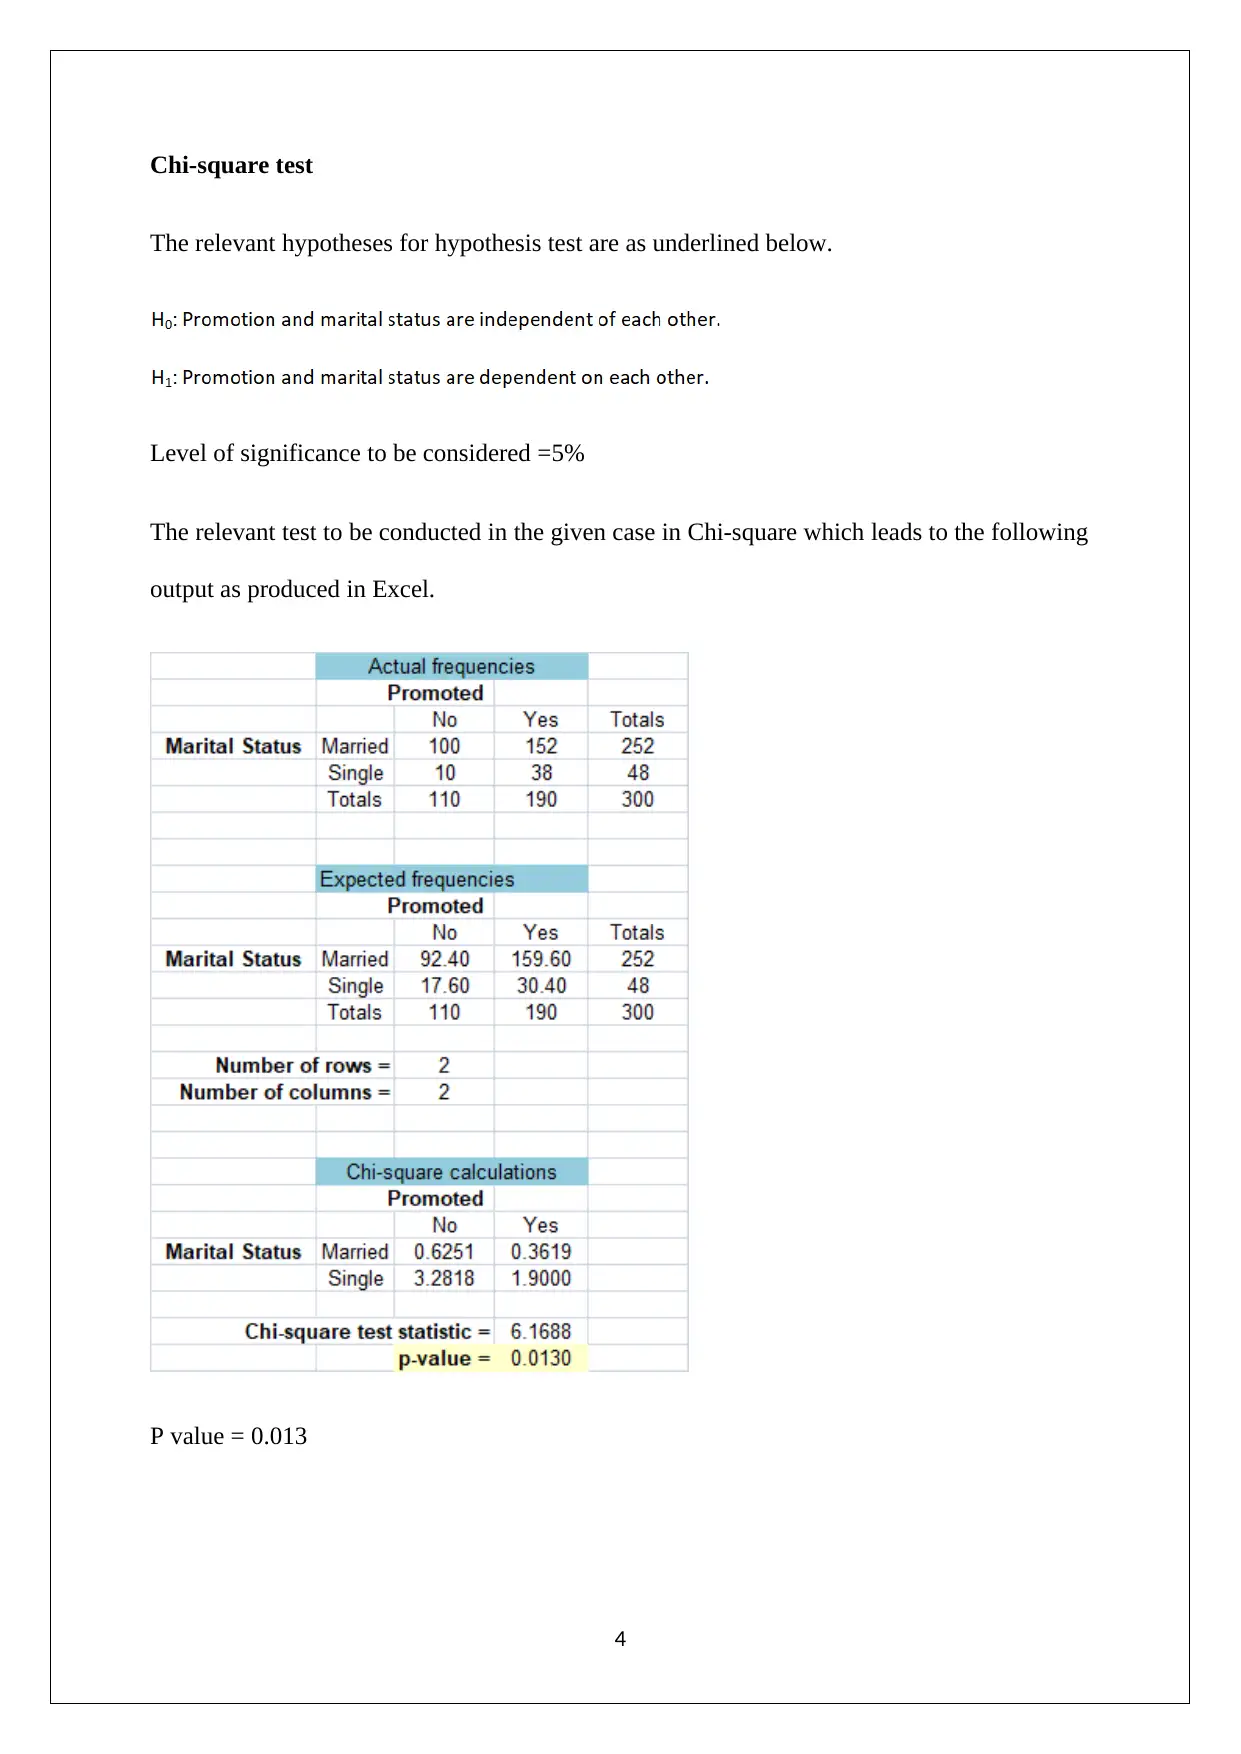
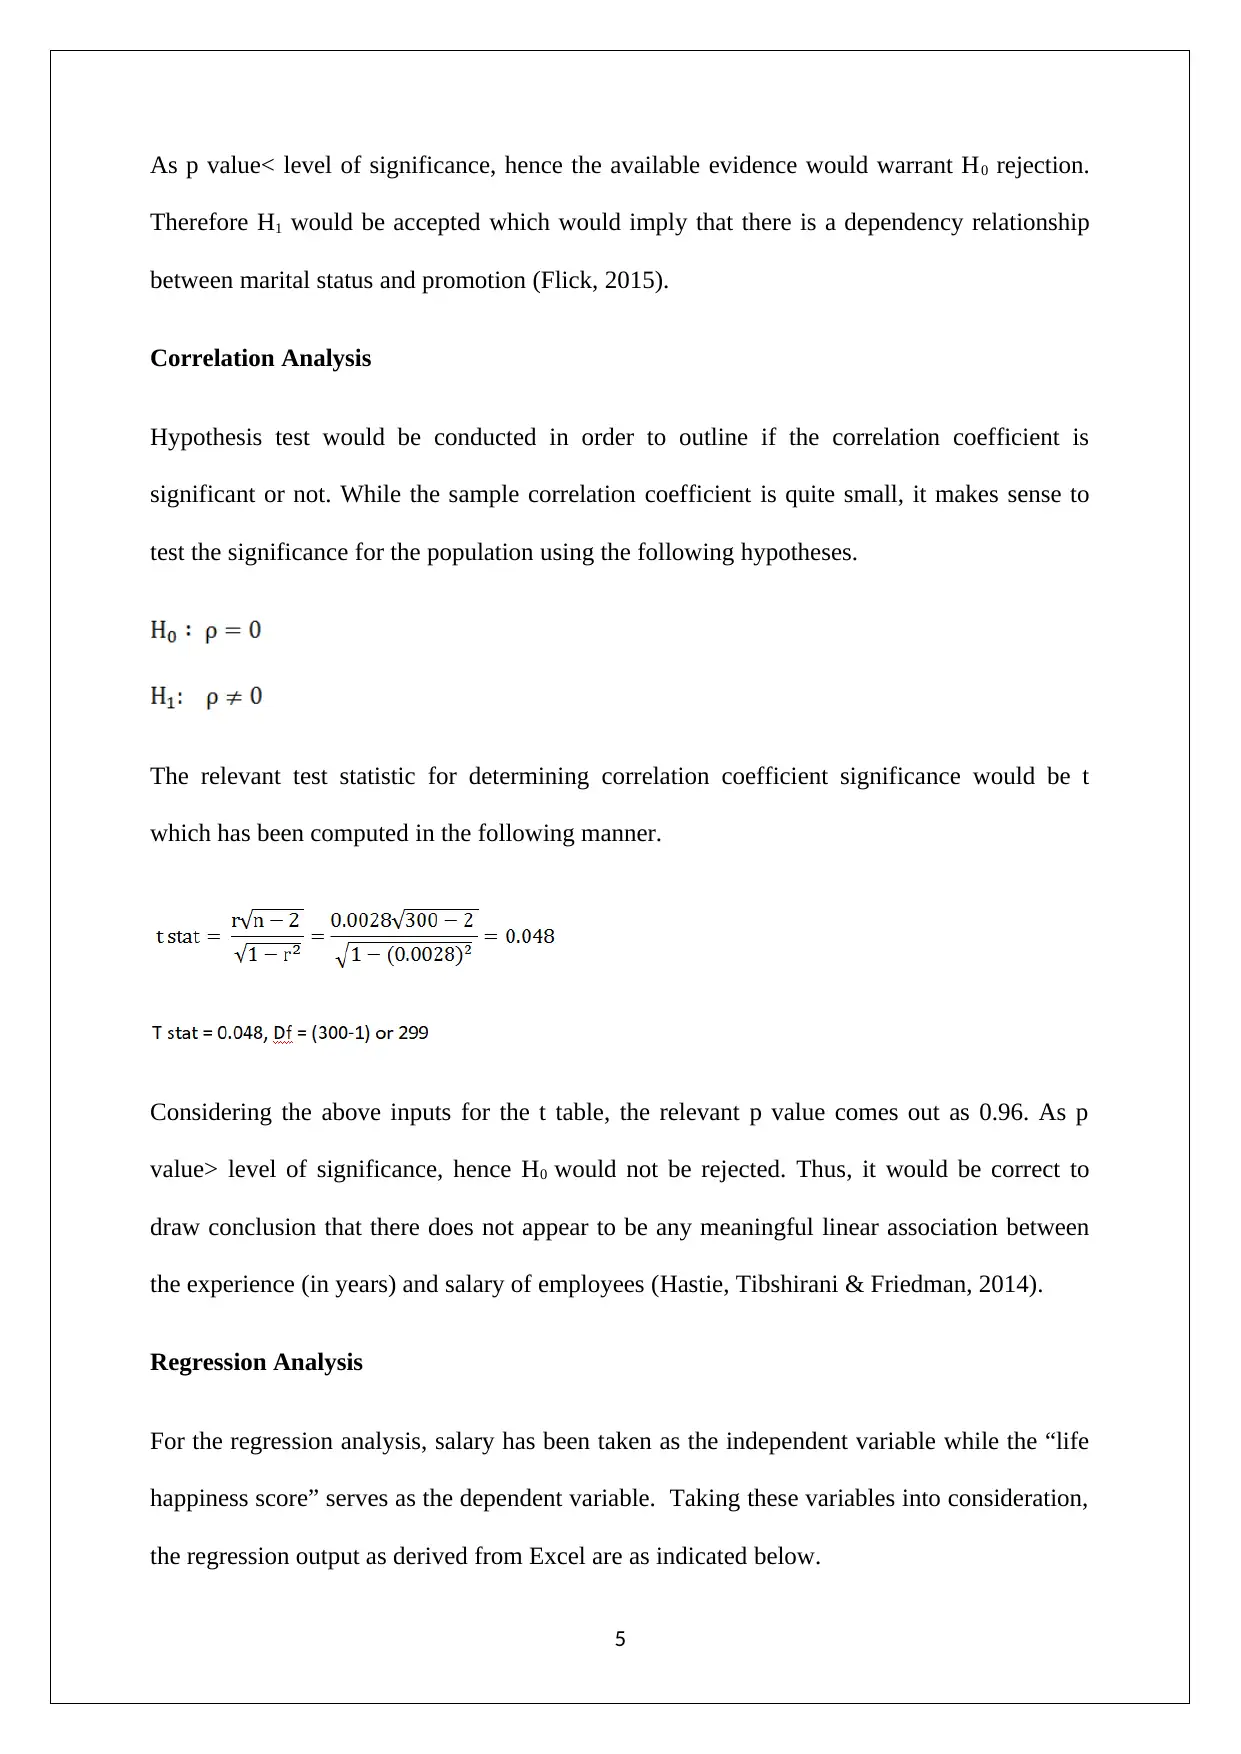
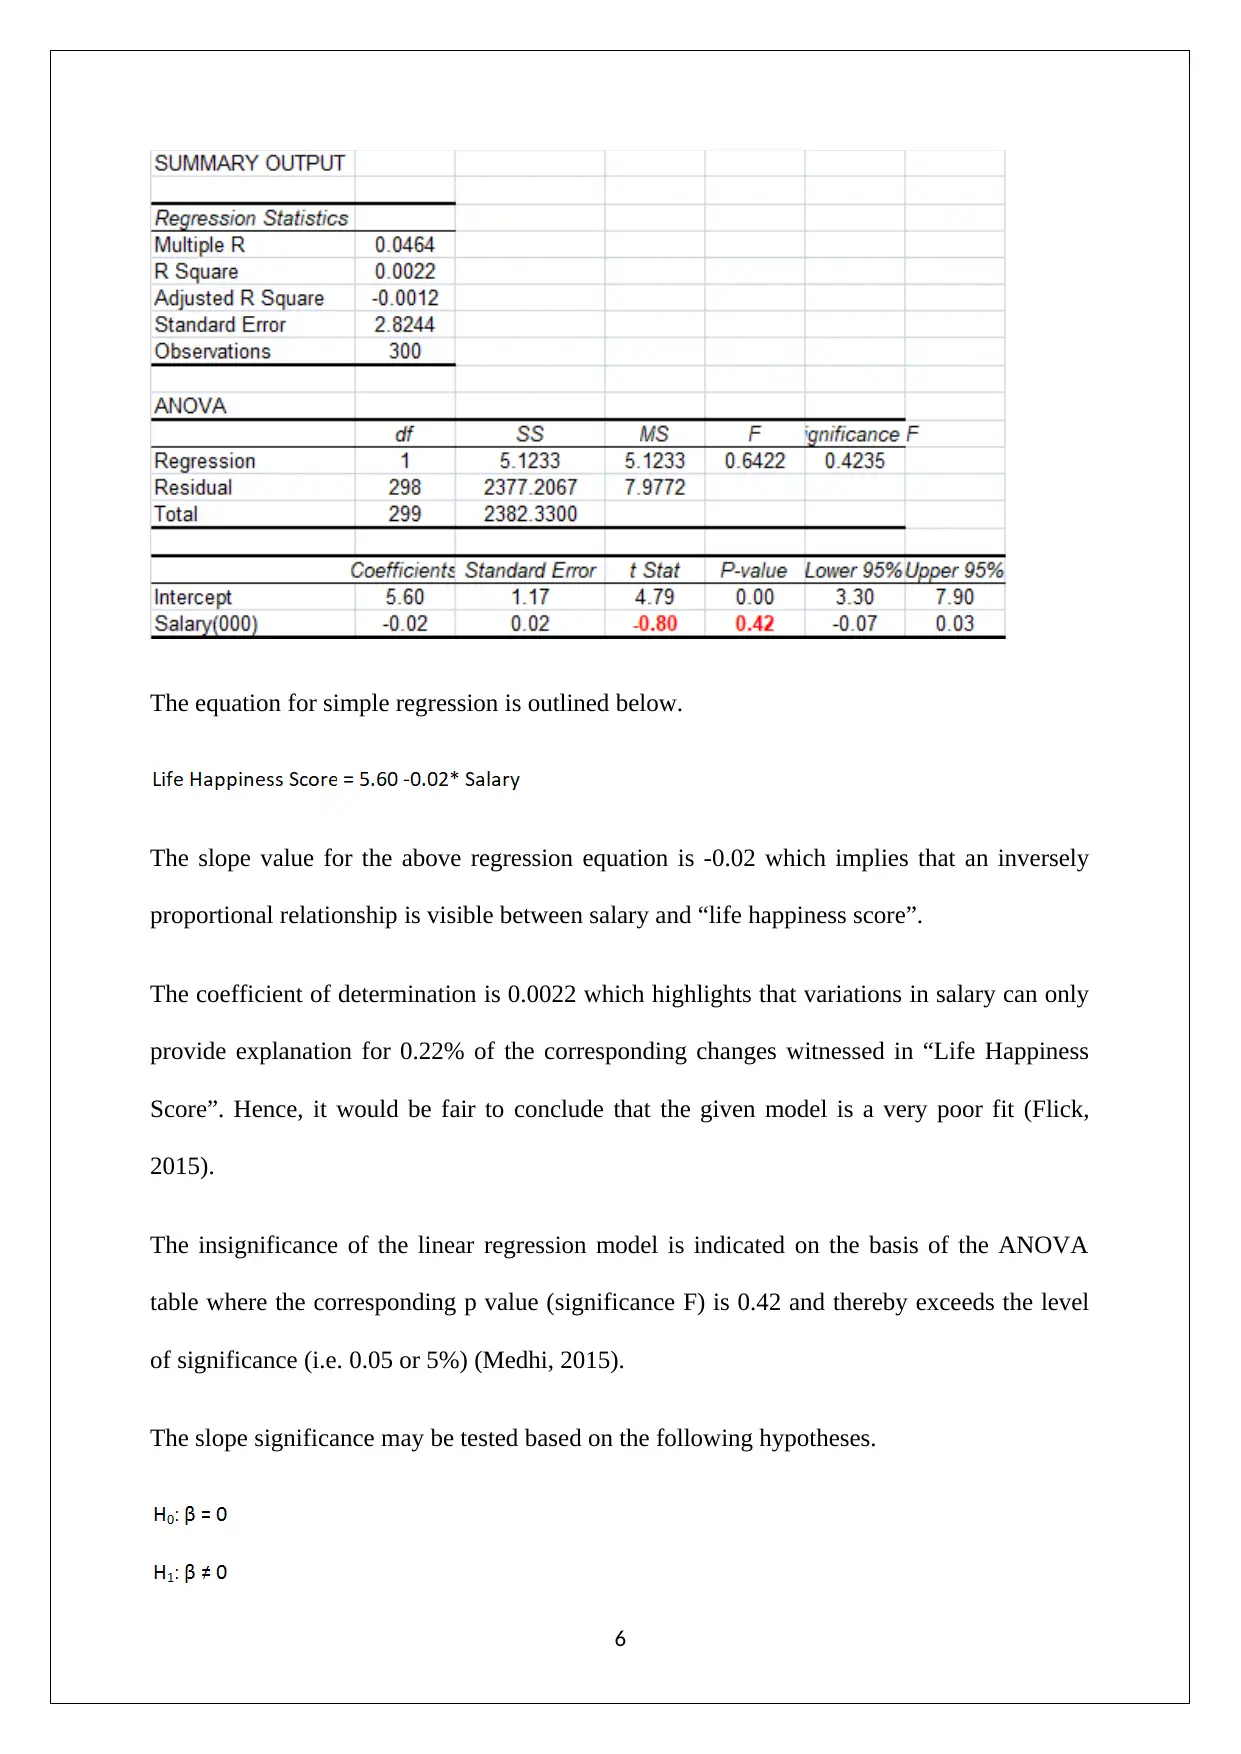
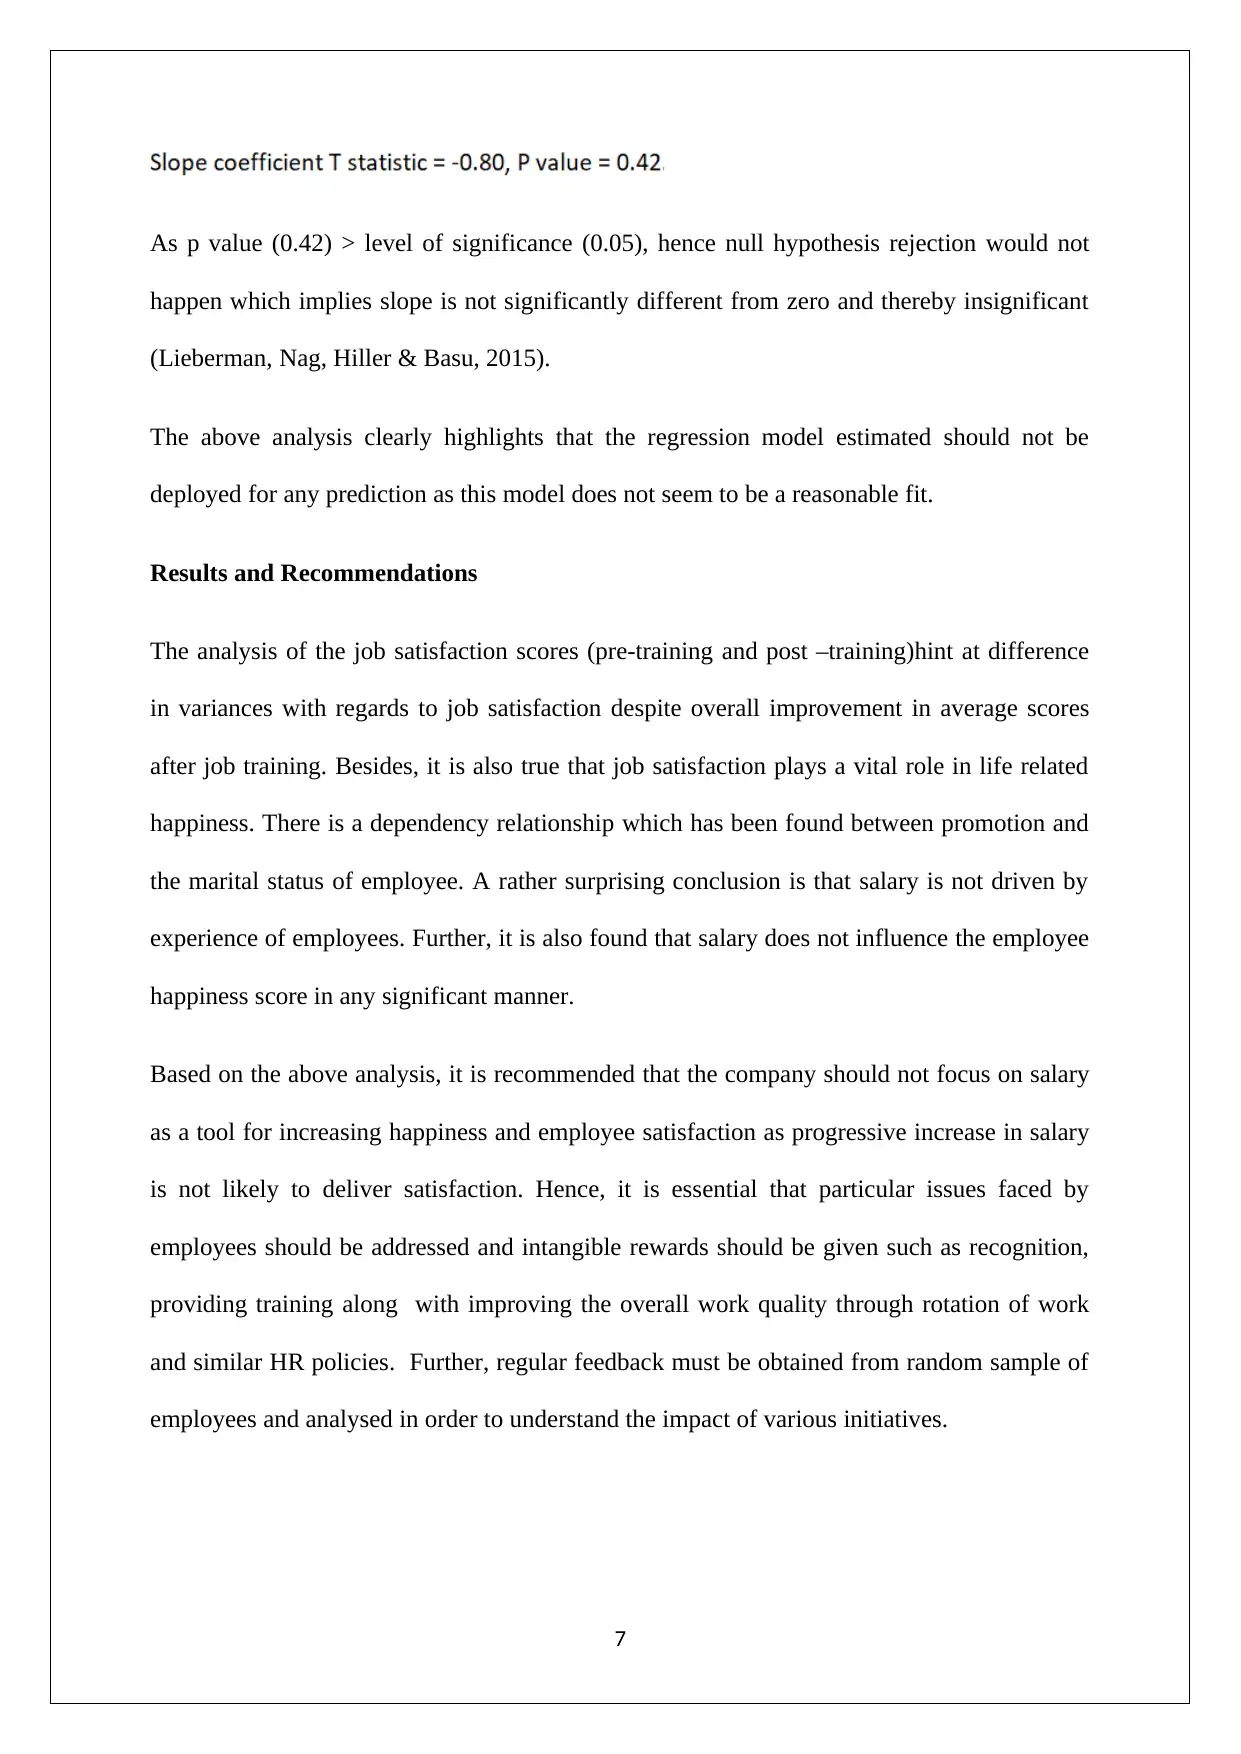
This report provides a statistical analysis of employee satisfaction within a global company facing issues related to low satisfaction levels. The analysis is based on a survey of 300 employees, employing both descriptive and inferential statistical techniques. Key areas explored include variance and standard deviation, covariance between satisfaction and happiness, z-scores for age and salary, a Chi-square test to determine the relationship between marital status and promotion, and correlation and regression analyses to examine the relationships between various factors like experience, salary, and life happiness. The findings reveal insights into the impact of training, the relationship between job satisfaction and life happiness, the dependency between promotion and marital status, and the lack of correlation between salary and experience or happiness. The report concludes with recommendations for the company, suggesting a shift away from salary-driven incentives and a focus on addressing employee needs through intangible rewards like recognition, training, and improved work quality, along with regular feedback collection and analysis to gauge the effectiveness of implemented initiatives. The report uses Excel for calculations and references relevant academic literature.

BUSINESS STATISTICS
STUDENT ID:
[Pick the date]
STUDENT ID:
[Pick the date]
Paraphrase This Document
Need a fresh take? Get an instant paraphrase of this document with our AI Paraphraser

Introduction
The given report relate to a global company which is facing issues related to low satisfaction
level of employees. This is a issue which the company wants to address and hence has
conducted a survey amongst 300 employees resulting in sample data capturing the responses
of these employees. This survey data pertains a varied information which aims to measure the
satisfaction level of employees through various parameters besides capturing demographic
details. Thus, the objective of the given report is to conduct a statistical analysis in relation to
key elements related to satisfaction and providing recommendations for improvement of
employee satisfaction levels.
Problem Definition
The pivotal issue faced by the company is the waning levels of employee satisfaction. In
order to reverse this trend, the company has initiated various measures such as training
sessions. However, it is possible that for various actions taken by the company, there may be
negative effect. As a result, the company aims to understand the needs of their employees
better by considering the sample data so that appropriate measures may be taken in the future.
The primary focus is on the inferential statistics use which can provide useful conclusions
about the population of all employees based on the sample responses. However, some
descriptive statistics techniques have also been deployed so as to understand the relationship
between variables. The key descriptive techniques that have been used on the numerical data
are correlation analysis and regression analysis. But in case of categorical variables, the use
of inferential statistical technique particularly pertaining to hypothesis testing is more
common. The key objective behind statistical analysis is to outline the expected impact of the
changes in different variables on the overall job satisfaction of employees which would allow
for useful recommendations be made.
1

Variance/Standard Deviation
The requisite calculations are based in Excel with the requisite output being illustrated here.
The variance in the context of satisfaction scores registered before training and after training
exhibits difference. Even though the post training average satisfaction score is higher but the
increasing variance implies that the impact of training on all employee is not the same
thereby resulting in differential improvement across employees (Eriksson & Kovalainen,
2015). However, there is no denying that training has led to improvement in satisfaction
across employees.
Covariance
The COVAR(Array1, Array2) function available in excel has been used for computing the
covariance between satisfaction score and happiness score visible in the sample data before
training has been organised. The covariance comes out as 0.23 which implies that the
underlying variables have a positive relationship. Besides, this also leads to the conclusion
that a higher satisfaction at job would also lead to higher happiness in life which implies that
satisfaction with job is critical (Flick, 2015).
Z score
Age
In order to facilitate the z score for the given variable, information from sample is required
which has been computed using Excel and summarised as follows.
2
⊘ This is a preview!⊘
Do you want full access?
Subscribe today to unlock all pages.

Trusted by 1+ million students worldwide

Based on the above computations, it can be concluded that the variable age lies between -2.15
σ and 1.78 σ. These values have been computed assuming the mean as the reference point
which hints at the location of the maximum and minimum point. As for the lowest point, the
corresponding standard deviation is more than 2σ, hence it would be considered as an outlier
(Taylor & Cihon, 2014).
Salary
In order to facilitate the z score for the given variable, information from sample is required
which has been computed using Excel and summarised as follows.
Based on the above computations, it can be concluded that the variable age lies between -3.2
σ and 2.64 σ. These values have been computed assuming the mean as the reference point
which hints at the location of the maximum and minimum point. As both the lowest and the
highest point, the corresponding standard deviation is more than 2σ, hence both these would
be considered as outliers (Medhi, 2015).
3
Paraphrase This Document
Need a fresh take? Get an instant paraphrase of this document with our AI Paraphraser

Chi-square test
The relevant hypotheses for hypothesis test are as underlined below.
Level of significance to be considered =5%
The relevant test to be conducted in the given case in Chi-square which leads to the following
output as produced in Excel.
P value = 0.013
4
The relevant hypotheses for hypothesis test are as underlined below.
Level of significance to be considered =5%
The relevant test to be conducted in the given case in Chi-square which leads to the following
output as produced in Excel.
P value = 0.013
4

As p value< level of significance, hence the available evidence would warrant H0 rejection.
Therefore H1 would be accepted which would imply that there is a dependency relationship
between marital status and promotion (Flick, 2015).
Correlation Analysis
Hypothesis test would be conducted in order to outline if the correlation coefficient is
significant or not. While the sample correlation coefficient is quite small, it makes sense to
test the significance for the population using the following hypotheses.
The relevant test statistic for determining correlation coefficient significance would be t
which has been computed in the following manner.
Considering the above inputs for the t table, the relevant p value comes out as 0.96. As p
value> level of significance, hence H0 would not be rejected. Thus, it would be correct to
draw conclusion that there does not appear to be any meaningful linear association between
the experience (in years) and salary of employees (Hastie, Tibshirani & Friedman, 2014).
Regression Analysis
For the regression analysis, salary has been taken as the independent variable while the “life
happiness score” serves as the dependent variable. Taking these variables into consideration,
the regression output as derived from Excel are as indicated below.
5
⊘ This is a preview!⊘
Do you want full access?
Subscribe today to unlock all pages.

Trusted by 1+ million students worldwide

The equation for simple regression is outlined below.
The slope value for the above regression equation is -0.02 which implies that an inversely
proportional relationship is visible between salary and “life happiness score”.
The coefficient of determination is 0.0022 which highlights that variations in salary can only
provide explanation for 0.22% of the corresponding changes witnessed in “Life Happiness
Score”. Hence, it would be fair to conclude that the given model is a very poor fit (Flick,
2015).
The insignificance of the linear regression model is indicated on the basis of the ANOVA
table where the corresponding p value (significance F) is 0.42 and thereby exceeds the level
of significance (i.e. 0.05 or 5%) (Medhi, 2015).
The slope significance may be tested based on the following hypotheses.
6
Paraphrase This Document
Need a fresh take? Get an instant paraphrase of this document with our AI Paraphraser

As p value (0.42) > level of significance (0.05), hence null hypothesis rejection would not
happen which implies slope is not significantly different from zero and thereby insignificant
(Lieberman, Nag, Hiller & Basu, 2015).
The above analysis clearly highlights that the regression model estimated should not be
deployed for any prediction as this model does not seem to be a reasonable fit.
Results and Recommendations
The analysis of the job satisfaction scores (pre-training and post –training)hint at difference
in variances with regards to job satisfaction despite overall improvement in average scores
after job training. Besides, it is also true that job satisfaction plays a vital role in life related
happiness. There is a dependency relationship which has been found between promotion and
the marital status of employee. A rather surprising conclusion is that salary is not driven by
experience of employees. Further, it is also found that salary does not influence the employee
happiness score in any significant manner.
Based on the above analysis, it is recommended that the company should not focus on salary
as a tool for increasing happiness and employee satisfaction as progressive increase in salary
is not likely to deliver satisfaction. Hence, it is essential that particular issues faced by
employees should be addressed and intangible rewards should be given such as recognition,
providing training along with improving the overall work quality through rotation of work
and similar HR policies. Further, regular feedback must be obtained from random sample of
employees and analysed in order to understand the impact of various initiatives.
7

References
Eriksson, P. & Kovalainen, A. (2015). Quantitative methods in business research (3rded.).
London: Sage Publications.
Flick, U. (2015). Introducing research methodology: A beginner's guide to doing a research
project (4thed.). New York: Sage Publications.
Hastie, T., Tibshirani, R. & Friedman, J. (2016). The Elements of Statistical Learning
(4thed.). New York: Springer Publications.
Lieberman, F. J., Nag, B., Hiller, F.S. &Basu, P. (2015).Introduction To Operations Research
(5thed.).New Delhi: Tata McGraw Hill Publishers.
Medhi, J. (2015). Statistical Methods: An Introductory Text (4thed.). Sydney: New Age
International.
Taylor, K. J. & Cihon, C. (2014).Statistical Techniques for Data Analysis (2nded.).
Melbourne: CRC Press.
8
⊘ This is a preview!⊘
Do you want full access?
Subscribe today to unlock all pages.

Trusted by 1+ million students worldwide
1 out of 9