In-Depth Report: Employee Satisfaction, Workplace Dynamics Analysis
VerifiedAdded on  2023/06/18
|26
|2817
|200
Report
AI Summary
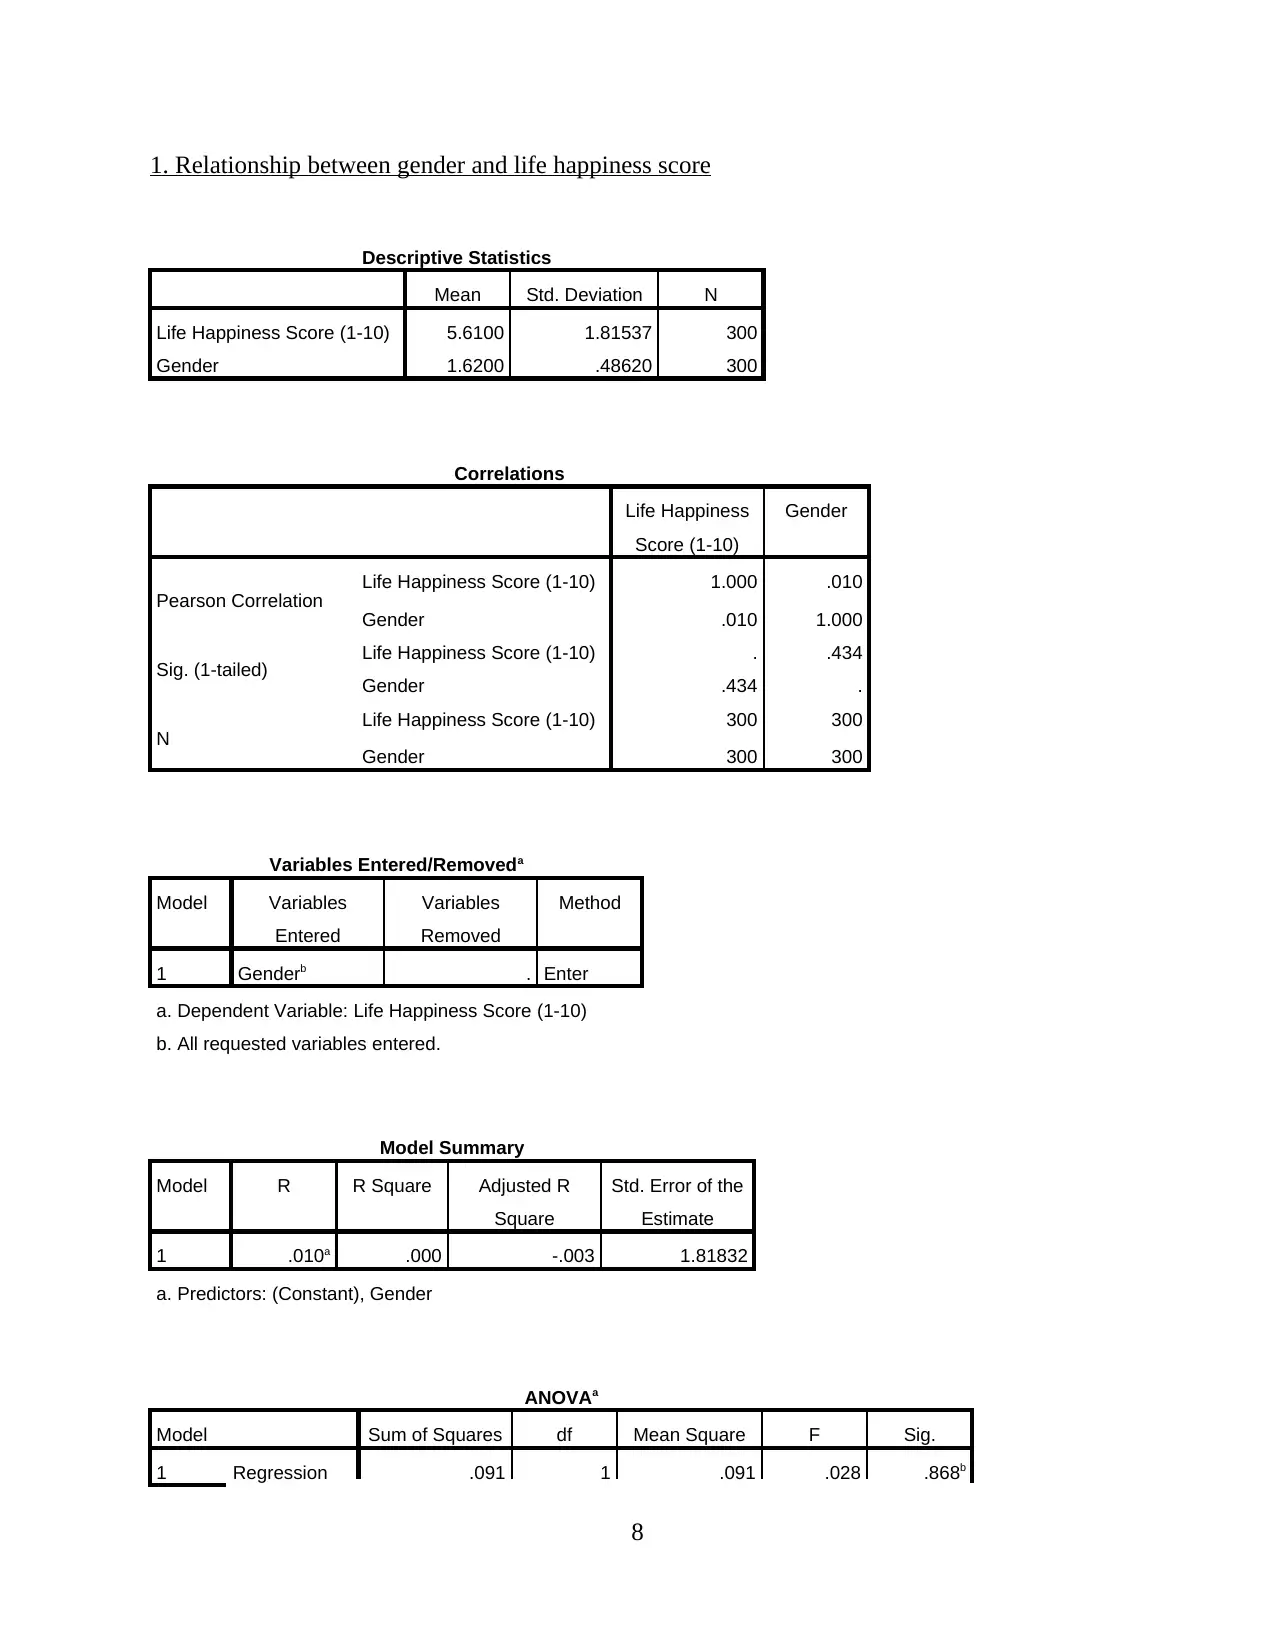
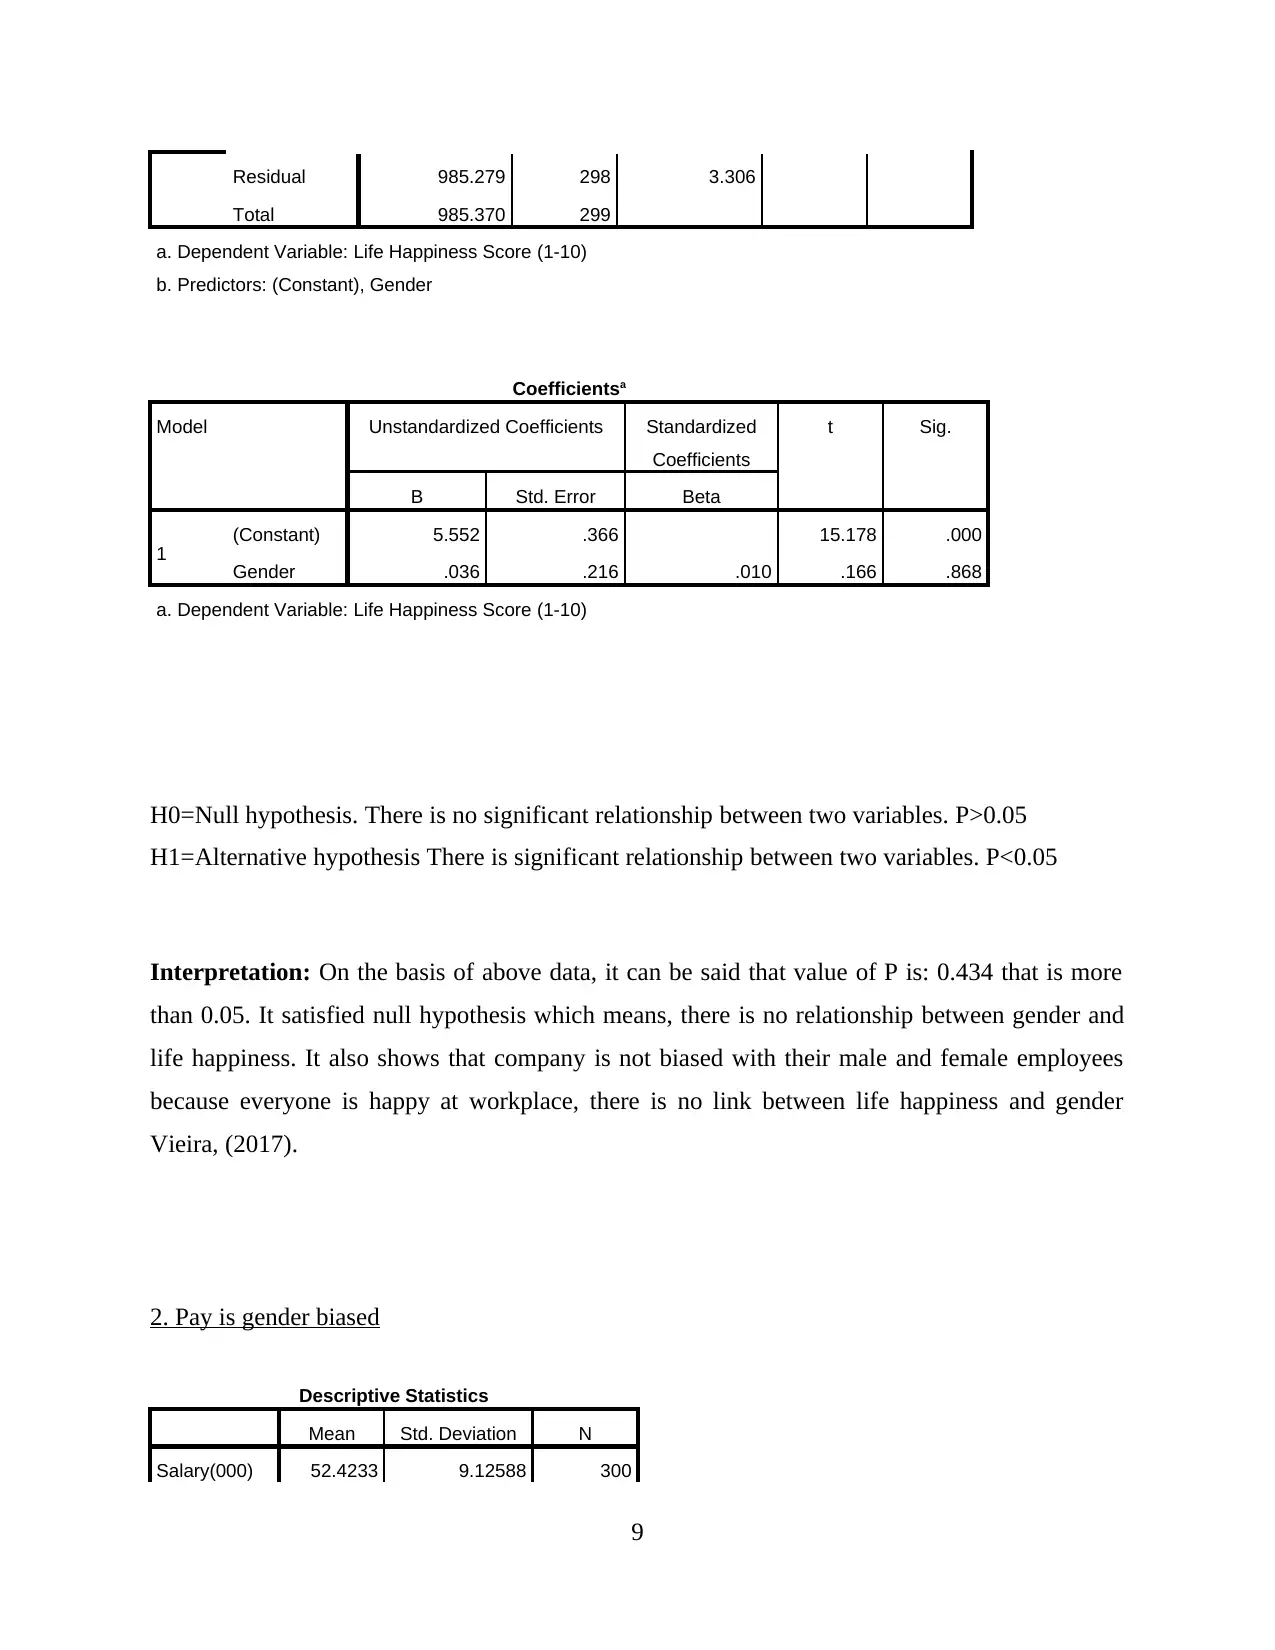
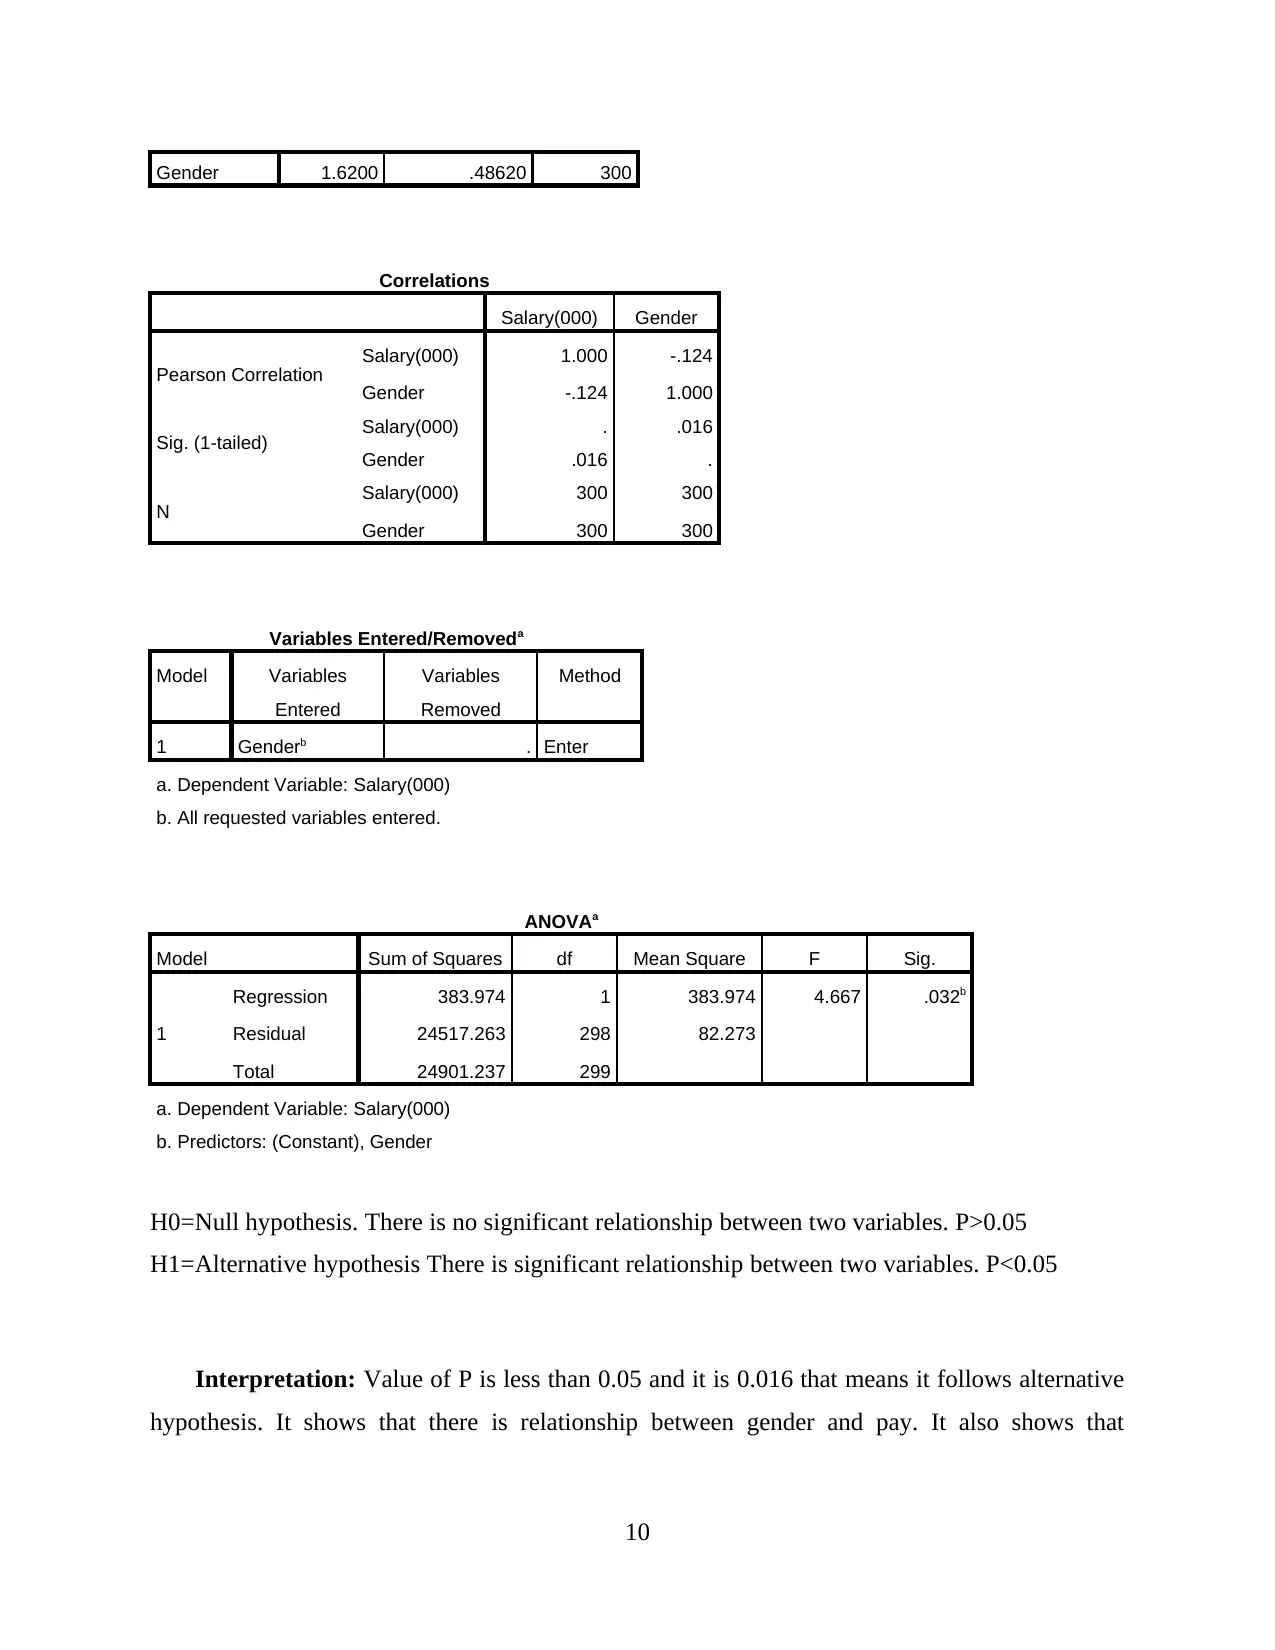
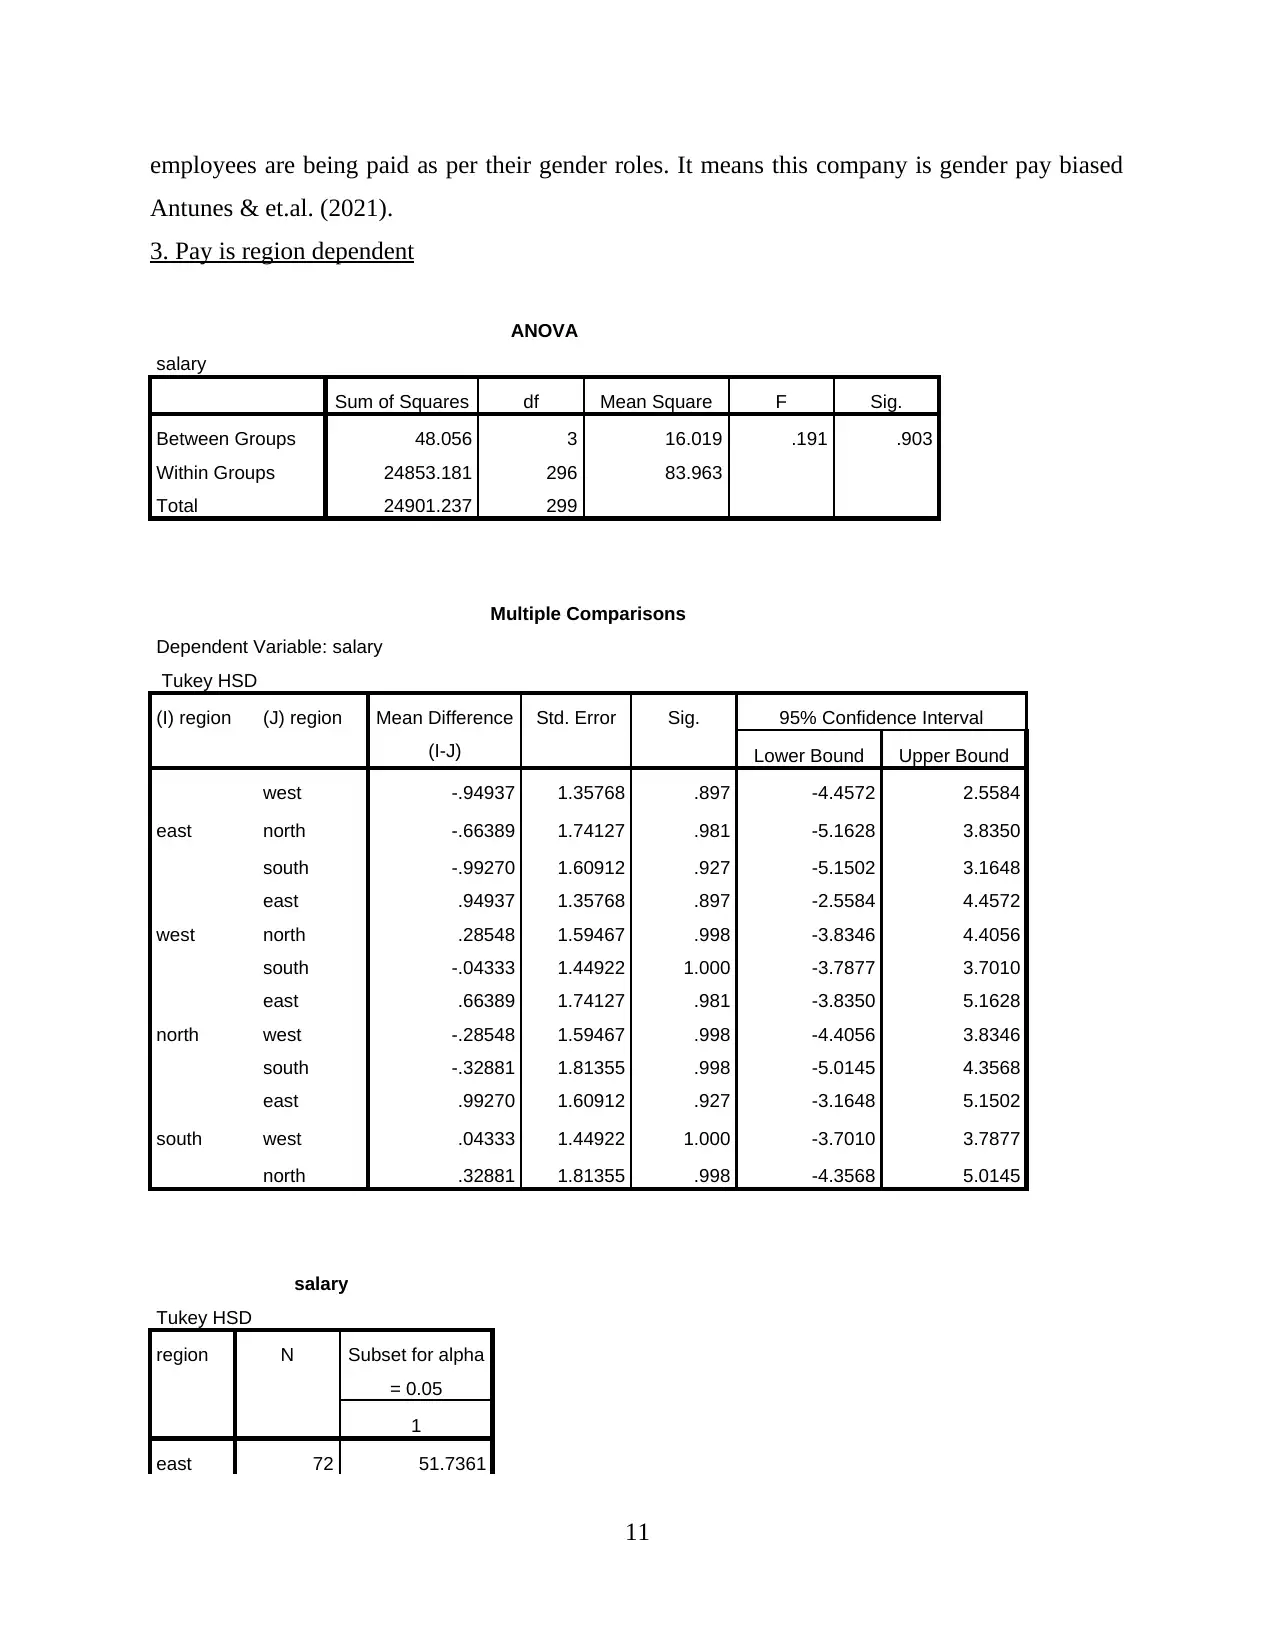
This report provides a comprehensive analysis of employee satisfaction and various workplace dynamics. It examines the relationship between gender and life happiness, revealing no significant correlation, but identifies a gender pay bias within the company. The study also explores the impact of geographical region on pay, finding no significant dependency. Furthermore, the report highlights the positive correlation between training programs and job satisfaction levels, demonstrating a substantial improvement in employee satisfaction post-training. An assessment of promotion practices indicates no gender bias in promotions. The analysis extends to the dependency of salary on age, confirming a positive relationship, and investigates the interrelationships among several numerical variables related to employee satisfaction, teamwork, information access, job passion, and work-life balance. Desklib offers a range of similar solved assignments and resources for students.

Individual Project
Paraphrase This Document
Need a fresh take? Get an instant paraphrase of this document with our AI Paraphraser

Table of Contents
1. Relationship between gender and life happiness score............................................................8
2. Pay is gender biased.................................................................................................................9
3. Pay is region dependent.........................................................................................................11
4. Relationship between training and job satisfaction...............................................................12
5. Promotion is gender biased....................................................................................................17
6. Dependency of salary on age.................................................................................................20
7. Relationship among many numerical variables.....................................................................21
REFERENCES..............................................................................................................................25
1

Marital status of employees
Statistics
Marital Status
N Valid 300
Missing 0
Marital Status
Frequency Percent Valid Percent Cumulative
Percent
Valid
Married 252 84.0 84.0 84.0
Single 48 16.0 16.0 100.0
Total 300 100.0 100.0
2
Statistics
Marital Status
N Valid 300
Missing 0
Marital Status
Frequency Percent Valid Percent Cumulative
Percent
Valid
Married 252 84.0 84.0 84.0
Single 48 16.0 16.0 100.0
Total 300 100.0 100.0
2
⊘ This is a preview!⊘
Do you want full access?
Subscribe today to unlock all pages.

Trusted by 1+ million students worldwide

Number of employees within each department
Statistics
Departments
N Valid 300
Missing 0
Mean 2.2933
Median 2.0000
Mode 2.00
Departments
Frequency Percent Valid Percent Cumulative
Percent
3
Statistics
Departments
N Valid 300
Missing 0
Mean 2.2933
Median 2.0000
Mode 2.00
Departments
Frequency Percent Valid Percent Cumulative
Percent
3
Paraphrase This Document
Need a fresh take? Get an instant paraphrase of this document with our AI Paraphraser

Valid
IT 101 33.7 33.7 33.7
Marketing 109 36.3 36.3 70.0
Sales 32 10.7 10.7 80.7
HR 30 10.0 10.0 90.7
Finance 15 5.0 5.0 95.7
Innovation 13 4.3 4.3 100.0
Total 300 100.0 100.0
Satisfaction level of employees before training
Statistics
Job Satisfaction Score before
training(1-5)
N Valid 300
4
IT 101 33.7 33.7 33.7
Marketing 109 36.3 36.3 70.0
Sales 32 10.7 10.7 80.7
HR 30 10.0 10.0 90.7
Finance 15 5.0 5.0 95.7
Innovation 13 4.3 4.3 100.0
Total 300 100.0 100.0
Satisfaction level of employees before training
Statistics
Job Satisfaction Score before
training(1-5)
N Valid 300
4

Missing 0
Mean 2.1000
Median 2.0000
Mode 2.00
Job Satisfaction Score before training(1-5)
Frequency Percent Valid Percent Cumulative
Percent
Valid
Extremely dissatisfied 93 31.0 31.0 31.0
2.00 112 37.3 37.3 68.3
3.00 69 23.0 23.0 91.3
4.00 24 8.0 8.0 99.3
Extremely satisfied 2 .7 .7 100.0
Total 300 100.0 100.0
5
⊘ This is a preview!⊘
Do you want full access?
Subscribe today to unlock all pages.

Trusted by 1+ million students worldwide

Life happiness
Statistics
Life Happiness Score (1-10)
N Valid 300
Missing 0
Mean 5.6100
Median 6.0000
Mode 6.00
Life Happiness Score (1-10)
Frequency Percent Valid Percent Cumulative
Percent
6
Statistics
Life Happiness Score (1-10)
N Valid 300
Missing 0
Mean 5.6100
Median 6.0000
Mode 6.00
Life Happiness Score (1-10)
Frequency Percent Valid Percent Cumulative
Percent
6
Paraphrase This Document
Need a fresh take? Get an instant paraphrase of this document with our AI Paraphraser

Valid
extremely unhappy 4 1.3 1.3 1.3
2.00 11 3.7 3.7 5.0
3.00 22 7.3 7.3 12.3
4.00 41 13.7 13.7 26.0
extremely happy 63 21.0 21.0 47.0
6.00 67 22.3 22.3 69.3
7.00 43 14.3 14.3 83.7
8.00 35 11.7 11.7 95.3
9.00 11 3.7 3.7 99.0
10.00 3 1.0 1.0 100.0
Total 300 100.0 100.0
7
extremely unhappy 4 1.3 1.3 1.3
2.00 11 3.7 3.7 5.0
3.00 22 7.3 7.3 12.3
4.00 41 13.7 13.7 26.0
extremely happy 63 21.0 21.0 47.0
6.00 67 22.3 22.3 69.3
7.00 43 14.3 14.3 83.7
8.00 35 11.7 11.7 95.3
9.00 11 3.7 3.7 99.0
10.00 3 1.0 1.0 100.0
Total 300 100.0 100.0
7

1. Relationship between gender and life happiness score
Descriptive Statistics
Mean Std. Deviation N
Life Happiness Score (1-10) 5.6100 1.81537 300
Gender 1.6200 .48620 300
Correlations
Life Happiness
Score (1-10)
Gender
Pearson Correlation Life Happiness Score (1-10) 1.000 .010
Gender .010 1.000
Sig. (1-tailed) Life Happiness Score (1-10) . .434
Gender .434 .
N Life Happiness Score (1-10) 300 300
Gender 300 300
Variables Entered/Removeda
Model Variables
Entered
Variables
Removed
Method
1 Genderb . Enter
a. Dependent Variable: Life Happiness Score (1-10)
b. All requested variables entered.
Model Summary
Model R R Square Adjusted R
Square
Std. Error of the
Estimate
1 .010a .000 -.003 1.81832
a. Predictors: (Constant), Gender
ANOVAa
Model Sum of Squares df Mean Square F Sig.
1 Regression .091 1 .091 .028 .868b
8
⊘ This is a preview!⊘
Do you want full access?
Subscribe today to unlock all pages.

Trusted by 1+ million students worldwide

Residual 985.279 298 3.306
Total 985.370 299
a. Dependent Variable: Life Happiness Score (1-10)
b. Predictors: (Constant), Gender
Coefficientsa
Model Unstandardized Coefficients Standardized
Coefficients
t Sig.
B Std. Error Beta
1 (Constant) 5.552 .366 15.178 .000
Gender .036 .216 .010 .166 .868
a. Dependent Variable: Life Happiness Score (1-10)
H0=Null hypothesis. There is no significant relationship between two variables. P>0.05
H1=Alternative hypothesis There is significant relationship between two variables. P<0.05
Interpretation: On the basis of above data, it can be said that value of P is: 0.434 that is more
than 0.05. It satisfied null hypothesis which means, there is no relationship between gender and
life happiness. It also shows that company is not biased with their male and female employees
because everyone is happy at workplace, there is no link between life happiness and gender
Vieira, (2017).
2. Pay is gender biased
Descriptive Statistics
Mean Std. Deviation N
Salary(000) 52.4233 9.12588 300
9
Paraphrase This Document
Need a fresh take? Get an instant paraphrase of this document with our AI Paraphraser

Gender 1.6200 .48620 300
Correlations
Salary(000) Gender
Pearson Correlation Salary(000) 1.000 -.124
Gender -.124 1.000
Sig. (1-tailed) Salary(000) . .016
Gender .016 .
N Salary(000) 300 300
Gender 300 300
Variables Entered/Removeda
Model Variables
Entered
Variables
Removed
Method
1 Genderb . Enter
a. Dependent Variable: Salary(000)
b. All requested variables entered.
ANOVAa
Model Sum of Squares df Mean Square F Sig.
1
Regression 383.974 1 383.974 4.667 .032b
Residual 24517.263 298 82.273
Total 24901.237 299
a. Dependent Variable: Salary(000)
b. Predictors: (Constant), Gender
H0=Null hypothesis. There is no significant relationship between two variables. P>0.05
H1=Alternative hypothesis There is significant relationship between two variables. P<0.05
Interpretation: Value of P is less than 0.05 and it is 0.016 that means it follows alternative
hypothesis. It shows that there is relationship between gender and pay. It also shows that
10

employees are being paid as per their gender roles. It means this company is gender pay biased
Antunes & et.al. (2021).
3. Pay is region dependent
ANOVA
salary
Sum of Squares df Mean Square F Sig.
Between Groups 48.056 3 16.019 .191 .903
Within Groups 24853.181 296 83.963
Total 24901.237 299
Multiple Comparisons
Dependent Variable: salary
Tukey HSD
(I) region (J) region Mean Difference
(I-J)
Std. Error Sig. 95% Confidence Interval
Lower Bound Upper Bound
east
west -.94937 1.35768 .897 -4.4572 2.5584
north -.66389 1.74127 .981 -5.1628 3.8350
south -.99270 1.60912 .927 -5.1502 3.1648
west
east .94937 1.35768 .897 -2.5584 4.4572
north .28548 1.59467 .998 -3.8346 4.4056
south -.04333 1.44922 1.000 -3.7877 3.7010
north
east .66389 1.74127 .981 -3.8350 5.1628
west -.28548 1.59467 .998 -4.4056 3.8346
south -.32881 1.81355 .998 -5.0145 4.3568
south
east .99270 1.60912 .927 -3.1648 5.1502
west .04333 1.44922 1.000 -3.7010 3.7877
north .32881 1.81355 .998 -4.3568 5.0145
salary
Tukey HSD
region N Subset for alpha
= 0.05
1
east 72 51.7361
11
⊘ This is a preview!⊘
Do you want full access?
Subscribe today to unlock all pages.

Trusted by 1+ million students worldwide
1 out of 26
Related Documents
Your All-in-One AI-Powered Toolkit for Academic Success.
 +13062052269
info@desklib.com
Available 24*7 on WhatsApp / Email
Unlock your academic potential
Copyright © 2020–2025 A2Z Services. All Rights Reserved. Developed and managed by ZUCOL.


