Comprehensive Analysis of SuperPart Employee Survey Data Report
VerifiedAdded on 2020/02/23
|10
|2258
|348
Report
AI Summary
This report presents an analysis of a survey conducted on 400 randomly selected employees of SuperPart Industries, addressing queries from the Vice President of Human Resources. The analysis explores employee demographics, including age and pre-tax income, and their relationship to working hours and job satisfaction. Key findings reveal similar average ages across departments, with no significant correlation between age and working hours or pre-tax income. The report highlights high levels of employee satisfaction, particularly among non-union members, and examines the relationship between job satisfaction and working hours. Additionally, the analysis includes an assessment of union membership percentages and provides calculations to determine the adequacy of the sample size for estimating working hours and satisfaction levels with a specified degree of accuracy. The report concludes with recommendations based on the analysis of the survey data.
Running head: ANALYTICAL SKILLS FOUNDATION
Analytical Skill Foundation
Name of the student
Name of the university
Author’s note
Analytical Skill Foundation
Name of the student
Name of the university
Author’s note
Paraphrase This Document
Need a fresh take? Get an instant paraphrase of this document with our AI Paraphraser
1ANALYTICAL SKILL FOUNDATION
Executive Statistics
The present analysis is in response to the query of the Vice President of human
Resources, SuperPart Industries. The average age of the employees across different departments
is approximately similar. There seems to be no relation between age and working hours of the
employees. Similarly, there seems to be very little relation between age and pre-tax income of
the employees. Further, the analysis reveals that most of the employees are satisfied with the
environment at SuperPart. In addition, most of the non-union employees are satisfied with the
environment. The average working hours for all groups of employees based on satisfaction is
similar. The average working hours for non-union members is less than 45 hours per week.
Additionally, the percentage of unionised employees at SuperPart is less than the national
average. In addition, with the sample data is enough to estimate the average working week to
within 1 hour. However, the sample data is not enough to estimate the satisfaction level to within
1%.
2ANALYTICAL SKILL FOUNDATION
Table of Contents
Overall view of an employee’s age.................................................................................................3
Exploring Associations....................................................................................................................3
Occupation within SuperPart.......................................................................................................3
The number of hours worked.......................................................................................................4
Before‐taxes Income....................................................................................................................4
Differences in levels of job satisfaction...........................................................................................4
Summary on worker satisfaction..................................................................................................4
Job Satisfaction............................................................................................................................5
Job Satisfaction based on working hours.....................................................................................5
⊘ This is a preview!⊘
Do you want full access?
Subscribe today to unlock all pages.
Trusted by 1+ million students worldwide
3ANALYTICAL SKILL FOUNDATION
To : Hannah Zhou, Vice‐President of Human Resources
From : Sandy Stedwell, Research and Analysis Department
Subject: Analysis of SuperPart Employee survey Data
Dear Hannah Zhou,
Herein I present to you the analysis of the survey data of SuperPart employees. As
you know SuperPart employees, 9800 employees and it would be a difficult task to analyse the
data of all the employees. Hence, a sample of 400 employees selected at random has been
analysed. The analysis I hope would be able to answer your queries. The analysis has been
arranged according to your query.
Overall view of an employee’s age
The average age of the employees at SuperPart is 39.41 years with a variation of
10.61years. The age of the employees ranges from 18 years to 69 years. 50% of the employees
are above and below 38 years. Maximum number of employees has an age of 33 years.
25% of the employees are within an age limit of 32 years. Further, 25% of the employees
are above the age of 46 years.
The age of one of the employees is abnormally high.
Exploring Associations
Occupation within SuperPart
The average age the employees across occupation at SuperPart are highly similar. The
employees at Tech / Sales depart have the least average age (38.05). The employees have
occupation Professional have an average age of 40.08. The employees at Professional have the
least age variation, while the variation in Admin is the highest.
Paraphrase This Document
Need a fresh take? Get an instant paraphrase of this document with our AI Paraphraser
4ANALYTICAL SKILL FOUNDATION
The number of hours worked
Most of the employees of SuperPart work for 38 to 47 years in a week. From the sample
data of the employees, it was found that 2 of the employees worked for 88 to 97 hours per week.
It was found that most of the employees are in the age group of 28 to 37 years. It is also found
that 73 employees of the organization in the age group of 28 to 37 years work for 38 to 47 years.
From the sample data of the employees, it is found that the employee in the age group of 68 to 77
years works for 28 to 37 hours per week. The employees in the age group of 18 to 27 years work
from 28 to 77 hours per week.
In addition, the relation between age and working hours is very poor. The analysis also
found that for one-year increase in the age of the employees the working hour decreases by
0.1083 hours.
Before‐taxes Income
The analysis between age and pre-tax income of the employees shows some interesting
facts. Most of the employees at SuperPart have a pre-tax income between 40.1 and 50.1 thousand
dollars. The analysis of the data illustrates that the employees between the age group of 18 to 27
years have a pre-tax income between 30.1 and 80.1 thousand dollars. The employee between the
age group of 68 to 77 years has a pre-tax income between 30.1 and 40.1 thousand dollars. An
employee in the age bracket of 58 to 67 years receives the highest pre-tax income (between
110.1 and 120.1 thousand dollars). 44 employees in the age group of 38 to 47 years receive a
pre-tax income between 40.1 and 50.1 years.
Moreover the relation between age of the employees at SuperPart and Pre-tax income is
very poor. From the analysis of the sample data it is seen that for each year increase in the age of
the employees the pre-tax income of the employees increases by 303.3 dollars.
Differences in levels of job satisfaction
Summary on worker satisfaction
The analysis of the data shows that 185 employees are very satisfied with their work at
SuperPart. I also find that 171 employees are moderately satisfied with their work. 17 employees
of SuperPart are Very dissatisfied.
5ANALYTICAL SKILL FOUNDATION
Job Satisfaction based on union membership
The employee’s data shows that 39% of non-union employees are very satisfied as
compared to 7% of union employees. Similarly, 3% of the non-union employees are very
dissatisfied, while 1% of the union employees are very dissatisfied.
Moreover, for the very satisfied employees 85% are non-union members as compared to
15% of union employees. Similarly, for the moderately satisfied employees 84% are non-union
members, while 16% are members of the union. Further, for all the very dissatisfied employees
71% are non-union members and 29% are union members.
For all non-union members 47% are very satisfied with the work environment while 43%
are moderately satisfied. Further, for all the non-union members 4% are very dissatisfied with the
work environment at SuperPart.
For all union members 41% are very satisfied and moderately satisfied with the work
environment. Further, for all union members 7% are very dissatisfied with the work environment
at SuperPart.
Job Satisfaction based on working hours
The analysis of the job satisfaction based on the working hours of the employees shows
that the average working hours for a very satisfied employee is 46.14 hours per week. Very
dissatisfied employees have the least amount of average working hours (43.88 hours per week).
Little dissatisfied employees have the highest amount of average working hours (48.04 hours per
week). The variation in the working hours for moderately satisfied employees is the least (7.72
hours per week). The variation in the working hours for Little dissatisfied employees is the
highest (12.47 hours per week).
For all the four satisfaction groups most of the employees work for 40 hours per week.
50% of the employees work below and above 40 hours per week for very satisfied, moderately
satisfied and very dissatisfied group.
The minimum working hours for very satisfied employees is the least (28 hours per
week). The minimum working hours for very dissatisfied employees is the highest (32 hours per
week).
⊘ This is a preview!⊘
Do you want full access?
Subscribe today to unlock all pages.
Trusted by 1+ million students worldwide
6ANALYTICAL SKILL FOUNDATION
The maximum working hours for very satisfied and little dissatisfied employees are the
highest (89 hours per week). The maximum working hours for moderately satisfied employees is
the least (75 hours per week).
25% of the employees work below 40 hours per week for all the four satisfaction groups.
Similarly, 25% Very satisfied and moderately satisfied employees work for more than 50 hours
per week. Further, 50% of very satisfied and moderately satisfied employees work within 10
hours per week.
Worker Retention
Using a Binomial probability model, I studied the number of employees who may leave
SuperPart in the next 2 years. According to the analysis, SuperPart can anticipate that 980
employees would leave the organization in the next 2 years.
Union Memberships
Part a
The mean working hours for an employee at SuperPart is 45.43 hours with a variation of
10.05 hours. From an analysis of the working hours of the employees, it can be said with 95%
confidence that the employees work between 44.45 and 46.42 hours per week.
The analysis of the working hours of the employees who have union membership shows
that the average working hours is 45.14 hours per week. Further, it can be said with 95%
confidence that union members work between 42.34 and 47.95 hours per week.
The average working hours for non-union members is 45.49 hours per week. Moreover, I
can say with 95% confidence that they (non-union members) work between 44.44 and 46.54
hours per week.
Part b
The analysis of the sample data showed that 331 employees are non-union members. The
number of employees who work for more than 40 hours per week is 296. Thus, it is seen that
89% of non-union members work for more than 40 hours per week. Further, it can be said with
Paraphrase This Document
Need a fresh take? Get an instant paraphrase of this document with our AI Paraphraser
7ANALYTICAL SKILL FOUNDATION
95% confidence that between 86 and 93% of non-union members work for more than 40 hours
per week.
In addition to the above analysis, I find that 102 of non-union employees work for more
than 50 hours per week. Hence, this makes it that 31% of non-union members work for more
than 50 hours per week. Moreover, I can say with 95% confidence that 26 to 36% of non-union
members work for more than 50 hours per week.
Part c
The average working hour for non-union members is 45.49 hours per week. However, at
5% level of significance it can be said that the average working hour for non-union members is
less than 45 hours per week.
Part d
The analysis of the sample data found that the number of employees who were part of the
union was 69. Thus 17.25% of the employees of SuperPart were part of the union.
The analysis of the survey found that at 1%, 2% and 5% level of significance the
membership of the union at SuperPart is less than 20%.
Future Surveys
Working Hours
To confirm if a sample size of 400 is enough I present the following calculation.
The standard deviation of the working hours of the employees is 10.0455 hours. At 95%
confidence level z-value = 1.96. To estimate within 1 hour the number of employees required:
1= 1.96∗10.0455
√n
Hence, √ n=19.68918. or n = 387.66 ≈ 388
Thus, the minimum number of employees required = 388.
Hence, at 95% confidence level 400 employees is enough for estimating the working
hours within 1 hour.
8ANALYTICAL SKILL FOUNDATION
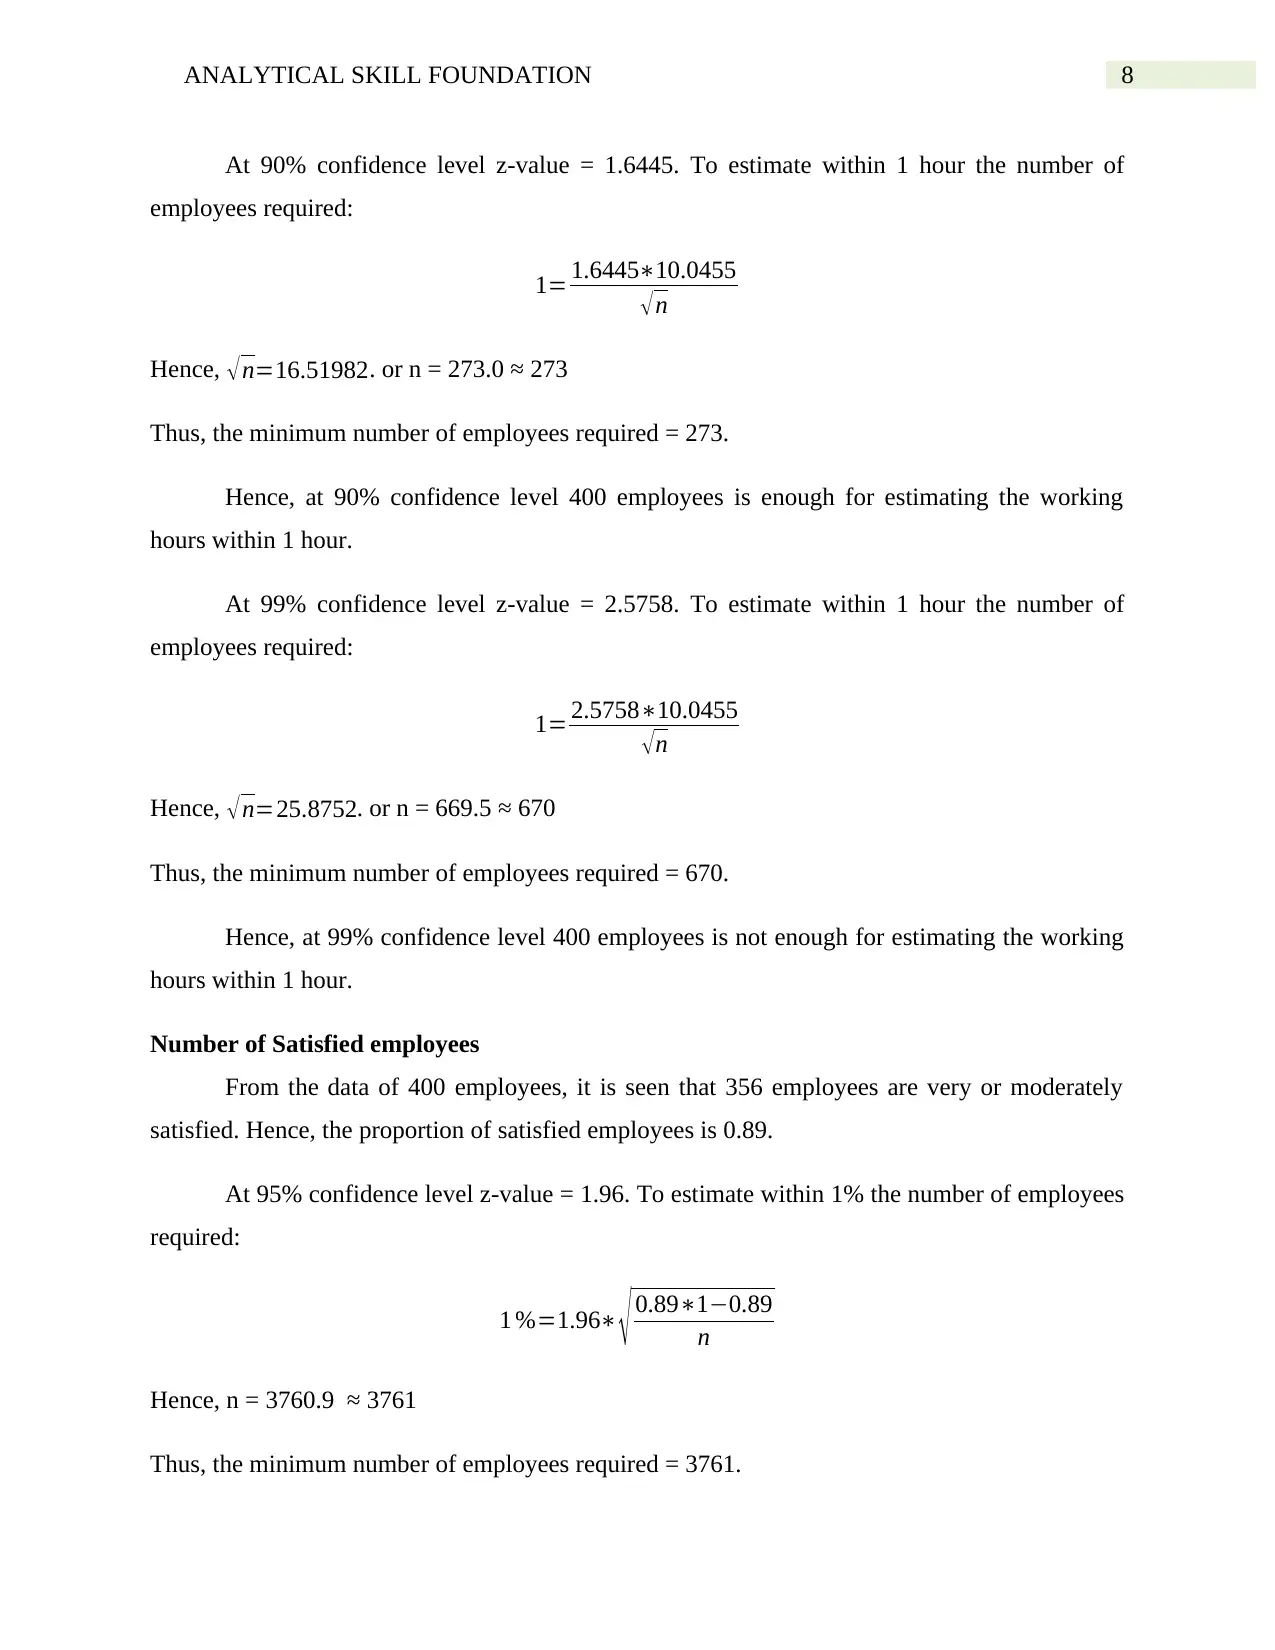
At 90% confidence level z-value = 1.6445. To estimate within 1 hour the number of
employees required:
1= 1.6445∗10.0455
√ n
Hence, √n=16.51982. or n = 273.0 ≈ 273
Thus, the minimum number of employees required = 273.
Hence, at 90% confidence level 400 employees is enough for estimating the working
hours within 1 hour.
At 99% confidence level z-value = 2.5758. To estimate within 1 hour the number of
employees required:
1= 2.5758∗10.0455
√ n
Hence, √ n=25.8752. or n = 669.5 ≈ 670
Thus, the minimum number of employees required = 670.
Hence, at 99% confidence level 400 employees is not enough for estimating the working
hours within 1 hour.
Number of Satisfied employees
From the data of 400 employees, it is seen that 356 employees are very or moderately
satisfied. Hence, the proportion of satisfied employees is 0.89.
At 95% confidence level z-value = 1.96. To estimate within 1% the number of employees
required:
1 %=1.96∗ √ 0.89∗1−0.89
n
Hence, n = 3760.9 ≈ 3761
Thus, the minimum number of employees required = 3761.
⊘ This is a preview!⊘
Do you want full access?
Subscribe today to unlock all pages.
Trusted by 1+ million students worldwide
9ANALYTICAL SKILL FOUNDATION
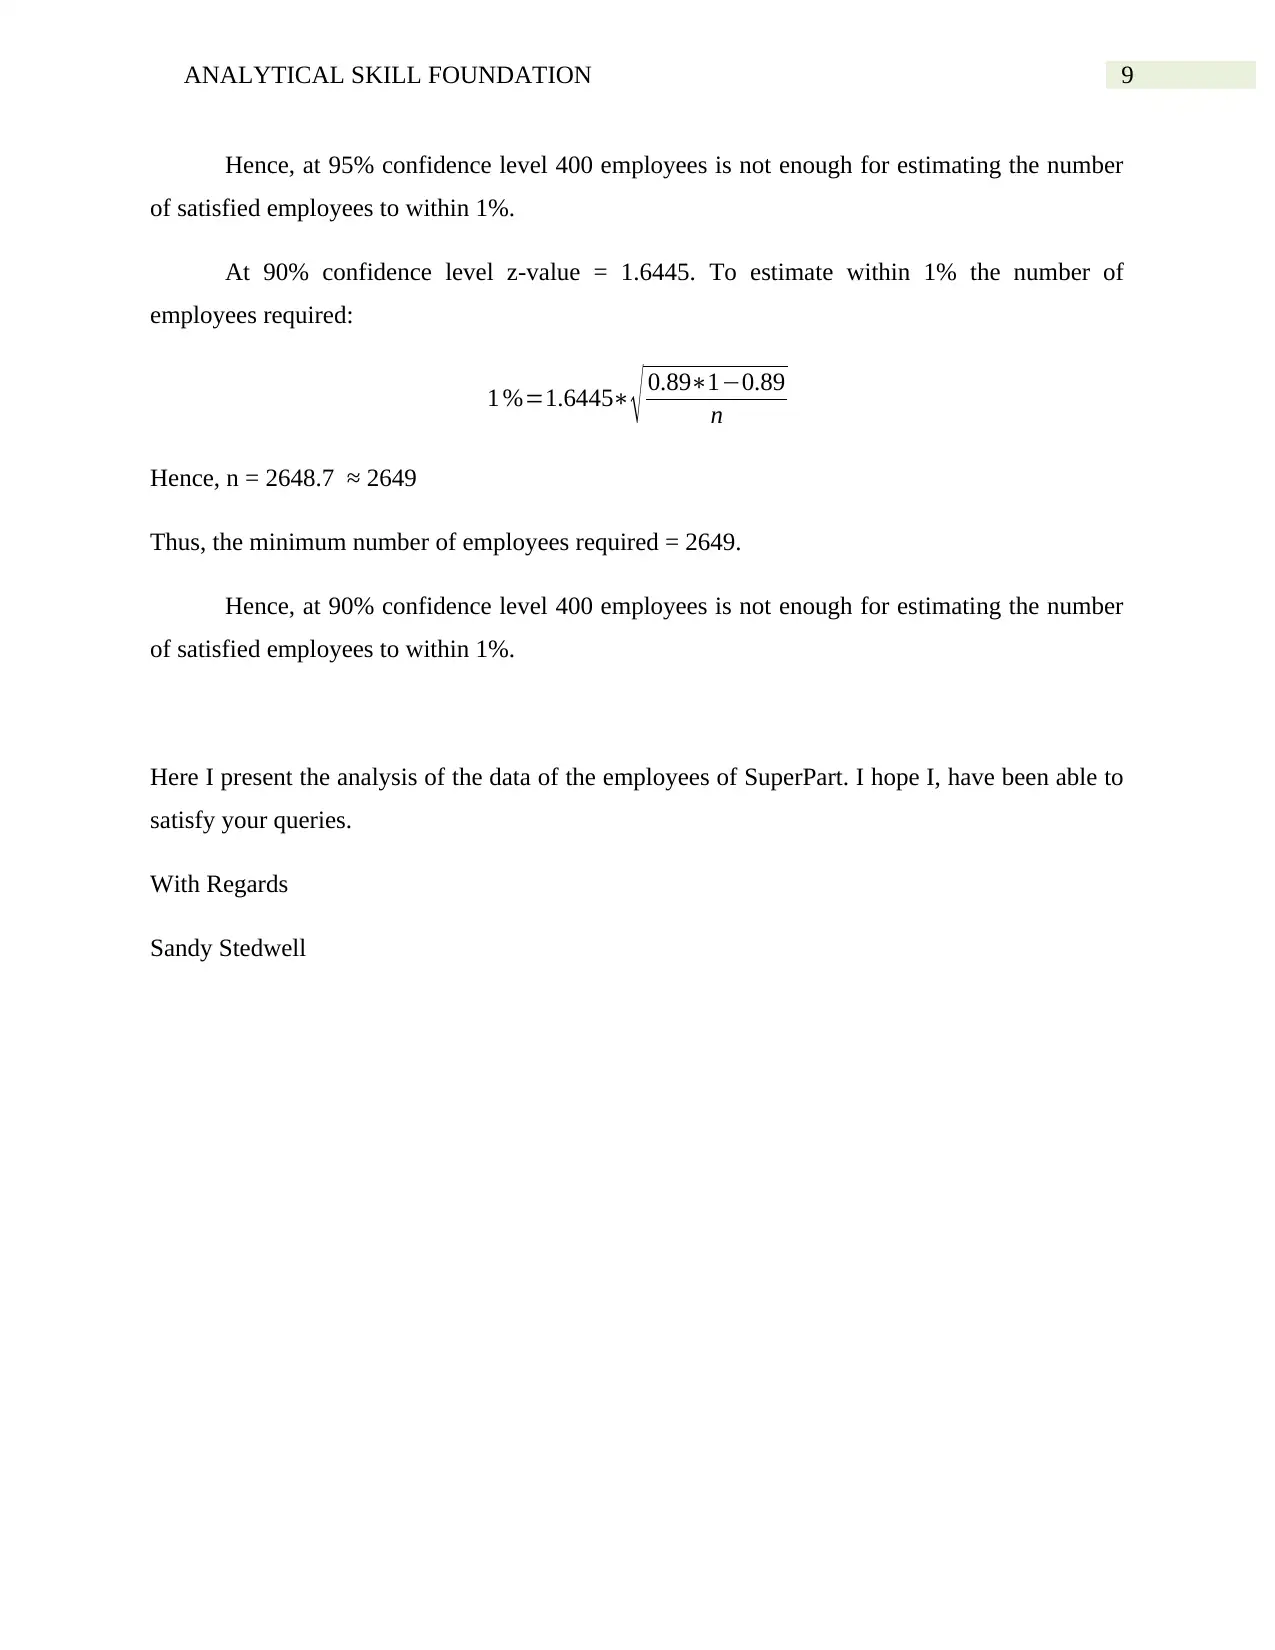
Hence, at 95% confidence level 400 employees is not enough for estimating the number
of satisfied employees to within 1%.
At 90% confidence level z-value = 1.6445. To estimate within 1% the number of
employees required:
1 %=1.6445∗ √ 0.89∗1−0.89
n
Hence, n = 2648.7 ≈ 2649
Thus, the minimum number of employees required = 2649.
Hence, at 90% confidence level 400 employees is not enough for estimating the number
of satisfied employees to within 1%.
Here I present the analysis of the data of the employees of SuperPart. I hope I, have been able to
satisfy your queries.
With Regards
Sandy Stedwell
1 out of 10
Related Documents


Your All-in-One AI-Powered Toolkit for Academic Success.
+13062052269
info@desklib.com
Available 24*7 on WhatsApp / Email
![[object Object]](/_next/static/media/star-bottom.7253800d.svg)
Unlock your academic potential
Copyright © 2020–2026 A2Z Services. All Rights Reserved. Developed and managed by ZUCOL.