Employee Turnover in the Automobile Industry: A Research Report
VerifiedAdded on 2022/08/22
|12
|2028
|18
Report
AI Summary
This report investigates the impact of employee turnover in the automobile industry. It employs a mixed-methods approach, combining quantitative surveys of 100 employees with qualitative interviews of five managers. The research explores the relationship between workplace environment factors and employee turnover. Quantitative analysis reveals demographic profiles, survey responses using a Likert scale, and statistical correlations. Key findings include the impact of managers creating an inclusive climate, work pressure, and reward systems on employee retention. Qualitative analysis explores the root causes of turnover, such as adapting to new technologies and work pressure, and suggests the positive impact on profitability. The study uses correlation and regression analysis to determine the factors with the most influence, providing insights into the dynamics of employee turnover within the industry. The report concludes with recommendations to improve employee retention and mitigate the negative effects of high turnover rates.
Running head: IMPACT OF EMPLOYEE TURNOVER IN AUTOMOBILE INDUSTRY
IMPACT OF EMPLOYEE TURNOVER IN AUTOMOBILE INDUSTRY
Name of the student:
Name of the university:
Author Note:
IMPACT OF EMPLOYEE TURNOVER IN AUTOMOBILE INDUSTRY
Name of the student:
Name of the university:
Author Note:
Paraphrase This Document
Need a fresh take? Get an instant paraphrase of this document with our AI Paraphraser
1IMPACT OF EMPLOYEE TURNOVER IN AUTOMOBILE INDUSTRY
Table of Contents
Methods......................................................................................................................................2
Results........................................................................................................................................3
Quantitative Analysis.............................................................................................................3
Demographic Profile..........................................................................................................3
Survey Profile.....................................................................................................................4
Statistics.............................................................................................................................4
Qualitative Analysis...............................................................................................................5
References..................................................................................................................................7
Appendices – A..........................................................................................................................9
Appendices – B........................................................................................................................10
2IMPACT OF EMPLOYEE TURNOVER IN AUTOMOBILE INDUSTRY
Methods
Both qualitative and quantitative methods of research are carried out to understand the
aftermath of high turnover of employees in the automobile industry (Bankar, Kakade &
More, 2016). This mixed research design will help to evaluate both the response of the
participants in details and assess the general information about them (Hennink, Hutter &
Bailey, 2020). This research will also help in determining the relationship shared between the
factors of the workplace environment that can be responsible for the exclusion of the
employees from the industry of automobiles (Tracy, 2019). For the research to be carried out
successfully, primary data is collected in the sample from the various organizations of the
automobile industries. Primary data is very much efficient and reliable in nature because, it is
collected by the researchers from the immediate sources and are effective in the study
(Rutberg & Bouikidis, 2018). The data is collected by the method of questionnaire from the
employees and interview of managers.
A sample of 100 employees were selected for this survey randomly from the various
organizations of the automobile industry who were encountered with the questionnaire survey
in order to obtain their reviews and analyse the effect of employee reduction. In addition, to
that an interview was also conducted amongst the five managers from various organizations
for the qualitative research method.
The statistical technique to check the relation between two components is termed as
the correlation. This technique checks how much one variable in the relation is dependent on
the other one (Bryman, 2017). The coefficient of correlation determines how strongly or
weakly the variables are analogous with each other. Numerical value of correlation
coefficient varies from the range (+1) to (-1), depending on which the favourable correlation
⊘ This is a preview!⊘
Do you want full access?
Subscribe today to unlock all pages.
Trusted by 1+ million students worldwide
3IMPACT OF EMPLOYEE TURNOVER IN AUTOMOBILE INDUSTRY
and unfavourable correlation are determined (Brannen, 2017). If the value of correlation is
positive and varies from zero to (+1), then it is the condition of favourable correlation.
For the investigation purpose, the Likert-scale technique is implemented that has five
categories that ranges from ‘Strongly Disagree’ to ‘Strongly Agree’. The interviewer has
decided to implement this technique in the questionnaire such that the respondents can avoid
giving ambiguous answers and thus be direct and straightforward with their answers (Chiat &
Panatik, 2019). This content analysis will be conducted by a questionnaire that will have a
thorough detailed answer from the respondents. This questionnaire will particularly
determine the key factors behind employee turnover.
Results
Quantitative Analysis
Demographic Profile
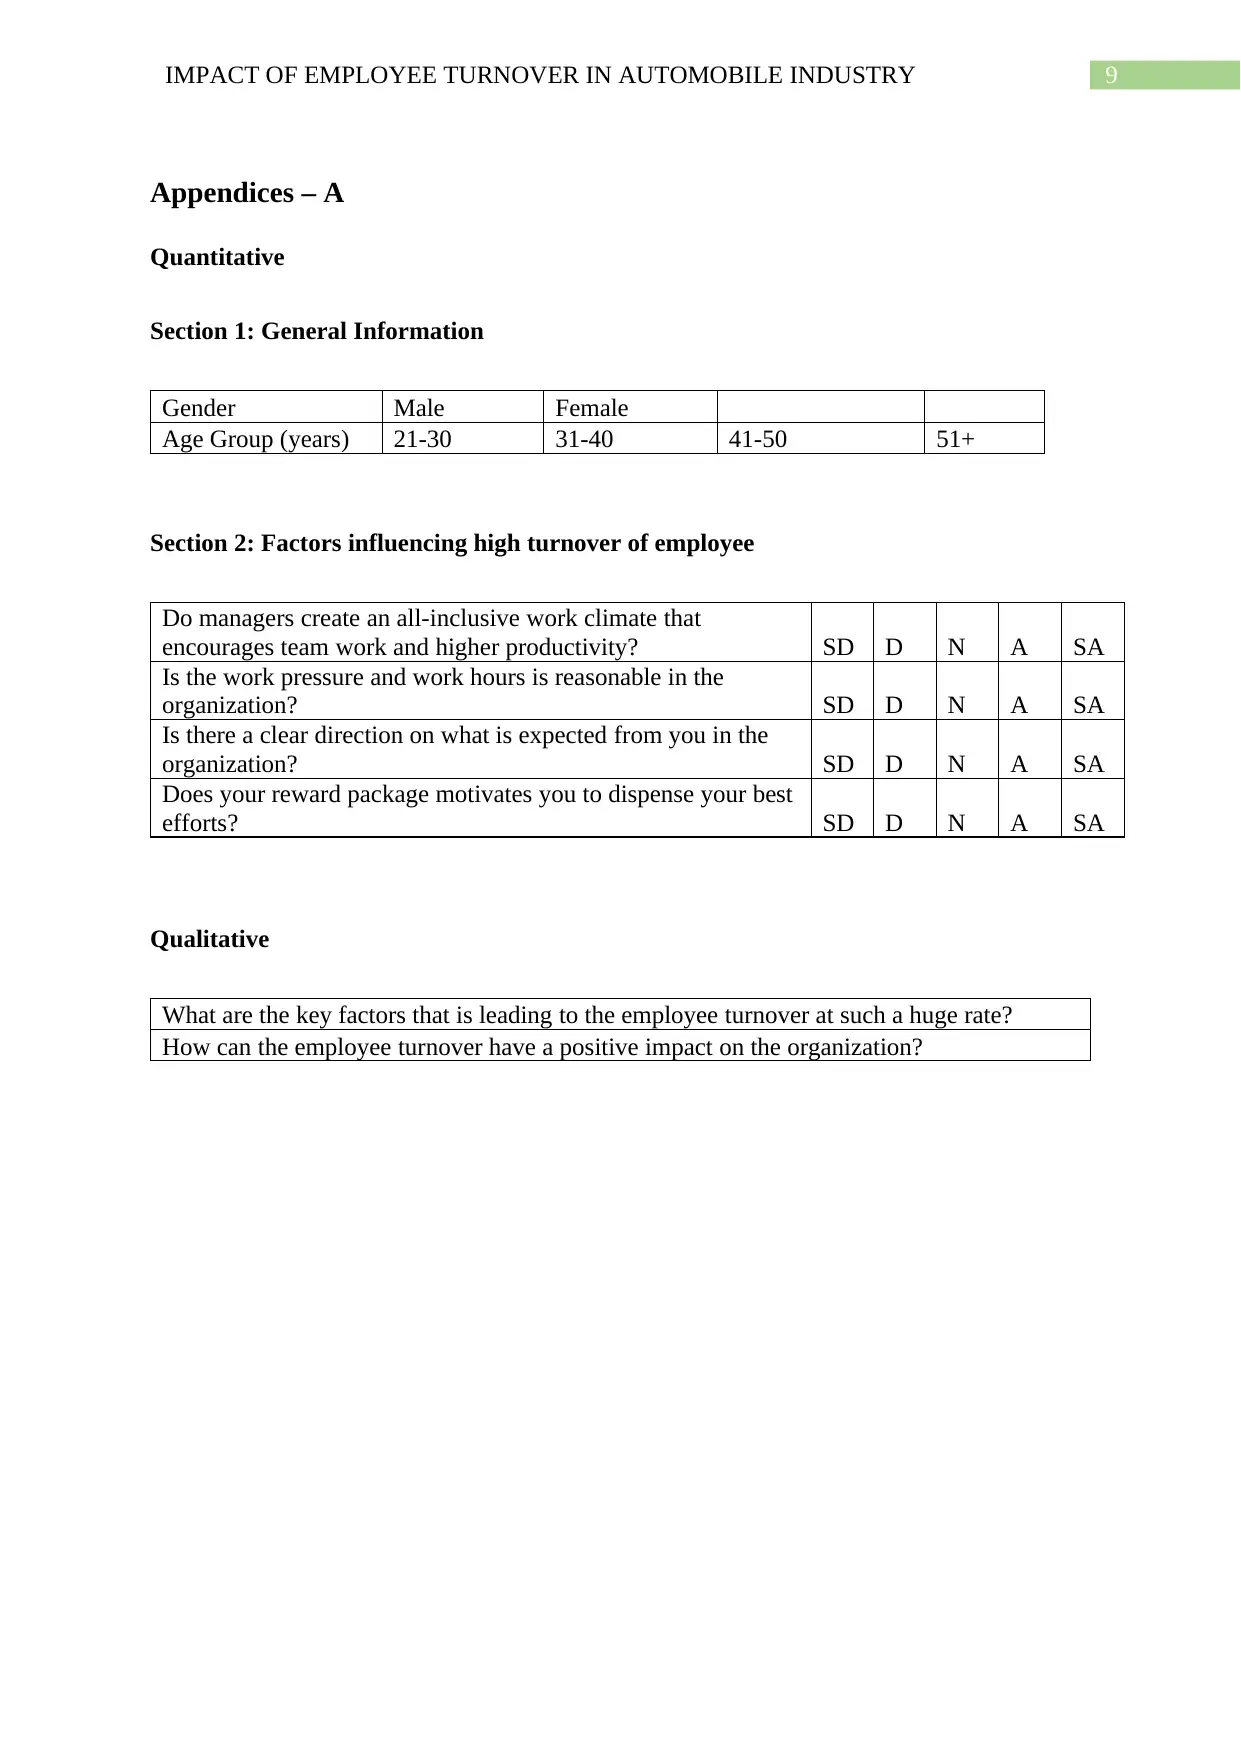
The sample that is collected for the research contains the details of 100 employees
that were questioned to assess the significant impact of the turnover of the employees from
the organizations in the automobile industries. This information included the gender of the
employees and their age groups. With the statistical analysis of these data obtained from the
employees, a clear view is generated about the description of the sample collected for the
research study. The pie chart is derived by analysing the data sample that depicts the gender
of the employees in percentage. Amongst the data, 59% staffs are female whereas 41% are
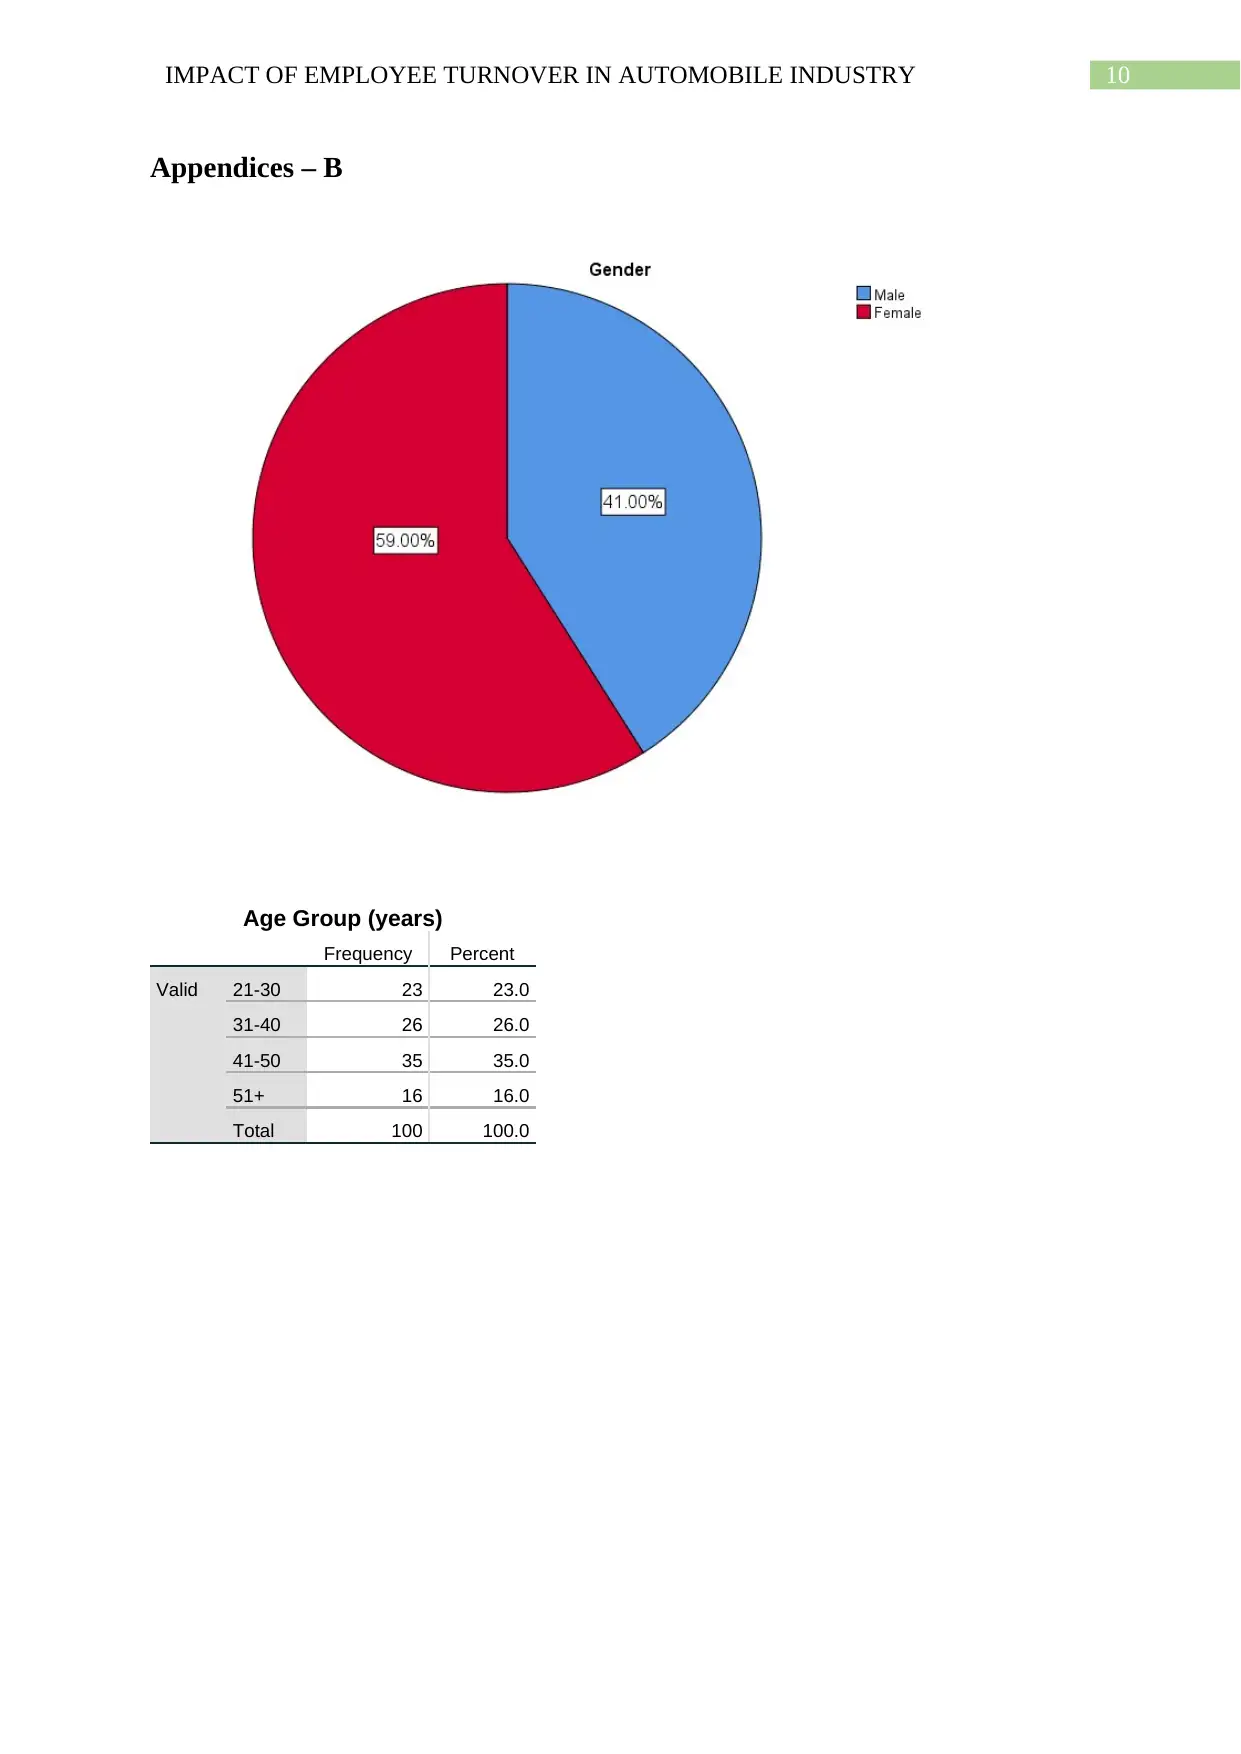
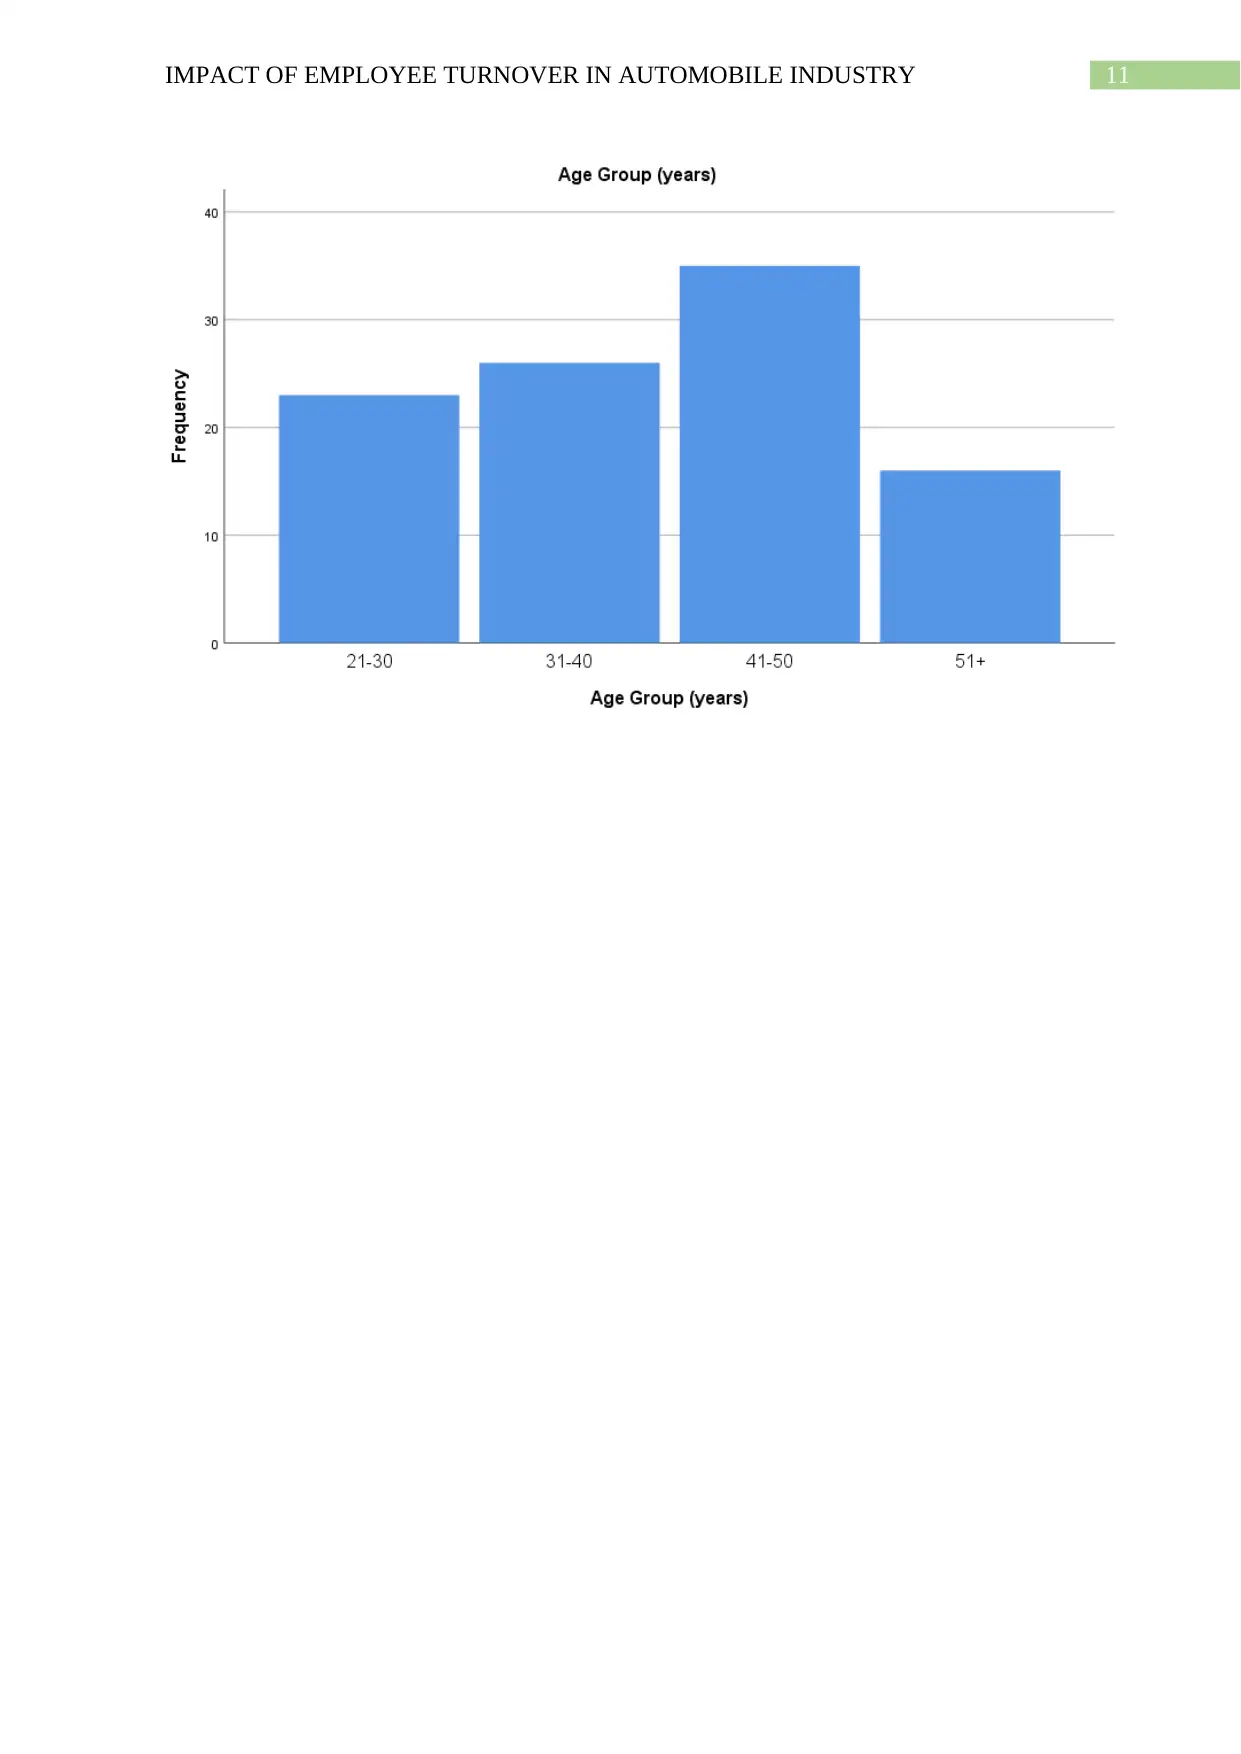
male. Apart from the classification of gender, the age groups of the staffs are also
categorised into four sections that are (21-30) years, (31-40 years), (41-50) years and the
employees that are more than 50 years. While calculating the frequencies from the data
sample, it is seen that 23% employees have experience of hardly one to three years. A
percentage of 26% employees’ works in the age group of 31-40 years. The maximum
and unfavourable correlation are determined (Brannen, 2017). If the value of correlation is
positive and varies from zero to (+1), then it is the condition of favourable correlation.
For the investigation purpose, the Likert-scale technique is implemented that has five
categories that ranges from ‘Strongly Disagree’ to ‘Strongly Agree’. The interviewer has
decided to implement this technique in the questionnaire such that the respondents can avoid
giving ambiguous answers and thus be direct and straightforward with their answers (Chiat &
Panatik, 2019). This content analysis will be conducted by a questionnaire that will have a
thorough detailed answer from the respondents. This questionnaire will particularly
determine the key factors behind employee turnover.
Results
Quantitative Analysis
Demographic Profile
The sample that is collected for the research contains the details of 100 employees
that were questioned to assess the significant impact of the turnover of the employees from
the organizations in the automobile industries. This information included the gender of the
employees and their age groups. With the statistical analysis of these data obtained from the
employees, a clear view is generated about the description of the sample collected for the
research study. The pie chart is derived by analysing the data sample that depicts the gender
of the employees in percentage. Amongst the data, 59% staffs are female whereas 41% are
male. Apart from the classification of gender, the age groups of the staffs are also
categorised into four sections that are (21-30) years, (31-40 years), (41-50) years and the
employees that are more than 50 years. While calculating the frequencies from the data
sample, it is seen that 23% employees have experience of hardly one to three years. A
percentage of 26% employees’ works in the age group of 31-40 years. The maximum
Paraphrase This Document
Need a fresh take? Get an instant paraphrase of this document with our AI Paraphraser
4IMPACT OF EMPLOYEE TURNOVER IN AUTOMOBILE INDUSTRY
percentage of employees belong to the age group of 41-50 years and thus it can be said that
the automobile industry possesses experienced employees. However, only 16% employees
are above the age of 50 years and are about to retire from their job life.
Survey Profile
Once the details of the employees are taken, the questionnaire set is presented to the
employees for the survey to extract specific answers from them by the Likert-scale technique.
The question 1 of the survey experiences that 42% of the employees agree to the fact that if
the manager initiates an all-inclusive work atmosphere, it tends to high productivity and
lessens the chances of employee turnover. However, 40% employees stay neutral with this
question and could not detect whether this factor is influential enough for the employee
turnover or not.
The second factor is the work pressure of the organization that relatively increases the
work hours of the employees (Basheer et al., 2019). From the analysis, 52% employees agree
to the fact that due to excessive work pressure and work hour extension, their stress level
increases. Hence, they are forced to leave their job to find better opportunities.
If there is a lack of clear direction and proper guidance, the employees will be highly
confused about their roles and responsibilities in the organizations and will not be able to
perform efficiently (Sandalika & Jayasekara, 2017). Hence, from the sample, 46% of the
staffs agree to the fact that they need proper vision to perform well else, they will be forced to
leave the organization. Rewards and recognition are also a motivating factor for the
employees and 44% employees from the sample agrees that if they are not receiving rewards
for their best efforts, it will lead to high chances of employee turnover from the companies.
Statistics
Correlation
5IMPACT OF EMPLOYEE TURNOVER IN AUTOMOBILE INDUSTRY
The analysis of the factors shows that each of the factors are highly correlated at 0.01 level of
significance. It is found in the analysis that there is a strong correlation between managers
creating an all-inclusive climate and work-pressure in the organization (r = 0.700). Similarly,
the creation of all-inclusive climate has a positive strong correlation with reward system (r =
0.688).
Regression
We test the impact of three factors responsible for turnover. Two independent factors
have a statistical effect on the on the turnover of the members and can be predicted at large
due to the p-value is less than 0.05 (Saranya, 2017). However, clear direction does not have a
statistically significant impact on turnover of employees.
The factors of reward and increased workload pressure on the remaining employees
can predict 56.8% of turnover of employees. However, we find that the three factors
collectively have a statistically significant impact on managers creating an all-inclusive
climate, which leads to less turnover.
Qualitative Analysis
Q1. What are the key factors that is leading to the employee turnover at such a huge
rate?
The employees are not being able to accustom themselves with the new age digital
technologies. They require ample trainings to become efficient with the new processes and
products. Hence, it is better to incorporate new age people who are already accustomed with
the knowledge of digital technologies rather than implementing training programs for the old
ones. Furthermore, the existing employees are not satisfied with the increase in the enhanced
⊘ This is a preview!⊘
Do you want full access?
Subscribe today to unlock all pages.
Trusted by 1+ million students worldwide
6IMPACT OF EMPLOYEE TURNOVER IN AUTOMOBILE INDUSTRY
business processes and they are finding it difficult to cope up with the work pressure. This is
leading to the dissatisfaction of the employees with their job role.
Q2. How can the employee turnover have a positive impact on the organization?
Due to reduction of employees from the organization, the organization will majorly
benefit from the net profitability that was spend for the excess employees of the
organizations. The cost behind the employees can be spend on the automated processes that
will be replaced in the place of the employees. Hence the amount spend on the employees
were a recurring cost whereas the amount spend on the machineries and automated processes
will be a onetime cost. This proves to be lucrative for the organizations in the automobile
industries.
Paraphrase This Document
Need a fresh take? Get an instant paraphrase of this document with our AI Paraphraser
7IMPACT OF EMPLOYEE TURNOVER IN AUTOMOBILE INDUSTRY
References
Bankar, S., Kakade, M. D., & More, M. A. (2016). Employee Turnover–A Study of its Cause
and Effect with Special reference to Automobile Sector. International Journal of
Advanced Engineering Research and Science (JJAERS), 3(2), 11-14.
Basheer, M. F., Hameed, W. U., Rashid, A., & Nadim, M. (2019). Factors effecting
Employee Loyalty through Mediating role of Employee Engagement: Evidence from
PROTON Automotive Industry, Malaysia. Journal of Managerial Sciences, 13(2).
Brannen, J. (2017). Mixing methods: Qualitative and quantitative research. Routledge.
Bryman, A. (2017). Quantitative and qualitative research: further reflections on their
integration. In Mixing methods: Qualitative and quantitative research (pp. 57-78).
Routledge.
Chiat, L. C., & Panatik, S. A. (2019). Perceptions of Employee Turnover Intention by
Herzberg’s Motivation-Hygiene Theory: A Systematic Literature Review. Journal of
Research in Psychology, 1(2), 10-15.
Hennink, M., Hutter, I., & Bailey, A. (2020). Qualitative research methods. SAGE
Publications Limited.
Rutberg, S., & Bouikidis, C. D. (2018). Focusing on the fundamentals: A simplistic
differentiation between qualitative and quantitative research. Nephrology Nursing
Journal, 45(2), 209-213.
Sandalika, K. D. M., & Jayasekara, P. (2017). Impact of Performance Management System
on Employee Job Satisfaction in Automobile Companies in Western Province, Sri
Lanka. Human Resource Management Journal, 5(1).
8IMPACT OF EMPLOYEE TURNOVER IN AUTOMOBILE INDUSTRY
Saranya, S. (2017). Organisational conflict and its impact on employee absenteeism: A study
among women employees working in IT sector, Chennai. International Journal, 5(5),
92-97.
Tracy, S. J. (2019). Qualitative research methods: Collecting evidence, crafting analysis,
communicating impact. John Wiley & Sons.
⊘ This is a preview!⊘
Do you want full access?
Subscribe today to unlock all pages.
Trusted by 1+ million students worldwide
9IMPACT OF EMPLOYEE TURNOVER IN AUTOMOBILE INDUSTRY
Appendices – A
Quantitative
Section 1: General Information
Gender Male Female
Age Group (years) 21-30 31-40 41-50 51+
Section 2: Factors influencing high turnover of employee
Do managers create an all-inclusive work climate that
encourages team work and higher productivity? SD D N A SA
Is the work pressure and work hours is reasonable in the
organization? SD D N A SA
Is there a clear direction on what is expected from you in the
organization? SD D N A SA
Does your reward package motivates you to dispense your best
efforts? SD D N A SA
Qualitative
What are the key factors that is leading to the employee turnover at such a huge rate?
How can the employee turnover have a positive impact on the organization?
Paraphrase This Document
Need a fresh take? Get an instant paraphrase of this document with our AI Paraphraser
10IMPACT OF EMPLOYEE TURNOVER IN AUTOMOBILE INDUSTRY
Appendices – B
Age Group (years)
Frequency Percent
Valid 21-30 23 23.0
31-40 26 26.0
41-50 35 35.0
51+ 16 16.0
Total 100 100.0
Appendices – B
Age Group (years)
Frequency Percent
Valid 21-30 23 23.0
31-40 26 26.0
41-50 35 35.0
51+ 16 16.0
Total 100 100.0
11IMPACT OF EMPLOYEE TURNOVER IN AUTOMOBILE INDUSTRY
⊘ This is a preview!⊘
Do you want full access?
Subscribe today to unlock all pages.
Trusted by 1+ million students worldwide
1 out of 12
Related Documents


Your All-in-One AI-Powered Toolkit for Academic Success.
+13062052269
info@desklib.com
Available 24*7 on WhatsApp / Email
![[object Object]](/_next/static/media/star-bottom.7253800d.svg)
Unlock your academic potential
Copyright © 2020–2026 A2Z Services. All Rights Reserved. Developed and managed by ZUCOL.