Federation University: Big Data Analysis of Energy Consumption
VerifiedAdded on 2021/06/14
|16
|2837
|338
Report
AI Summary
This report provides an analysis of energy consumption, focusing on drivers of power usage and CO2 emissions, drawing insights from the Solar Cities project. It explores factors influencing energy consumption, such as building characteristics, and utilizes Watson Analytics for predictive analysis. The analysis includes charts illustrating power usage based on roof color, PV capacity, insulation, age groups, and house types. The report also examines recommendations for reducing energy consumption, including insulation, minimizing penetration, LED lighting, renewable energy sources (PV panels), and triple-coated windows. The study aims to provide data-driven insights and actionable recommendations for improving energy efficiency and reducing carbon footprint.

BIG DATA AND
ANALYTICS
ANALYTICS
Paraphrase This Document
Need a fresh take? Get an instant paraphrase of this document with our AI Paraphraser
Table of Contents
1. Introduction.......................................................................................................................................1
1.1 Background of the Project........................................................................................................2
1.2 Scope...........................................................................................................................................2
2. Factors for energy consumption.......................................................................................................3
3. Predictive Analysis By using Watson Analytics..............................................................................3
4. Recommendations to Reduce Power Consumption.......................................................................14
5. Conclusion........................................................................................................................................14
References................................................................................................................................................14
1
1. Introduction
The main objective of this projects is to understand concepts of power consumption
drivers and to determine that high amount of electrical energy consumption from the coal fired
plants. As well as we need to examine the drivers of CO2. Throughout this project we are going
to research about solar cities project. The research will be based on which combination of
features highlight where efficiencies could be made in the energy consumption reduction and
analyze the predictive model along with the discussion about demand on future energy use and
CO2 gas emission. This predictive analysis will be done by using Watson Analytics. Then the
factors that contribute to power usage will be determined. To reduce the energy consumption and
CO2 emission, some recommendations will be provided.
1.1 Background of the Project
The Solar urban communities project was a task drove by the University of Ballarat,
(previous name of Federation University), which included the enlistment of family units and
organizations over the LoddonMallee and Grampians areas to screen changes in energy
utilization. The undertaking took a gander at various variables that could impact energy
utilization. These components were separated into sets of highlights, and estimations were taken
for each particular element. For instance, a factor could be identified with a home's development
materials. In which case an element could be "staying development compose" and an estimation
would be taken to decide the development write for each abode and put away in the
informational collection. For instance "abiding development compose" could contain the
qualities block, block facade and so forth... A large number of these highlights are incorporated
inside the given Solar Cities informational collection.
The accompanying are sets of highlights incorporated into the given informational
collection:
Adoption of sunlight based energy innovations
Geographic attributes
Physical qualities of the abodes, including such things as the homes age, estimate,
number of stories, number of lights, protection and so on.
2
⊘ This is a preview!⊘
Do you want full access?
Subscribe today to unlock all pages.
Trusted by 1+ million students worldwide
1.2 Scope
The primary goal of this project is to comprehend the drivers of energy utilization, and as
a huge level of electrical energy is made by coal terminated plants, at that point then again the
drivers of CO2.
2. Factors for energy consumption
Building structures can be utilized for an assortment of capacities: regulatory workplaces,
personnel workplaces, classrooms, labs for research and classes, nourishment administrations,
gathering rooms, ponder territories and on and on.We've assembled these utilizations into four
sorts that we call classrooms, labs, group, and workplaces. Each compose has anenergy profile.
For instance, workplaces, classrooms and group spaces by and large utilize less energy
contrasted with research centers since a portion of the air is recycled all through the building.
The distribution of air takes into consideration less molding (warming and cooling) of the air and
results in less energy being utilized (Balan & Otto, 2017).
Then again, building structures with lab spaces normally utilize a great deal of energy
since they regularly require significantly higher ventilation rates than an office, and the air can't
be recycled. The air coming into a lab must be 100% outside air (not recycled), and after that it
should totally leave the working through the fumes frameworks. Moving this amount of air with
fans, and warming and cooling the air, is anenergy serious process.
A portion of the elements that influence energy use on our rundown above are building
attributes that can't be changed, for example, the kind of development, age of the building and
outside air temperature. Factors, for example, the kind of development (e.g. solid, block,
surrounded dividers, and so on), windows and protection are influenced by the California Energy
Code. The California Energy Code was made in 1978 and a few more up to date forms have been
discharged from that point forward, each increasing present expectations for energy productivity
somewhat higher.
3. Predictive Analysis By using Watson Analytics
By predictive analysis, some ideas have provided for energy consumption in buildings
that are given below. The analysis has been done through IBM Watson analysis and visualization
tool. The predictive analysis helps us to plan future CO2 emission reduction in buildings.
3
Paraphrase This Document
Need a fresh take? Get an instant paraphrase of this document with our AI Paraphraser
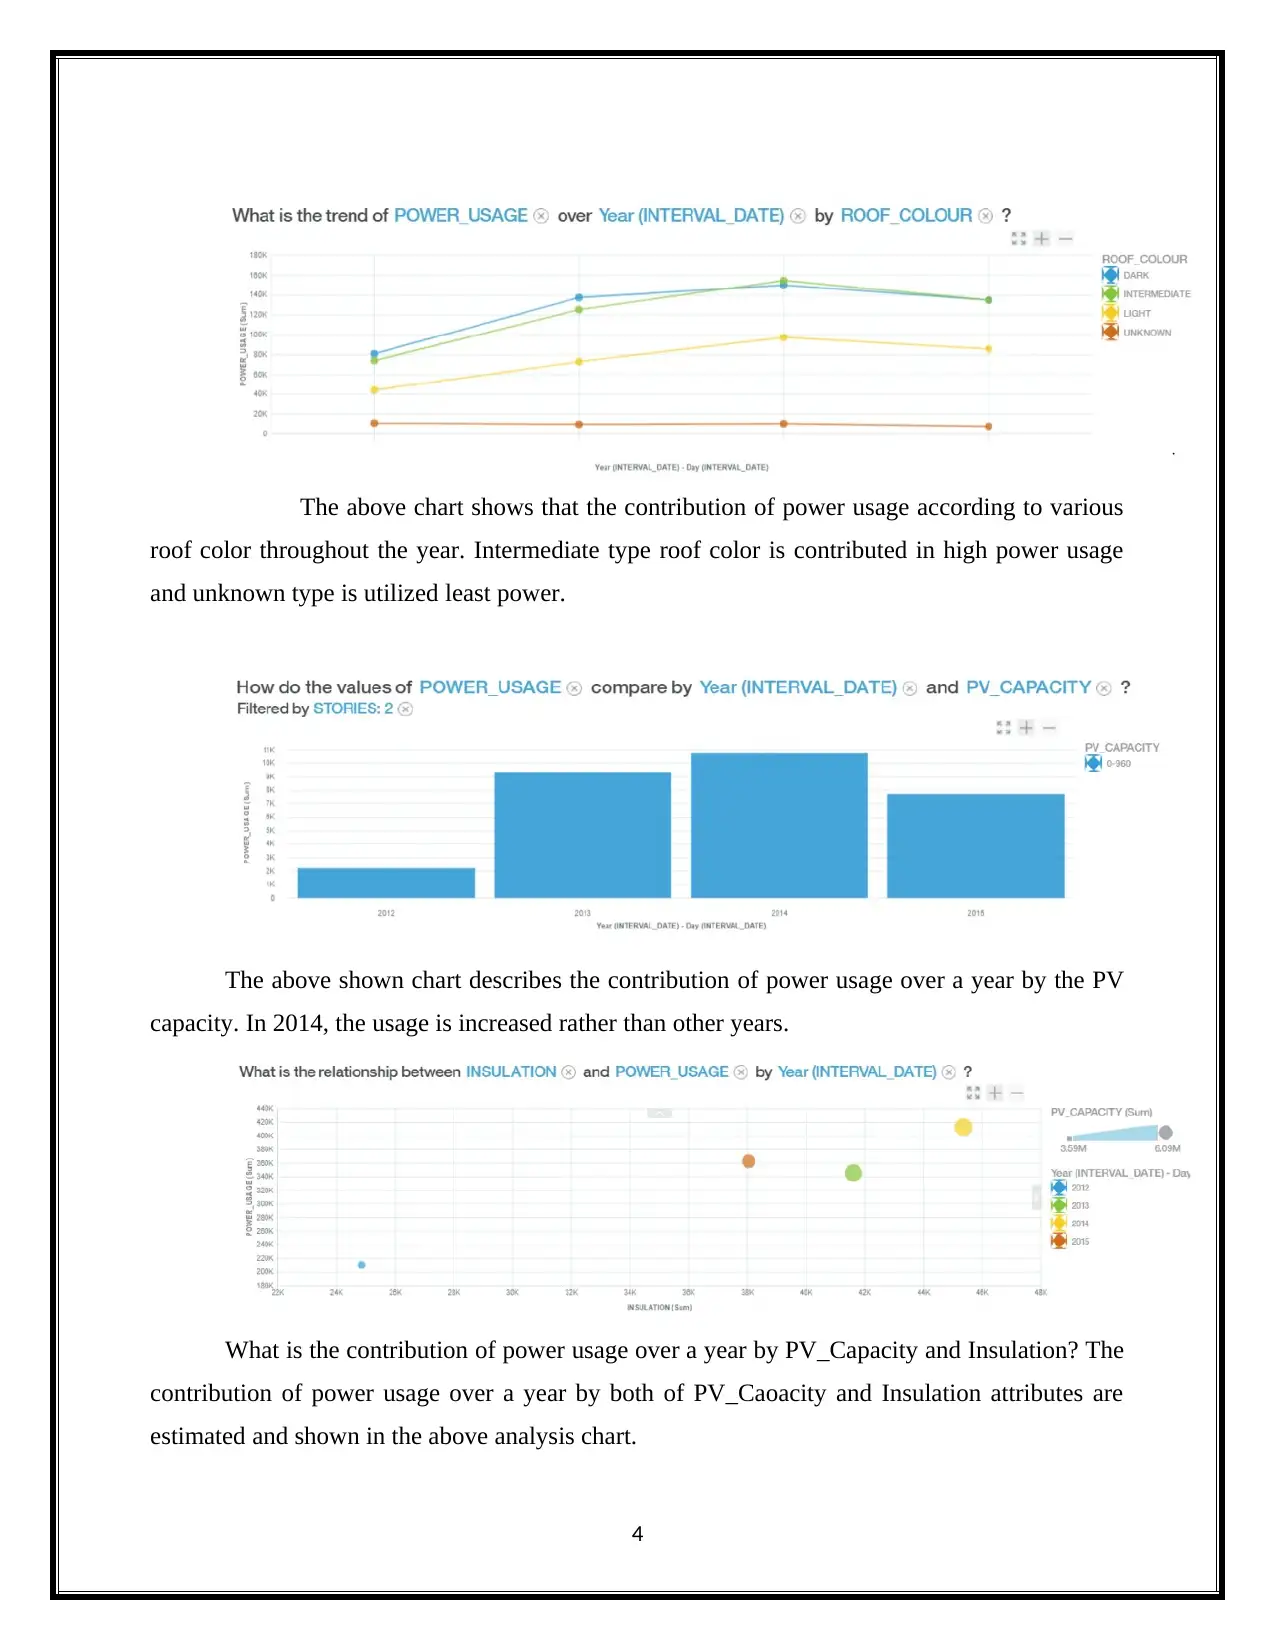
The above chart shows that the contribution of power usage according to various
roof color throughout the year. Intermediate type roof color is contributed in high power usage
and unknown type is utilized least power.
The above shown chart describes the contribution of power usage over a year by the PV
capacity. In 2014, the usage is increased rather than other years.
What is the contribution of power usage over a year by PV_Capacity and Insulation? The
contribution of power usage over a year by both of PV_Caoacity and Insulation attributes are
estimated and shown in the above analysis chart.
4
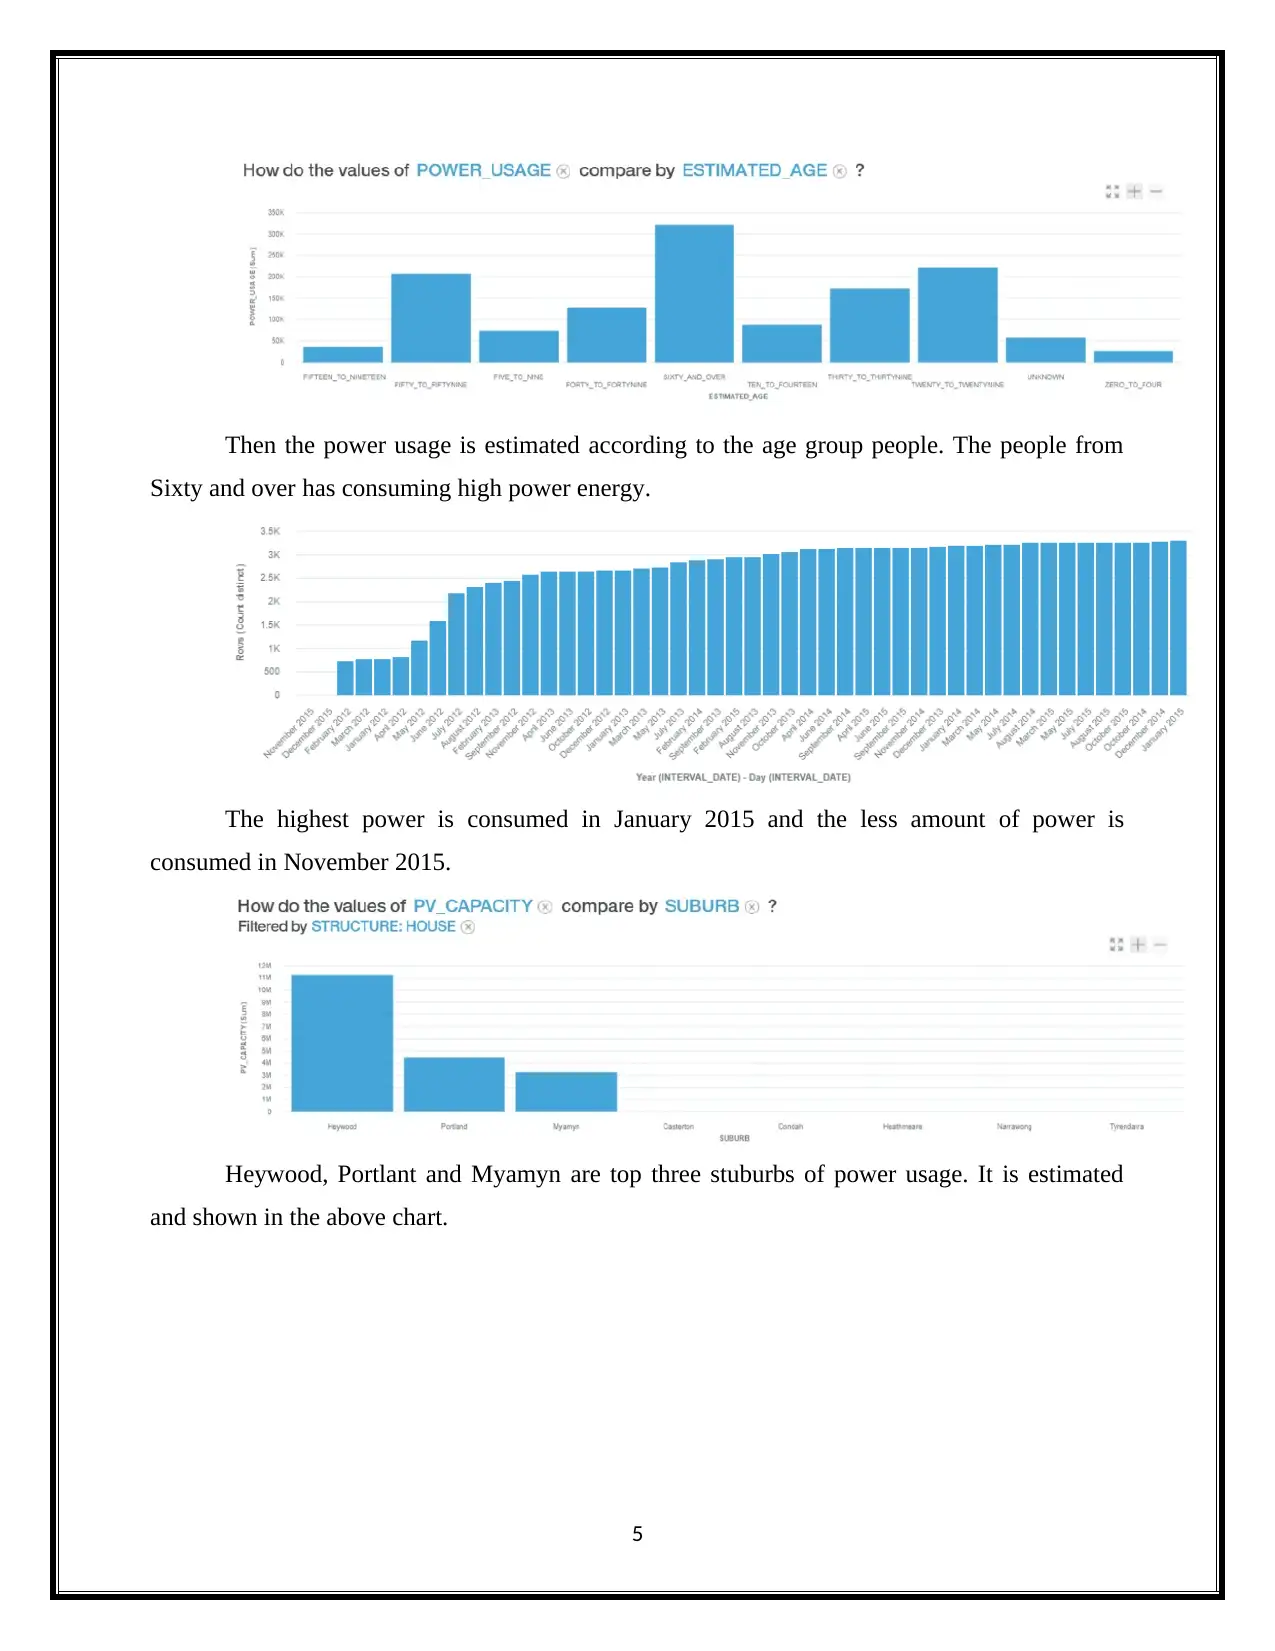
Then the power usage is estimated according to the age group people. The people from
Sixty and over has consuming high power energy.
The highest power is consumed in January 2015 and the less amount of power is
consumed in November 2015.
Heywood, Portlant and Myamyn are top three stuburbs of power usage. It is estimated
and shown in the above chart.
5
Sixty and over has consuming high power energy.
The highest power is consumed in January 2015 and the less amount of power is
consumed in November 2015.
Heywood, Portlant and Myamyn are top three stuburbs of power usage. It is estimated
and shown in the above chart.
5
⊘ This is a preview!⊘
Do you want full access?
Subscribe today to unlock all pages.
Trusted by 1+ million students worldwide
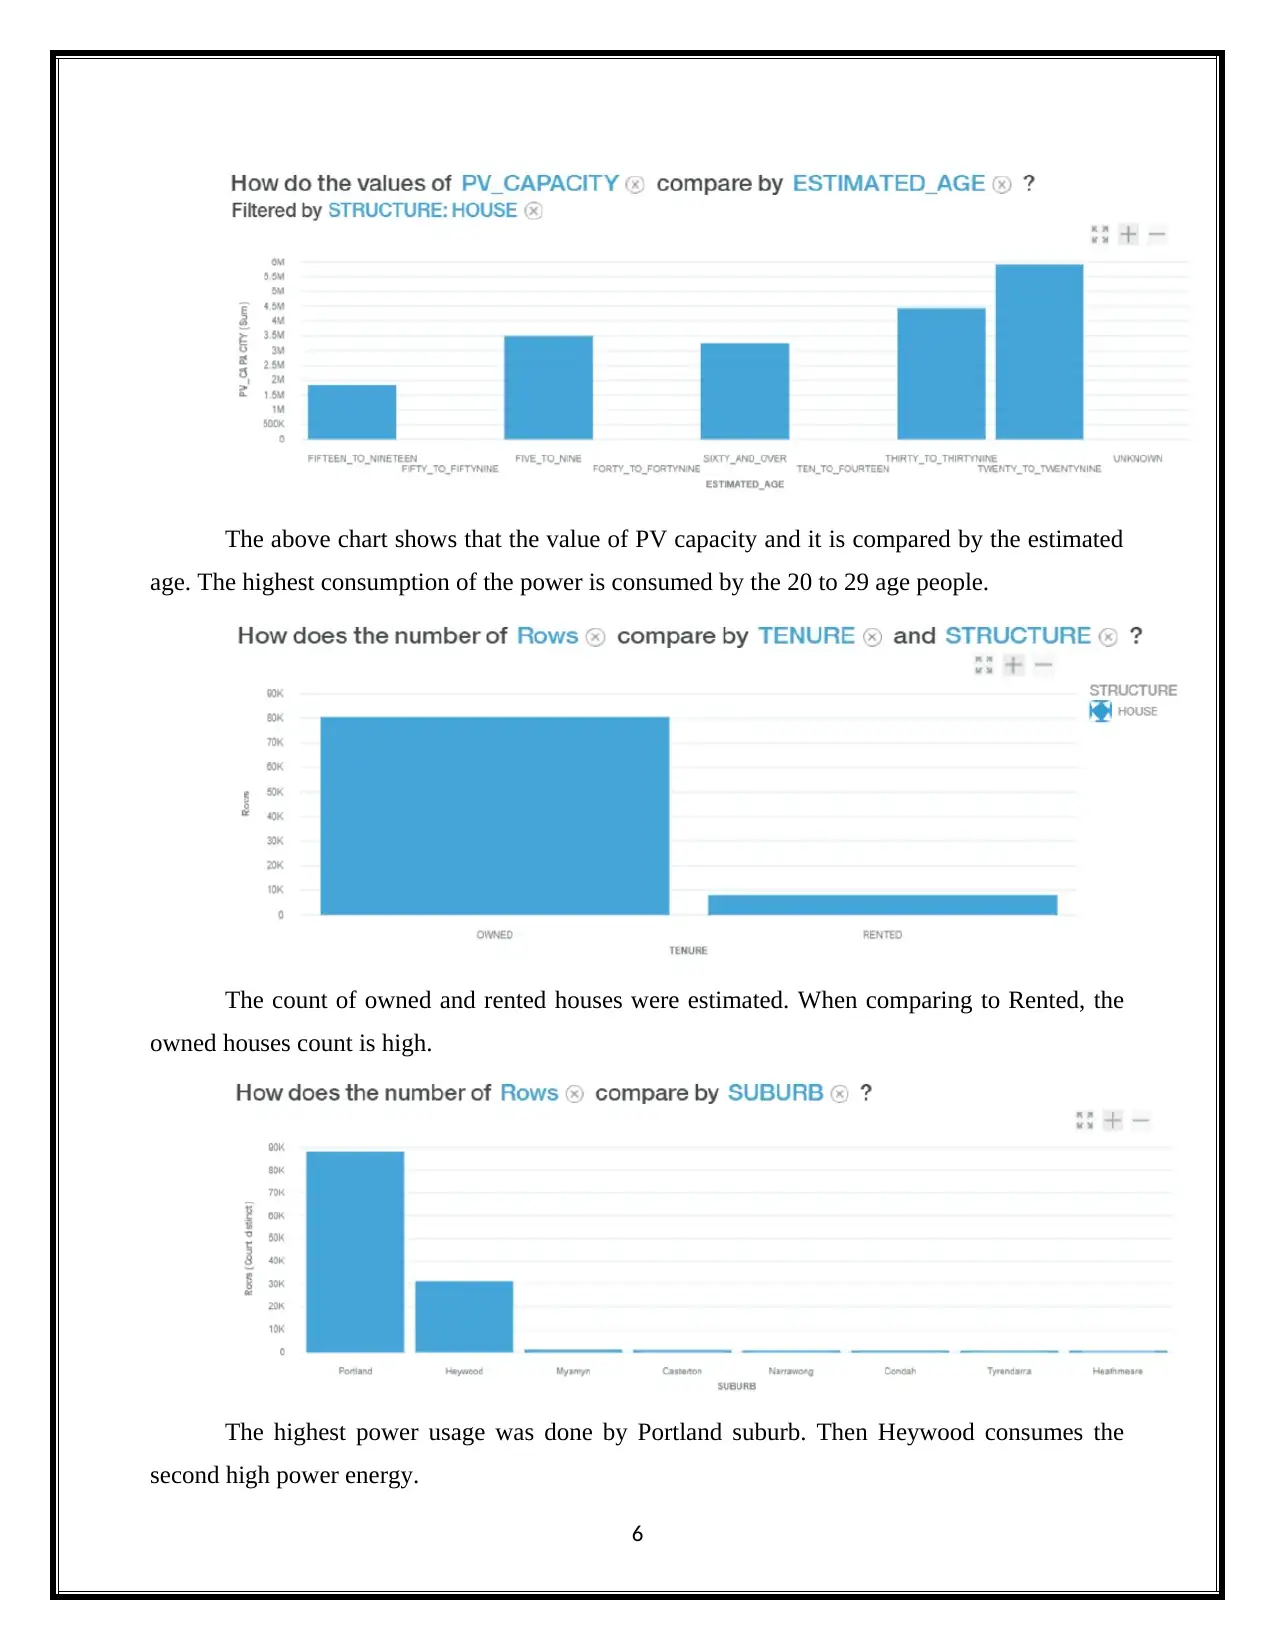
The above chart shows that the value of PV capacity and it is compared by the estimated
age. The highest consumption of the power is consumed by the 20 to 29 age people.
The count of owned and rented houses were estimated. When comparing to Rented, the
owned houses count is high.
The highest power usage was done by Portland suburb. Then Heywood consumes the
second high power energy.
6
age. The highest consumption of the power is consumed by the 20 to 29 age people.
The count of owned and rented houses were estimated. When comparing to Rented, the
owned houses count is high.
The highest power usage was done by Portland suburb. Then Heywood consumes the
second high power energy.
6
Paraphrase This Document
Need a fresh take? Get an instant paraphrase of this document with our AI Paraphraser
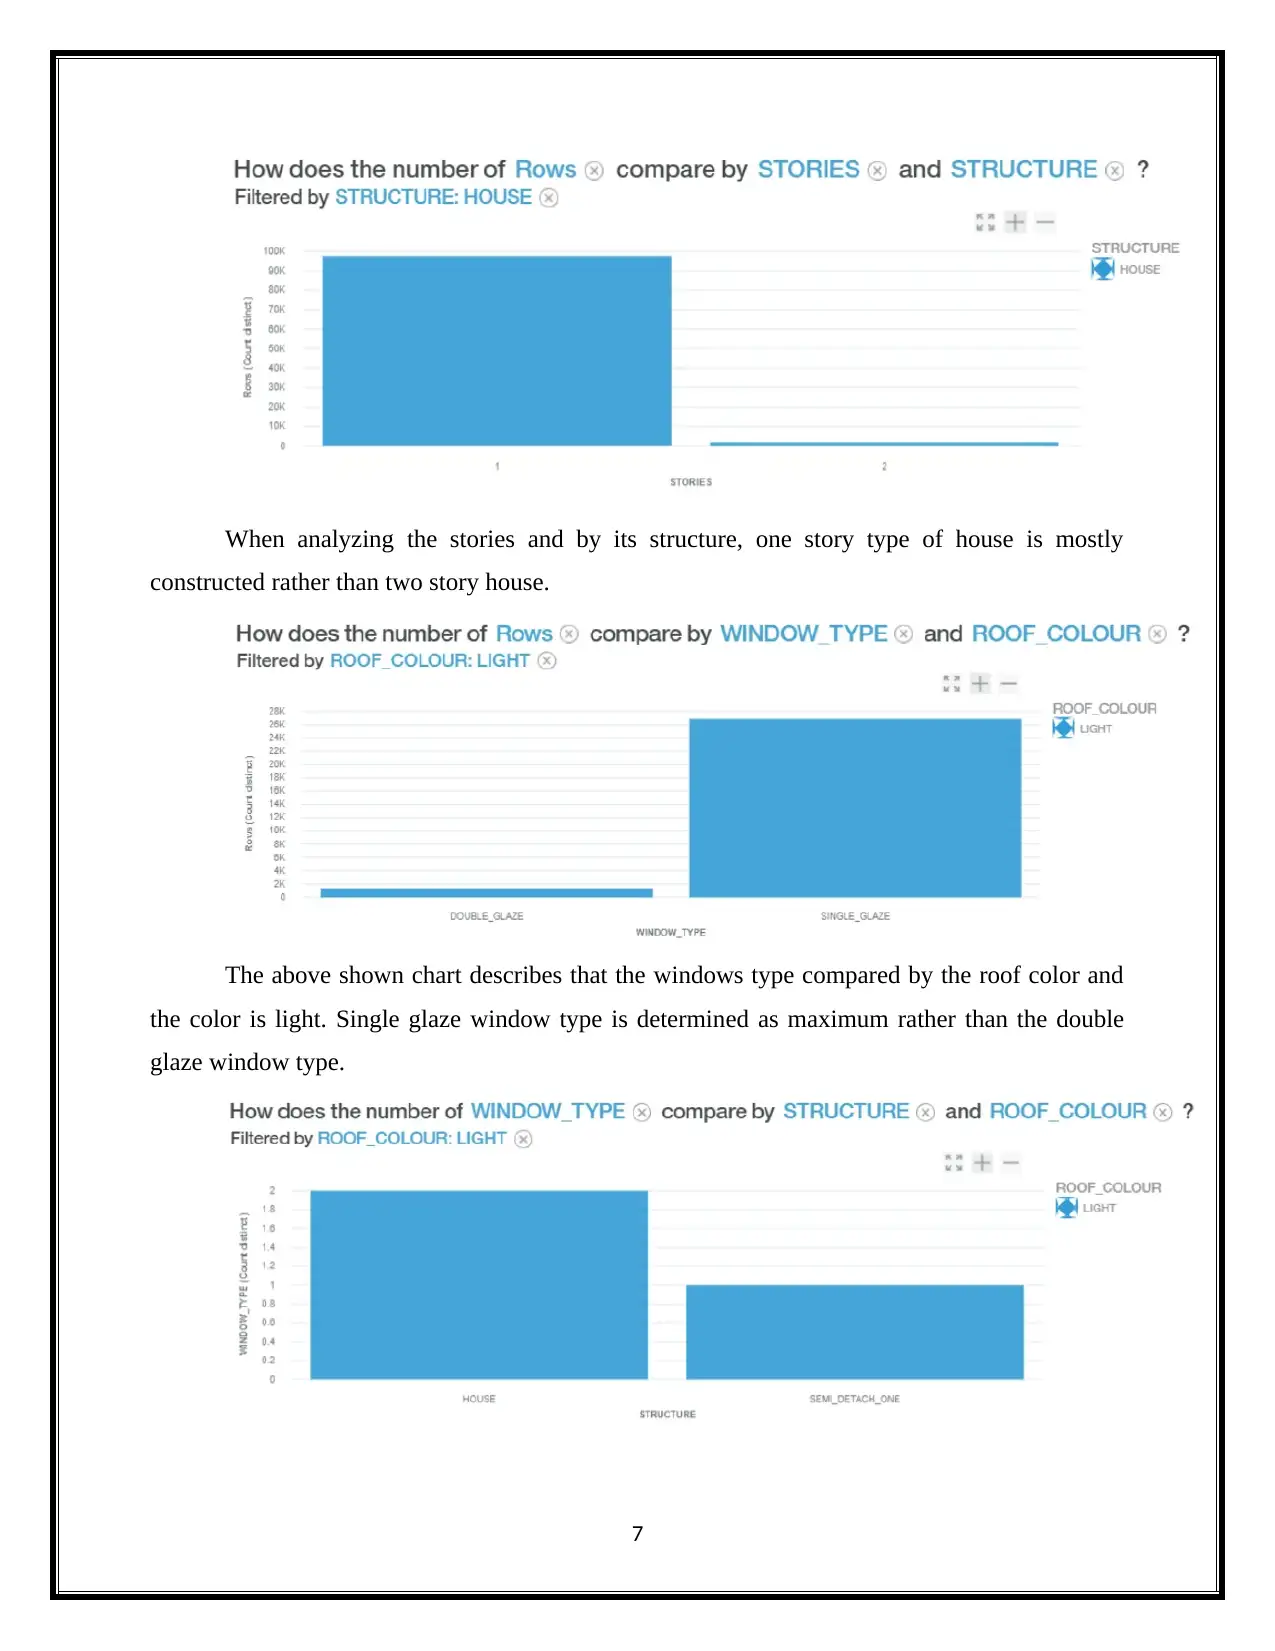
When analyzing the stories and by its structure, one story type of house is mostly
constructed rather than two story house.
The above shown chart describes that the windows type compared by the roof color and
the color is light. Single glaze window type is determined as maximum rather than the double
glaze window type.
7
constructed rather than two story house.
The above shown chart describes that the windows type compared by the roof color and
the color is light. Single glaze window type is determined as maximum rather than the double
glaze window type.
7
The window type is compared by its roof color and chosen roof color is light. When
comparing to semidetached one, the house type has highest count.
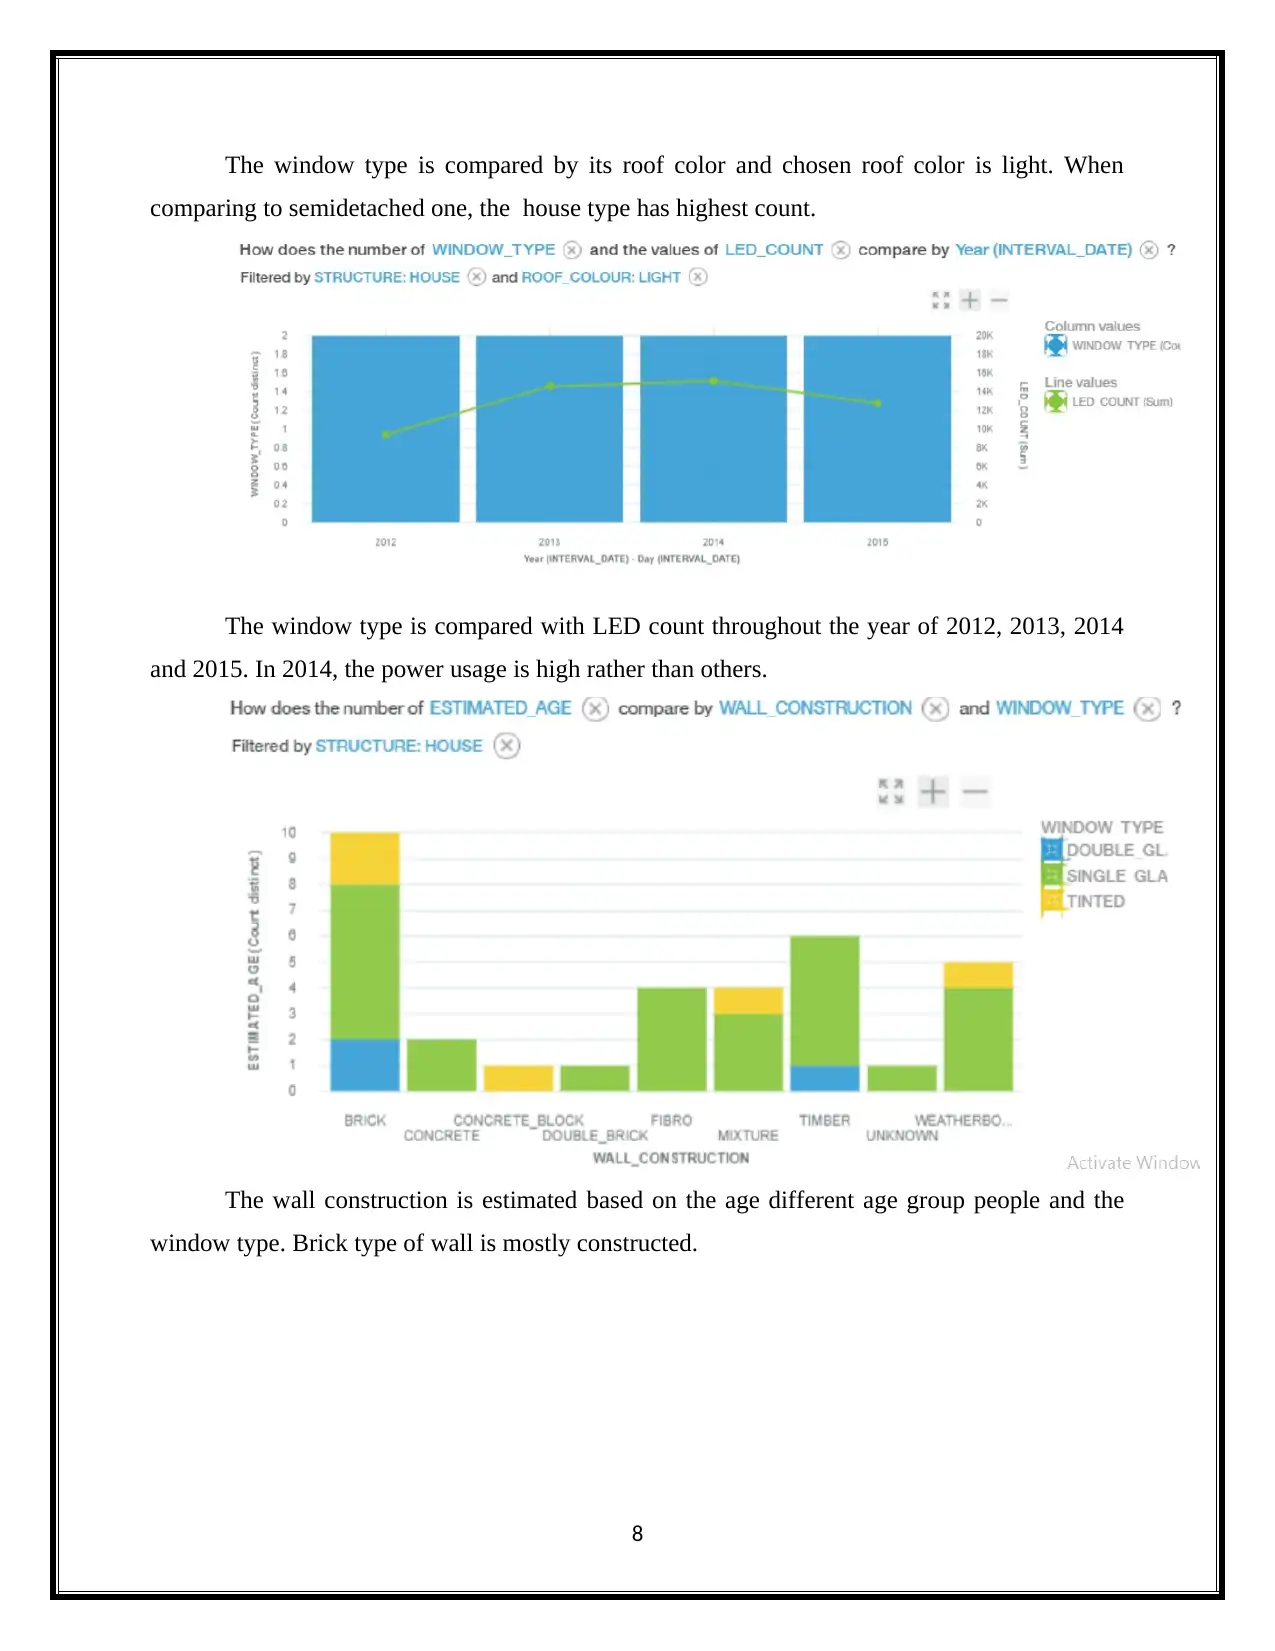
The window type is compared with LED count throughout the year of 2012, 2013, 2014
and 2015. In 2014, the power usage is high rather than others.
The wall construction is estimated based on the age different age group people and the
window type. Brick type of wall is mostly constructed.
8
comparing to semidetached one, the house type has highest count.
The window type is compared with LED count throughout the year of 2012, 2013, 2014
and 2015. In 2014, the power usage is high rather than others.
The wall construction is estimated based on the age different age group people and the
window type. Brick type of wall is mostly constructed.
8
⊘ This is a preview!⊘
Do you want full access?
Subscribe today to unlock all pages.
Trusted by 1+ million students worldwide
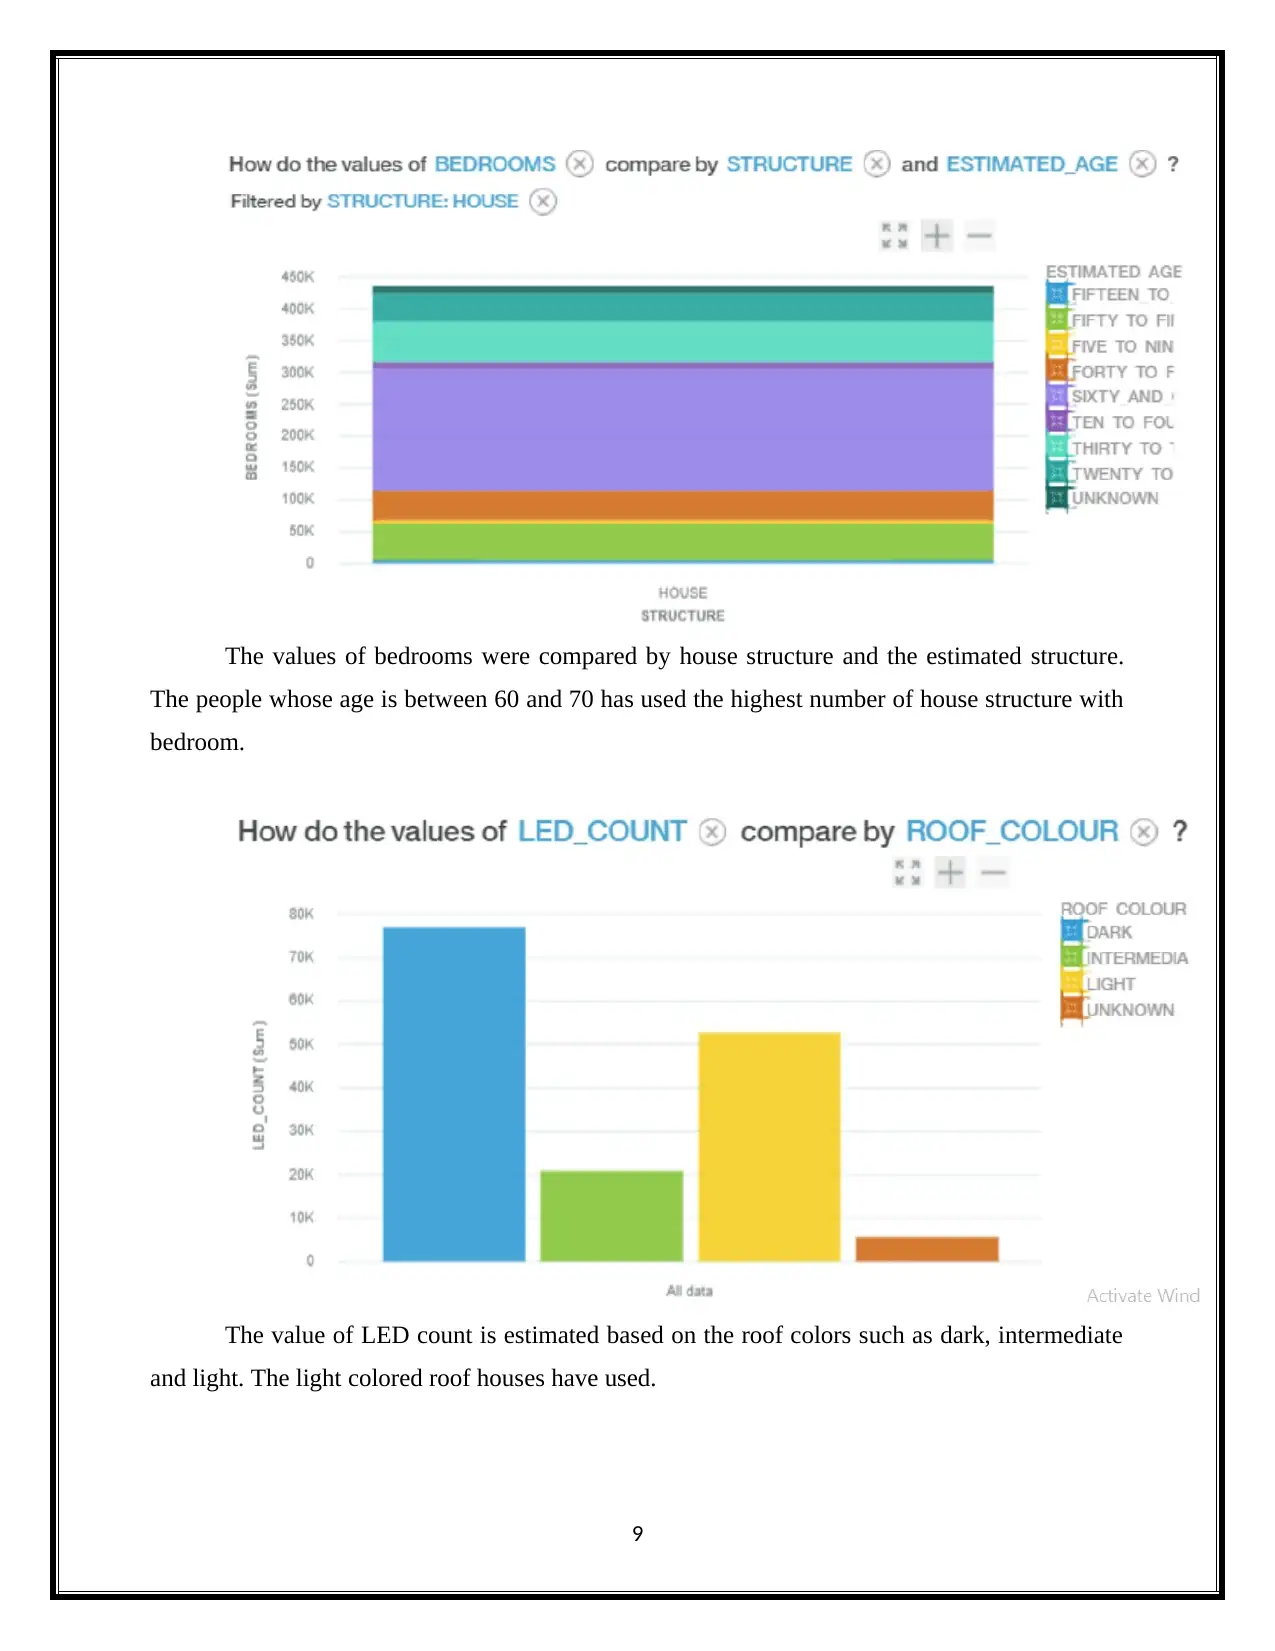
The values of bedrooms were compared by house structure and the estimated structure.
The people whose age is between 60 and 70 has used the highest number of house structure with
bedroom.
The value of LED count is estimated based on the roof colors such as dark, intermediate
and light. The light colored roof houses have used.
9
The people whose age is between 60 and 70 has used the highest number of house structure with
bedroom.
The value of LED count is estimated based on the roof colors such as dark, intermediate
and light. The light colored roof houses have used.
9
Paraphrase This Document
Need a fresh take? Get an instant paraphrase of this document with our AI Paraphraser
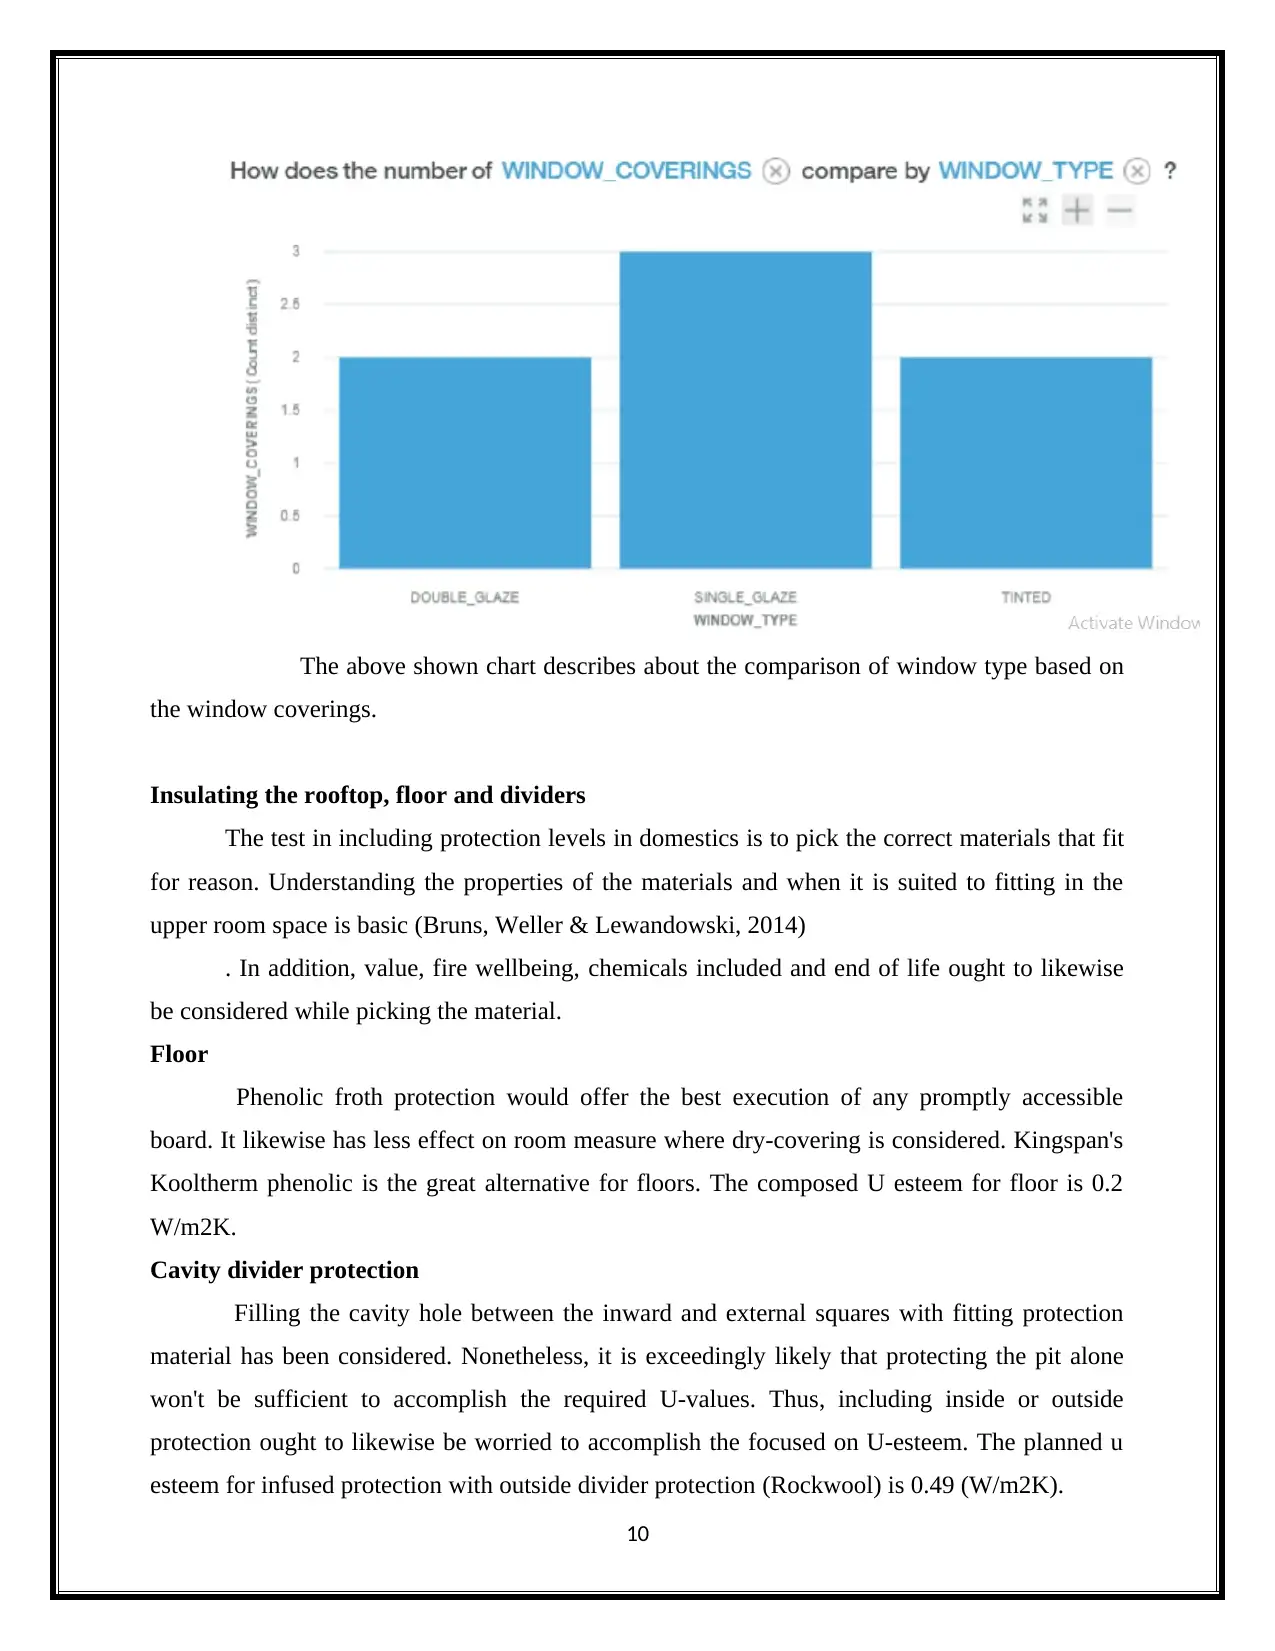
The above shown chart describes about the comparison of window type based on
the window coverings.
Insulating the rooftop, floor and dividers
The test in including protection levels in domestics is to pick the correct materials that fit
for reason. Understanding the properties of the materials and when it is suited to fitting in the
upper room space is basic (Bruns, Weller & Lewandowski, 2014)
. In addition, value, fire wellbeing, chemicals included and end of life ought to likewise
be considered while picking the material.
Floor
Phenolic froth protection would offer the best execution of any promptly accessible
board. It likewise has less effect on room measure where dry-covering is considered. Kingspan's
Kooltherm phenolic is the great alternative for floors. The composed U esteem for floor is 0.2
W/m2K.
Cavity divider protection
Filling the cavity hole between the inward and external squares with fitting protection
material has been considered. Nonetheless, it is exceedingly likely that protecting the pit alone
won't be sufficient to accomplish the required U-values. Thus, including inside or outside
protection ought to likewise be worried to accomplish the focused on U-esteem. The planned u
esteem for infused protection with outside divider protection (Rockwool) is 0.49 (W/m2K).
10
Roofs
Mineral fleece protection is very suggested for rooftop protection, 160 mm is included
amongst rafters and 100 mm underneath them. The planned U esteem for this situation is 0.15
(W/m2K).
Minimizing penetration
It is recommended that the first entryways on the property, with a U-estimation of 2.8
W/m2.K, ought to be supplanted with a superior triple coated entryway, diminishing the U-
estimation of the surface by 65%.
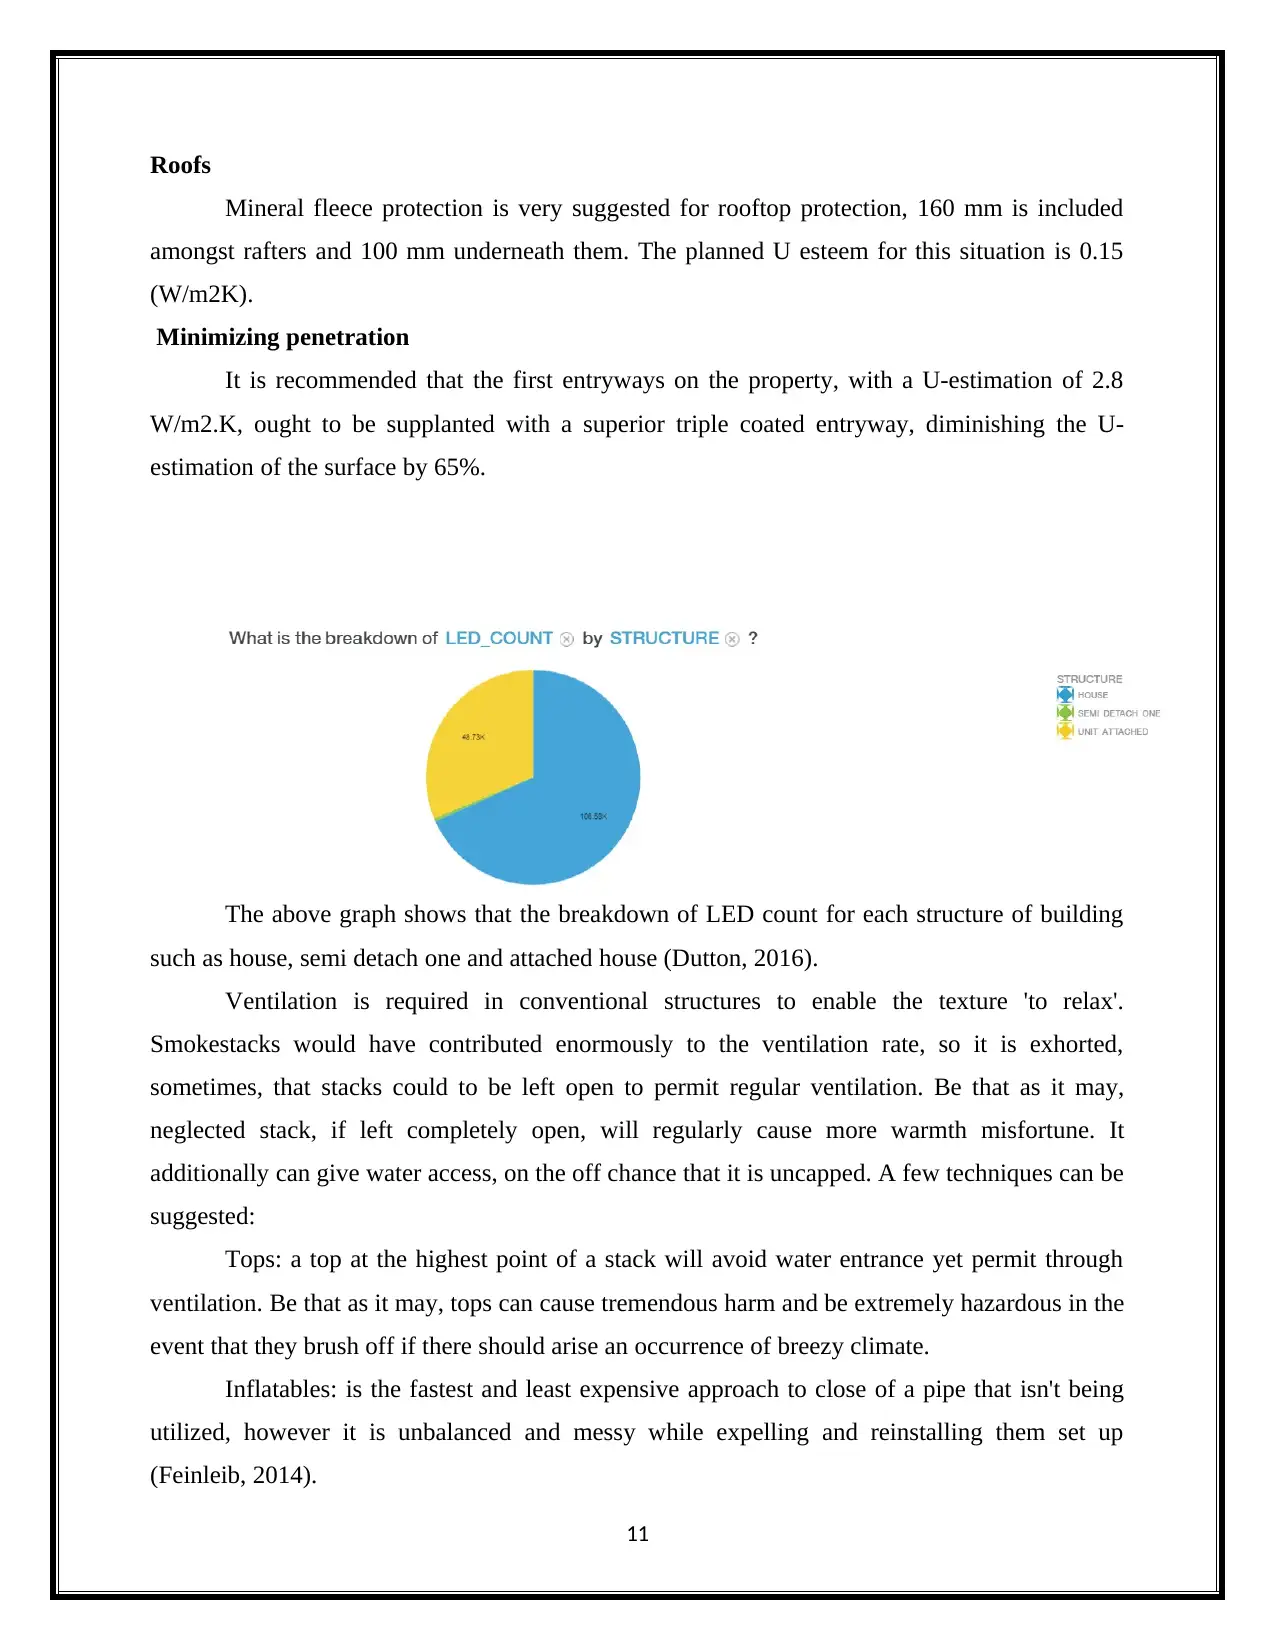
The above graph shows that the breakdown of LED count for each structure of building
such as house, semi detach one and attached house (Dutton, 2016).
Ventilation is required in conventional structures to enable the texture 'to relax'.
Smokestacks would have contributed enormously to the ventilation rate, so it is exhorted,
sometimes, that stacks could to be left open to permit regular ventilation. Be that as it may,
neglected stack, if left completely open, will regularly cause more warmth misfortune. It
additionally can give water access, on the off chance that it is uncapped. A few techniques can be
suggested:
Tops: a top at the highest point of a stack will avoid water entrance yet permit through
ventilation. Be that as it may, tops can cause tremendous harm and be extremely hazardous in the
event that they brush off if there should arise an occurrence of breezy climate.
Inflatables: is the fastest and least expensive approach to close of a pipe that isn't being
utilized, however it is unbalanced and messy while expelling and reinstalling them set up
(Feinleib, 2014).
11
Mineral fleece protection is very suggested for rooftop protection, 160 mm is included
amongst rafters and 100 mm underneath them. The planned U esteem for this situation is 0.15
(W/m2K).
Minimizing penetration
It is recommended that the first entryways on the property, with a U-estimation of 2.8
W/m2.K, ought to be supplanted with a superior triple coated entryway, diminishing the U-
estimation of the surface by 65%.
The above graph shows that the breakdown of LED count for each structure of building
such as house, semi detach one and attached house (Dutton, 2016).
Ventilation is required in conventional structures to enable the texture 'to relax'.
Smokestacks would have contributed enormously to the ventilation rate, so it is exhorted,
sometimes, that stacks could to be left open to permit regular ventilation. Be that as it may,
neglected stack, if left completely open, will regularly cause more warmth misfortune. It
additionally can give water access, on the off chance that it is uncapped. A few techniques can be
suggested:
Tops: a top at the highest point of a stack will avoid water entrance yet permit through
ventilation. Be that as it may, tops can cause tremendous harm and be extremely hazardous in the
event that they brush off if there should arise an occurrence of breezy climate.
Inflatables: is the fastest and least expensive approach to close of a pipe that isn't being
utilized, however it is unbalanced and messy while expelling and reinstalling them set up
(Feinleib, 2014).
11
⊘ This is a preview!⊘
Do you want full access?
Subscribe today to unlock all pages.
Trusted by 1+ million students worldwide
1 out of 16


Your All-in-One AI-Powered Toolkit for Academic Success.
+13062052269
info@desklib.com
Available 24*7 on WhatsApp / Email
![[object Object]](/_next/static/media/star-bottom.7253800d.svg)
Unlock your academic potential
Copyright © 2020–2026 A2Z Services. All Rights Reserved. Developed and managed by ZUCOL.