Sustainable Systems: LCA & Energy Efficiency Analysis Report

Verified

Added on  2023/03/31

|20
|2579
|378
Report
AI Summary
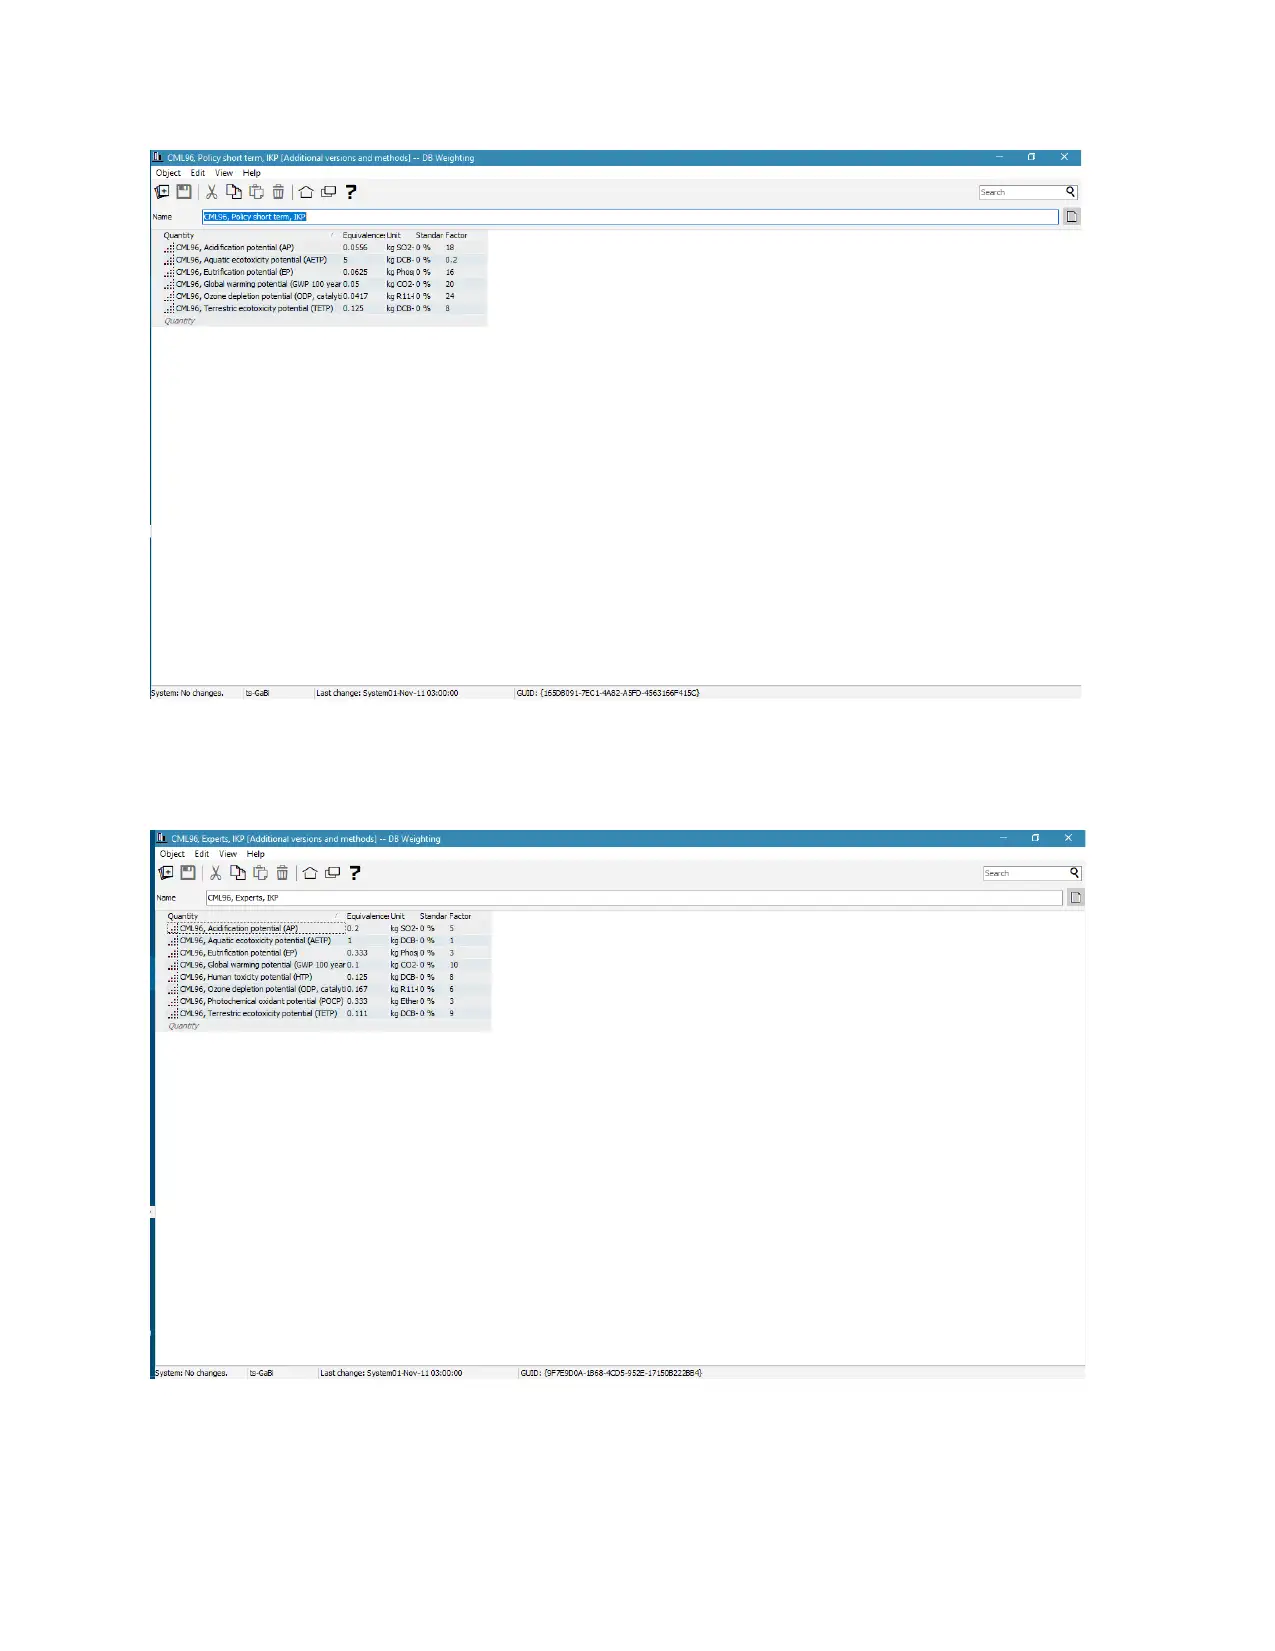
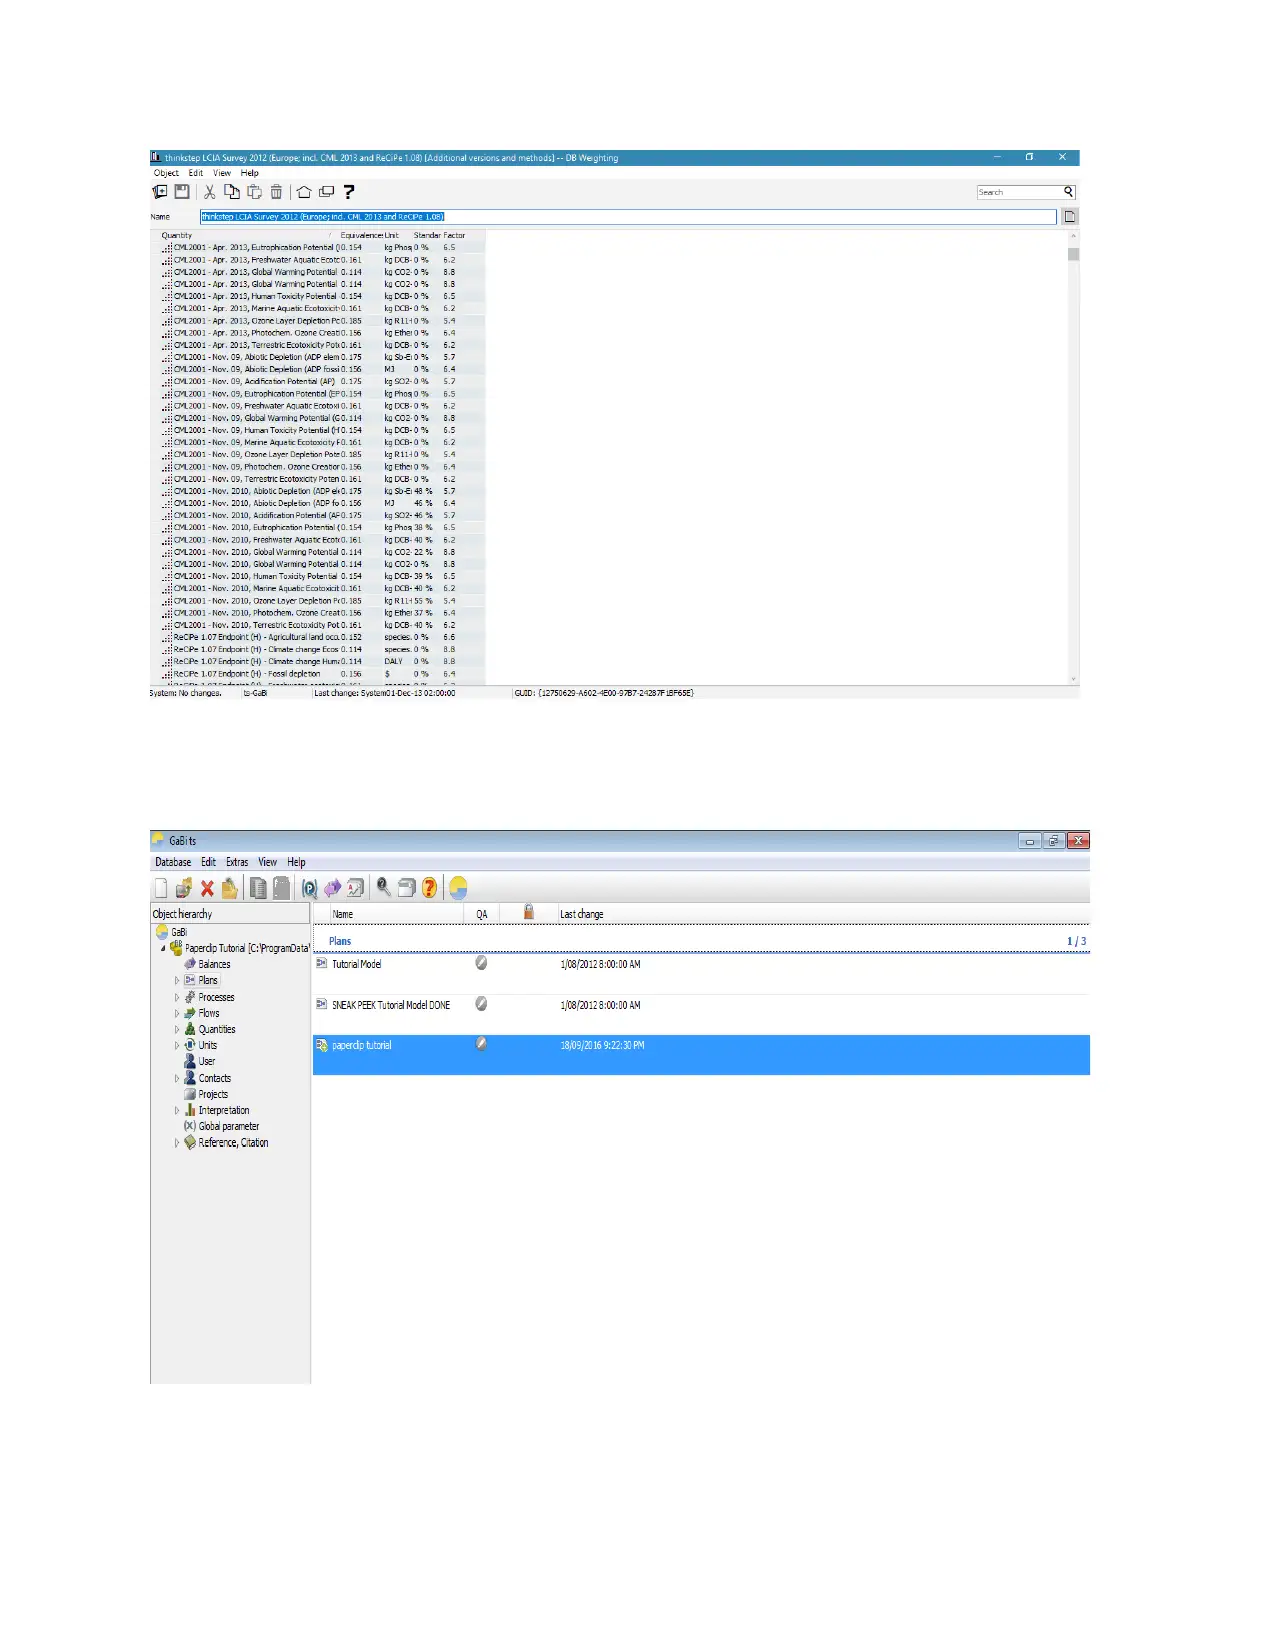
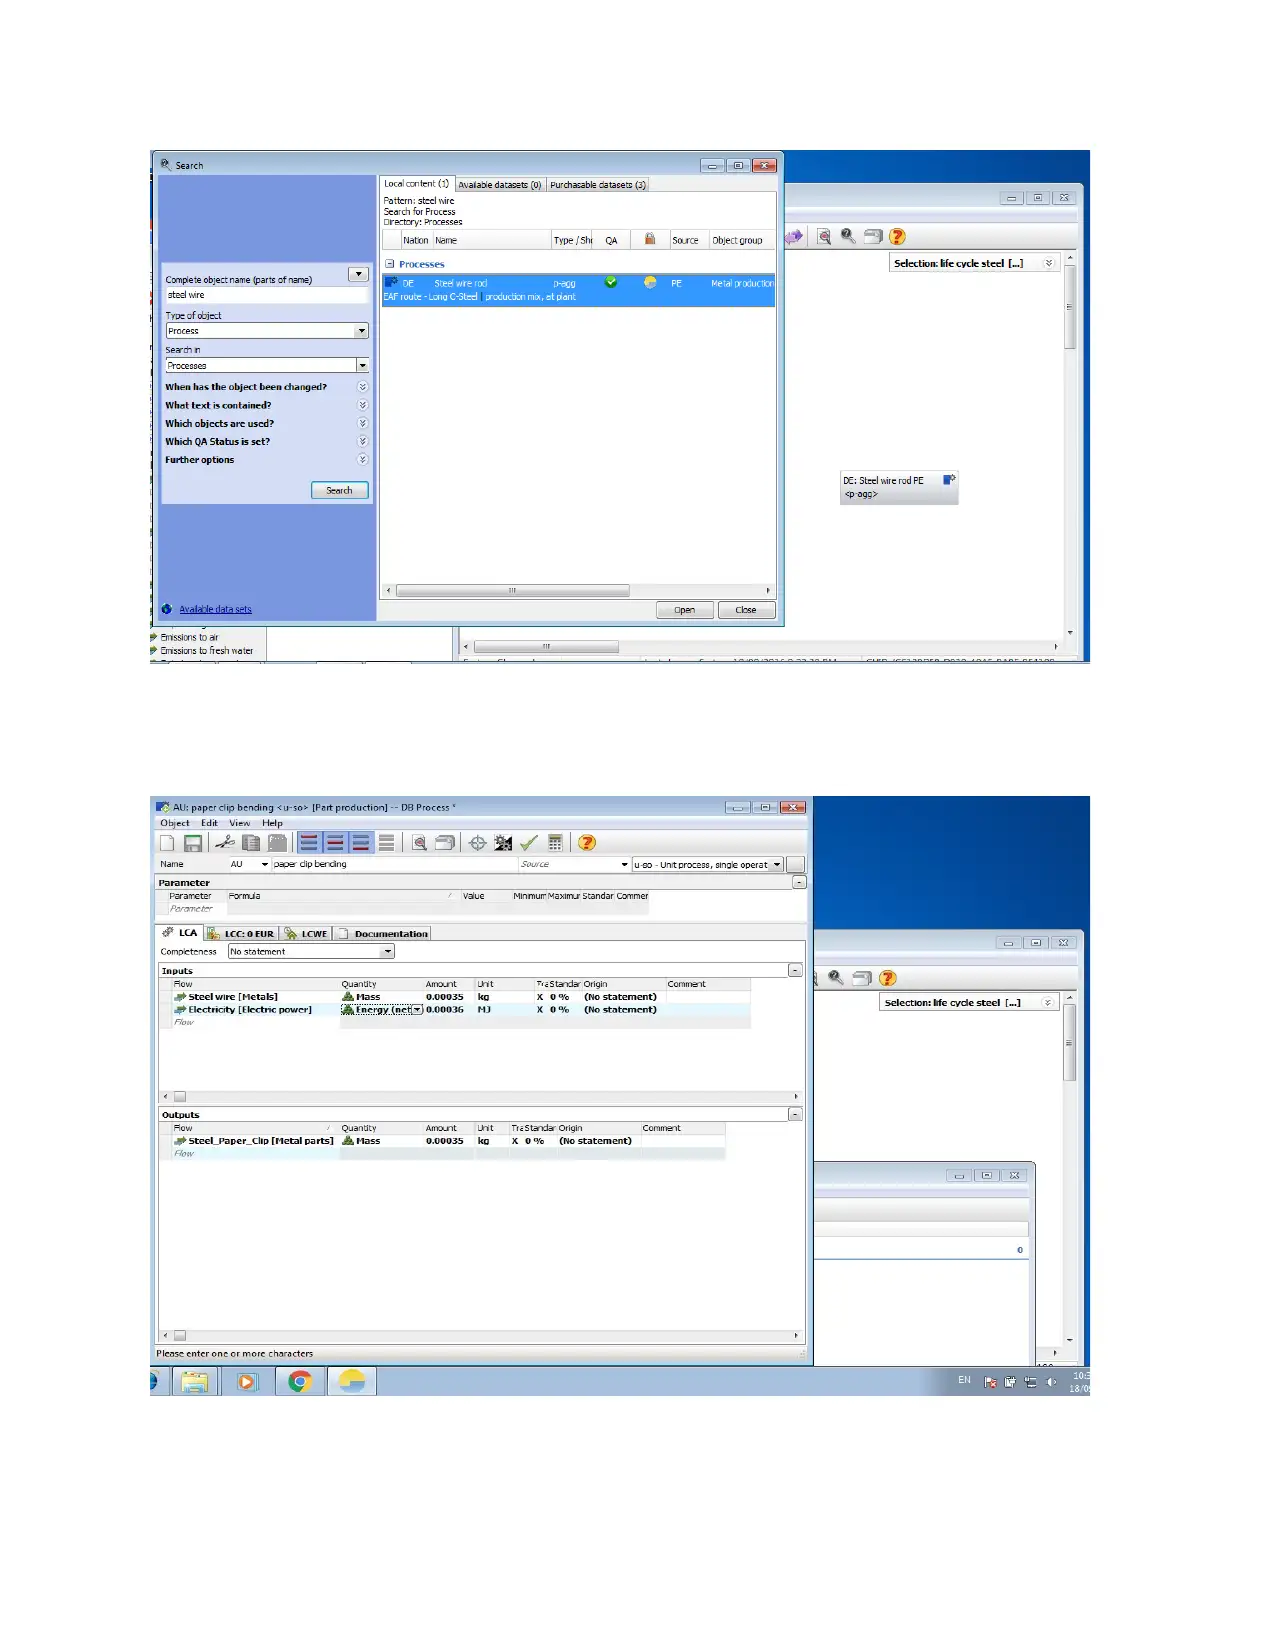
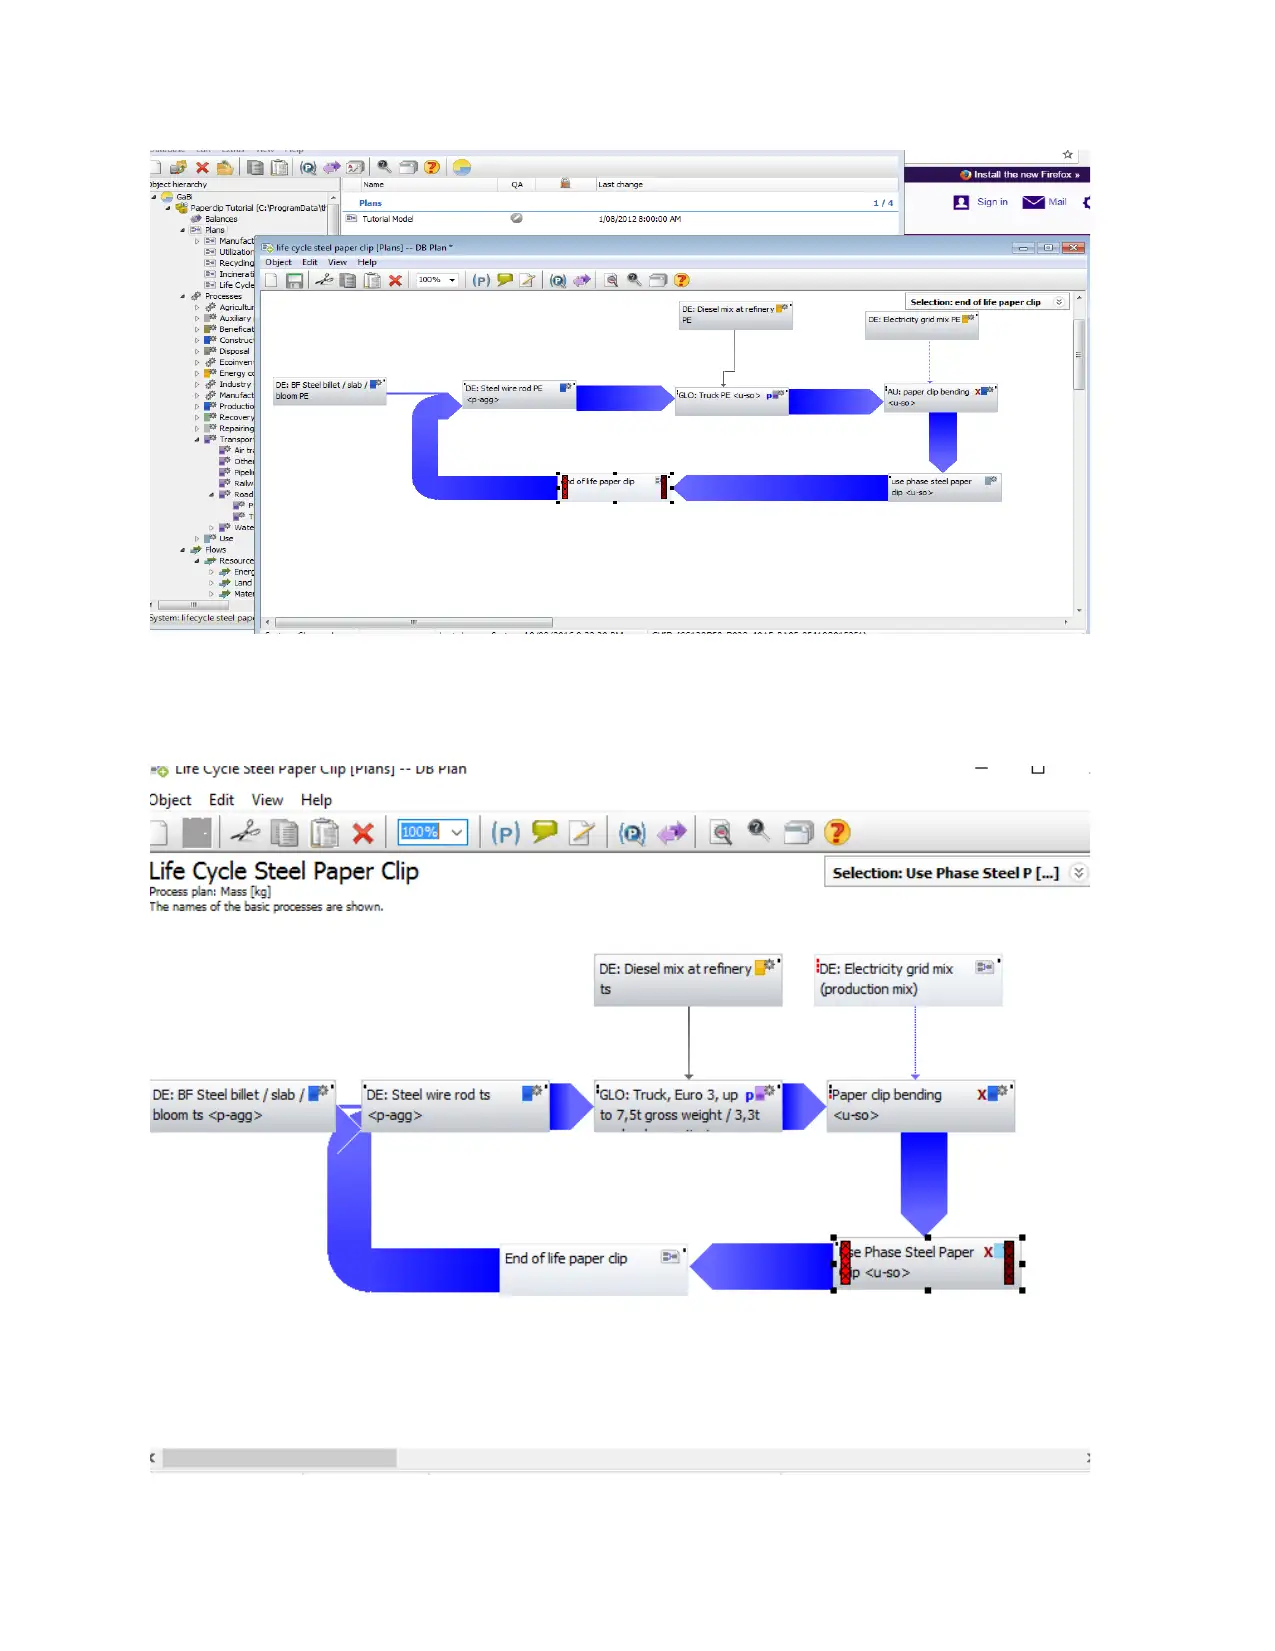
This report provides a comprehensive analysis of sustainable systems, focusing on life cycle assessment (LCA) and energy efficiency. The first part of the report conducts an LCA comparing plastic and steel plates, utilizing GaBi software to assess environmental impacts. The analysis identifies hotspots for each alternative, concluding that plastic plates are more sustainable due to their renewable sources and lower environmental impact. Remedial measures for steel plate production are also discussed. The second part of the report investigates the energy efficiency of a blender through a cost-benefit analysis, determining that the blender is both energy and cost-efficient over a three-year period. The report considers various energy sources and highlights the importance of evaluating device efficiency for sustainability.
tabler-icon-diamond-filled.svg

Contribute Materials

Your contribution can guide someone’s learning journey. Share your documents today.
Document Page
A REPORT ON SUSTAINABLE SYSTEMS
Name of student:
Name of Institution:
Date:
tabler-icon-diamond-filled.svg

Secure Best Marks with AI Grader

Need help grading? Try our AI Grader for instant feedback on your assignments.
Document Page
Executive summary
There is a need for the products, systems and services to be sustainable. A sustainable product,
system or services is a product, system or service that promotes the green environment and does
not cause any damage to the biodiversity. A sustainable system, product or service does not
release any harmful gases and substances into the atmosphere that may deplete the ozone layer
(Watts, et al., 2012).
A sustainable system, service or product can be known through the assessment of its life cycle.
The assessment of the life cycle of a product or process or service is commonly known as a life
cycle assessment (LCA). A life cycle assessment involves a raw materials-to-end product and
by-products analysis of production of systems. A life cycle assessment provides a comprehensive
evaluation of all the inputs and outputs as well as the various environmental emissions (Ansari,
et al., 2011).
The purpose of this report is to provide a life cycle assessment of two alternative products. The
two alternative products are the plastic plate and a plate made of steel. The life cycle analysis
revealed that the steel metallic plate has several hot spots. The first notable hotspot is that it is
relatively more expensive to manufacture compared to the plastic plate. A teal plate is non-
biodegradable. Therefore, excessive manufacture of steel plates may cause serious pollution in
the environment. The manufacturing process of a steel plate releases numerous harmful gases
into the environment. The most dangerous gas that is released during the manufacturing process
of a steal plate is the carbon dioxide. Excessive release of carbon into the atmosphere is toxic to
the health of human beings. Excessive release of carbon dioxide may also cause depletion of the
ozone layer (Sablin, 2012).
Document Page
The life cycle analysis has proven that the best alternative is the plastic plate. A plastic plate is derived
from renewable sources like cellulose and starch. The plastic is renewable and the renewed materials
can be used to in the medical sector to manufacture 3 d prints. In comparison to the steel plate, a plastic
plate is relatively cheap to produce and it is non-toxic. Moreover, a plastic plate can withstand very high
temperatures of up to 110 degrees Celsius (Kate, 2011).
Introduction
A life cycle assessment is technique that evaluates the effects of a product or system throughout
its life cycle. A life cycle of a product or system is the period between the raw materials and the
end the end products. A life cycle assessment of two alternative products have been conducted in
this study. The two alternative products are the plastic plate and the plate made of steel (Paul, et
al., 2014).
The service wanted is a serving plate. The serving plate should be used anywhere; at home, in
offices and at the restaurants. The two alternatives are the plastic plate and the plate made of
steel. The problem has been chosen because it is a universal problem. Plates are used anywhere
on a daily basis. Furthermore, there is a huge manufacturing of plates and hence the whole
process should be sustainable (Kazeev, et al., 2013).
GaBi software will be used for the life cycle assessment. The procedure of conducting a life
cycle assessment in GaBi is recommended by the ISO. The purpose of conducting a life cycle
assessment in GaBi is to enhance product or project development and improvement, to enable
strategic planning, to enhance public policy making and to aid in marketing and eco-balance (P,
et al., 2009).
The recommended procedure for conducting a life cycle assessment has four major stages/steps.
The four steps are: Setting the goals and defining the scope of analysis, inventory analysis,
Document Page
Impact analysis, and the interpretation of the outcome (Marcos & Gabrielle, 2010). The four
stages can be represented in the diagram below:
The ISO recommends that a life cycle analysis process comprises of four main phases as shown
in the chart below (Bcorporation.net, 2009).
Es
Estimated weight of each component of each alternative
A plastic plate Steel plate
vegetable glycerin (available at the
pharmacy)
corn, potato or other starch
vinegar (5% acidity)
water
Cooking spoon
Cooking pot
Hot plate
Aluminum foil
Carbon-Manganese steel
Iron
Limestone
Water
Burning Furnace
Source of Heat
Sulfur
Phosphorus
Silicon
LCA Process
Goal
setting
and
Scoping
Consider
environmental,
economic and
social issues
Life
Cycle
Inventory
Consider inputs
and outputs
Life Cycle
Impact
Assessment
Assess the toxicity,
Ecotoxicity,
acidification levels, and
global climate change
Interpretation
Involves analysis of
impact data. A
conclusion is made
based on the findings
tabler-icon-diamond-filled.svg

Secure Best Marks with AI Grader

Need help grading? Try our AI Grader for instant feedback on your assignments.
Document Page
A well-defined functional unit
For a plastic plate:
1 tsp vegetable glycerin (available at the pharmacy)
1tbsp corn, potato or other starch
1 tsp vinegar (5% acidity)
4 tbsp water
Cooking spoon
Cooking pot
Hot plate
Aluminum foil

For a steel plate:
490N/mm^2 Carbon-Manganese steel
490N/mm^2 Iron
90% Limestone
Water
Burning Furnace
Source of Heat
Sulfur (0.04%)
Phosphorus (below 0.04%)
Silicon
A balanced material flow diagram for each alternative
The diagram below is shows the material flow for the two alternatives
Document Page
An impact analysis for each alternative
An impact analysis was conducted in the GaBi software. The screen shots below are the
procedure that was used to conduct the impact analysis for the two alternatives.
Document Page
tabler-icon-diamond-filled.svg

Paraphrase This Document

Need a fresh take? Get an instant paraphrase of this document with our AI Paraphraser
Document Page
Document Page
Document Page
tabler-icon-diamond-filled.svg

Secure Best Marks with AI Grader

Need help grading? Try our AI Grader for instant feedback on your assignments.
Document Page
Document Page
Document Page
Hot spot identification for each alternative
A steel metallic plate has several hot spots. The first notable hotspot is that it is relatively more
expensive to manufacture compared to the plastic plate. A teal plate is non-biodegradable.
Therefore, excessive manufacture of steel plates may cause serious pollution in the environment.
The manufacturing process of a steel plate releases numerous harmful gases into the environment
(Lee, et al., 2012).
The most dangerous gas that is released during the manufacturing process of a steal plate is the
carbon dioxide. Excessive release of carbon into the atmosphere is toxic to the health of human
beings. Excessive release of carbon dioxide may also cause depletion of the ozone layer. On the
other hand, a plastic plate has few hot spots. The most notable hot spot is the toxic gas that is
release during the manufacturing process. However, the toxic gas is released in small quantities
(Lebedev & Fyodorov, 2008).
Remedial measures
The best remedial measure would be to reduce the level of carbon dioxide that is used in the
manufacturing process. Since steel is non-biodegradable, there should be a clear and proper way
of recycling the used metallic plates in order to reduce pollution in the environment. Similarly,
companies should be encouraged to produce plastic plates since they are sustainable (Kazeev, et
al., 2013).
tabler-icon-diamond-filled.svg

Paraphrase This Document

Need a fresh take? Get an instant paraphrase of this document with our AI Paraphraser
Document Page
Select the best alternative
Based on the impact analysis, the best alternative is the plastic plate or the bioplastic plate. The
plastic plate is the best alternative due to a number of notable reasons. A plastic plate is derived
from renewable sources like cellulose and starch. The plastic is renewable and the renewed
materials can be used to in the medical sector to manufacture 3 d prints. In comparison to the
steel plate, a plastic plate is relatively cheap to produce and it is non-toxic. Moreover, a plastic
plate can withstand very high temperatures of up to 110 degrees Celsius (Lebedev & Fyodorov,
2008).
References
Ansari, A. A. et al., 2011. Eutrophication: causes, consequences and control Volume 104 ||
Eutrophication: Threat to Aquatic Ecosystems. Volume 8, p. 28.
Kate, D., 2011. Deforestation and Climate Change: Reducing Carbon Emissions from
Deforestation and Forest Degradation – Edited by Valentina Bosetti and Ruben Lubowski.
Volume 35, p. 2.
Kazeev, K. S., Ter, M. T., Alexandrovich & Yermolaeva, O. Y., 2013. Ecosystem degradation of
the limestone massifs of western cascasus after deforestation. Volume 12, p. 5.
Lebedev, Y. V. & Fyodorov, A. I., 2008. Complex Evaluation of Forests for the Inventory of
Natural Resources. Volume 2, p. 6.
Lee, I. E., Sim, M. L., Kung, F. W. L. & Ghassemblooy, Z., 2012. 2nd International Symposium
On Environment Friendly Energies And Applications - Optimal hybrid vehicle, embedded data
acquisition and tracking. Volume 10, p. 6.
Marcos, H. & Gabrielle, F. P., 2010. Effects of Amazon and Central Brazil deforestation
scenarios on the duration of the dry season in the arc of deforestation. Volume 3, p. 10.
Document Page
Paul, A., Chowdary, V. M. & Chakraborty, D., 2014. Customization of Freewares GIS software
for management of natural resources data for developmental planning. International Journal of
Open Information Technologies, Volume 2, p. 5.
P, C. M., R, P. & J-L, C., 2009. A methodology to estimate impacts of domestic policies on
deforestation: Compensated Successful Efforts for “avoided deforestation” (REDD). Volume 68,
p. 12.
Sablin, K., 2012. Russian big Business: Natural Resourrce Development and Social
responsibility Vs. Innovative Activity?. Volume 3, p. 11.
Watts, et al., 2012. A simulation environment for the investigation into loss of mains detection
methods for grid connected single phase inverters. Volume 11, p. 6.
A REPORT OF ENERGY EFFICIENCY ANALYSIS
Executive summary
Energy efficiency is energy conservation strategy that is aimed at maximizing the use of energy
and minimizing the waste. Energy efficiency can be managed through a number of actions.
however, the major part of energy efficiency is dependent on the device. The nature and type of a
device determines their level of energy efficiency (Ansari, et al., 2011).
There are several factors to consider in order to conclude that the device is energy efficient. The
major factors to consider when determining the energy efficiency of a product or device include:
The cost of purchase of the product, the available alternatives of the device, the rate of energy
Document Page
consumption of the device, the usage of the device as well as the efficiency of the device (Watts,
et al., 2012).
The other way of evaluating energy efficiency of a product or device is by conducting a cost
benefit analysis. A cost benefit analysis is one of the business techniques of comparing the costs
and benefits of a device in order to understand the overall benefit or the net benefit. Therefore, a
cost benefit analysis is conducted to determine whether the use of a given device is economically
sustainable (Sablin, 2012).
The device that I have investigated in this report is a blender. A blender is a device that is
commonly used at home, in offices and in the restaurants for preparing drinks. The device is
widely used on a daily basis. Therefore, it is necessary to provide an informed expert opinion
concerning the use of a blender. The results of the cost benefit analysis clearly demonstrated that
the overall benefits are more than the overall cost of the blender for a period of three years.
Therefore, it is accurate to conclude that a blender is energy efficient as well as cost efficient
(Kate, 2011).
Definition of the problem (Introduction)
The device that I have investigated in this report is a blender. A blender is a device that is
commonly used at home, in offices and in the restaurants for preparing drinks. The device is
widely used on a daily basis. Therefore, it is necessary to provide an informed expert opinion
concerning the use of a blender (Paul, et al., 2014).
The relevant information regarding blender is important in evaluating its energy efficiency.
The energy Consumption rate of a blender is 900 Watts per hour on average. The efficiency of a
tabler-icon-diamond-filled.svg

Secure Best Marks with AI Grader

Need help grading? Try our AI Grader for instant feedback on your assignments.
Document Page
blender is as much as 300 Watts per hour. The usage of a blender is for mixing fruits in order to
make fruit juices. The average cost of purchasing a blender is US $ 350.
Sources of energy
The main source of power for a blender is the electricity. The electricity can be sourced from a
number of energy sources. The most common energy sources include: Solar energy, wind
energy, geothermal energy, biomass energy, Hydroelectric power energy, Nuclear energy, coal
energy and petroleum energy
Selecting a state
My number ends with 5 hence, I have to choose a town in Victoria.
Organizations in Australia that promote energy efficiency
Australia Energy Regulatory and Australian Renewable Energy Agency
Reducing energy consumption of a blender.
1. Buying a low power consuming blender
2. Always servicing the blender to avoid default or malfunctioning
3. Always switch off the power or unplug the blender from power when it is not in use
Cost benefit analysis of blender
A cost benefit analysis is one of the business techniques of comparing the costs and benefits of a
device in order to understand the overall benefit or the net benefit. Therefore, a cost benefit
analysis is conducted to determine whether the use of a given device is economically sustainable
(Kazeev, et al., 2013). The cost benefit analysis of a blender is as follows:
Document Page
Expenses
Purchase price $350
power consumption $1,200
cost of maintenance $200
Total $1,750
Benefits
Energy efficiency $3,000
reduction of expenses $305
Total $3,305
A three years projection/Payback Calculations
Cost $2,661.53
Benefits $5,026.49
Net Benefit $2,364.96
Calculations:
The interest rate is 1.5%
The period is 3 years
A three years projections for the total costs is given by:
3 years Total costs= Cost in year 1(1.015^3)
A three years projection of the benefits is given by:
3 years Total benefits=Benefits in year 1(1.015^3)
The 3 years net benefits= 3 yrs Total benefits – 3 yrs Total costs
Conclusion
A blender is a device that is used on a daily basis at homes and many other places. Therefore, it
is important to establish whether a blender is energy efficient or not. One of the best ways to
establish the efficiency of a blender is by conducting a cost benefit analysis (P, et al., 2009).
A cost benefit analysis is a business technique that is used to compare the costs and benefits of a
device in order to understand the overall benefit or the net benefit. Therefore, a cost benefit
Document Page
analysis is conducted to determine whether the use of a given device is economically sustainable
(Paul, et al., 2014).
The results of the cost benefit analysis clearly demonstrate that the overall benefits are more than
the overall cost of the blender for a period of three years. Therefore, it is accurate to conclude
that a blender is energy efficient as well as cost efficient (P, et al., 2009).
References
Ansari, A. A. et al., 2011. Eutrophication: causes, consequences and control Volume 104 ||
Eutrophication: Threat to Aquatic Ecosystems. Volume 8, p. 28.
Kate, D., 2011. Deforestation and Climate Change: Reducing Carbon Emissions from
Deforestation and Forest Degradation – Edited by Valentina Bosetti and Ruben Lubowski.
Volume 35, p. 2.
Kazeev, K. S., Ter, M. T., Alexandrovich & Yermolaeva, O. Y., 2013. Ecosystem degradation of
the limestone massifs of western cascasus after deforestation. Volume 12, p. 5.
Paul, A., Chowdary, V. M. & Chakraborty, D., 2014. Customization of Freewares GIS software
for management of natural resources data for developmental planning. International Journal of
Open Information Technologies, Volume 2, p. 5.
P, C. M., R, P. & J-L, C., 2009. A methodology to estimate impacts of domestic policies on
deforestation: Compensated Successful Efforts for “avoided deforestation” (REDD). Volume 68,
p. 12.
Sablin, K., 2012. Russian big Business: Natural Resourrce Development and Social
responsibility Vs. Innovative Activity?. Volume 3, p. 11.
Watts, et al., 2012. A simulation environment for the investigation into loss of mains detection
methods for grid connected single phase inverters. Volume 11, p. 6.
tabler-icon-diamond-filled.svg

Paraphrase This Document

Need a fresh take? Get an instant paraphrase of this document with our AI Paraphraser
Document Page
chevron_up_icon
1 out of 20
circle_padding
hide_on_mobile
zoom_out_icon
logo.png

Your All-in-One AI-Powered Toolkit for Academic Success.

Available 24*7 on WhatsApp / Email

[object Object]