DT9417/DT9418: Wind Farm Project Economic Performance Analysis
VerifiedAdded on 2023/05/29
|54
|14585
|262
Project
AI Summary
This project assesses the economic feasibility of a proposed wind farm in Intack, County Wicklow, Ireland. The student developed a mathematical model to calculate wind power output and another to determine the Net Present Value (NPV) of the project. The analysis includes an executive summary, an introduction to wind energy in Ireland, and detailed models for wind power output and economic variables like investment costs, operations and maintenance costs, and revenue generation. Economic measures such as NPV, payback period, and cost-benefit ratio are calculated. The project also performs a sensitivity analysis under various scenarios and quantifies the greenhouse gas emissions avoided. Furthermore, site constraints, including spacing, topography, accessibility, surrounding features, ground conditions, environmental factors, and regulatory requirements, are considered. The project concludes that the wind farm is economically viable and provides detailed calculations and summaries in the appendices.

SCHOOL OF CIVIL AND STRUCTURAL ENGINEERING
Programme Title: ME Sustainable Infrastructure
Programme Code: DT9417 & DT9418
Module: Energy Infrastructure
Assignment Number: Assignment 1
Project Designer: Ngozi Nwajei – D18124369
Word Count: 6,846
Lecturer: Aidan Duffy
Department of Civil and Structural Engineering Dublin
Institute of Technology
Paraphrase This Document
Need a fresh take? Get an instant paraphrase of this document with our AI Paraphraser
SCHOOL OF CIVIL AND STRUCTURAL ENGINEERING
Page 1
EXECUTIVE SUMMARY
The main aim of this paper was to develop a mathematical model of a wind farm project in
Intack County of Wicklow, Ireland. A mathematical model for calculating wind power output
and another for NPV of the project have been formulated and used in Excel to perform
economic calculations of the project. The project will generate 9.7 MW of electricity and its
NPV, payback period and CBR are €69,679,384, 1.9 years and 2.7 respectively. Since NPV is
positive and CBR is greater than one, this project is economically viable and should be
implemented. The model have also been used to evaluate the economic performance of the
project under five different scenarios. Scenario 4 where wind speed and price of electricity
were increased while the O&M costs were reduced resulted to the highest NPV and CBR
values and the lowest repayment period. The wind farm in this project will also help avoid
1,259,001.8 tonnes of CO2e over the 20-year period.
SCHOOL OF CIVIL AND STRUCTURAL ENGINEERING
Page 2
Table of Contents
EXECUTIVE SUMMARY ....................................................................................................... 1
1. INTRODUTION ................................................................................................................ 4
2. MODELS ........................................................................................................................... 6
2.1. Flow model diagram.................................................................................................... 7
2.2. Wind Power Output model .......................................................................................... 7
2.3. Economic model ........................................................................................................ 12
2.3.1. Investment cost .................................................................................................. 13
2.3.2. Operations and maintenance (O&M) costs ....................................................... 14
2.3.3. Revenue generated ............................................................................................. 15
3. ECONOMIC MEASURES .............................................................................................. 17
3.1. Net Present value (NPV) ........................................................................................... 17
3.2. Payback period .......................................................................................................... 18
3.3. Cost benefit ratio (CBR) ........................................................................................... 19
4. SENSITIVITY ANALYSIS ............................................................................................ 20
4.1. Scenario 1 .................................................................................................................. 20
4.2. Scenario 2 .................................................................................................................. 21
4.3. Scenario 3 .................................................................................................................. 22
4.4. Scenario 4 .................................................................................................................. 24
4.5. Scenario 5 .................................................................................................................. 25
5. GREENHOUSE GAS EMISSIONS ................................................................................ 26
6. SITE CONSTRAINTS..................................................................................................... 29
6.1. Spacing ...................................................................................................................... 29
6.2. Topography ............................................................................................................... 30
6.3. Accessibility .............................................................................................................. 30
6.4. Surrounding features ................................................................................................. 30
6.5. Ground conditions ..................................................................................................... 31
6.6. Environmental factors ............................................................................................... 31
6.7. Regulatory requirements ........................................................................................... 31
7. CONCLUSION ................................................................................................................ 32
References ................................................................................................................................ 34
⊘ This is a preview!⊘
Do you want full access?
Subscribe today to unlock all pages.
Trusted by 1+ million students worldwide
SCHOOL OF CIVIL AND STRUCTURAL ENGINEERING
Page 3
APPENDIX .............................................................................................................................. 38
Appendix 1: Summary of calculations for original project ..................................................... 38
Appendix 2: Summary of calculations for scenario 1 .............................................................. 40
Appendix 3: Summary of calculations for scenario 2 .............................................................. 42
Appendix 4: Summary of calculations for scenario 3 .............................................................. 44
Appendix 5: Summary of calculations for scenario 4 .............................................................. 46
Appendix 6: Summary of calculations for scenario 5 .............................................................. 48
Paraphrase This Document
Need a fresh take? Get an instant paraphrase of this document with our AI Paraphraser
SCHOOL OF CIVIL AND STRUCTURAL ENGINEERING
Page 4
1. INTRODUTION
Wind is one of the cleanest, cheapest and biggest renewable energy sources in Ireland
making it a very essential resource in meeting the increasing demand for green energy in the
country. The resource does not only increase power supply throughout the country but also
lowers carbon emissions thus protecting the environment and improving people’s quality of
life (Sunderland, et al., 2013). It is estimated that by 2050, wind energy will decrease carbon
dioxide emissions by between 400 and 450 million tonnes (Sustainable Energy Authority of
Ireland, (n.d.)). The current wind power output of Ireland is approximately 2,826 MW. Just
like other countries where wind energy investments have been increasing every year and
projected to continue increasing (Krohn, et al., 2009), Ireland is also investing significantly in
wind farms.
Successful implementation of wind farm projects relies heavily on the precision of
wind resource mapping. Ireland is one of the countries with affluent wind resource hence
most of the wind farm projects are feasible. However, this does not mean that any wind farm
project can be successful in the country. It requires proper planning, consultation, accurate
collection of relevant data, benchmarking with past similar projects and application of
available technologies and other strategies to lower costs.
There are numerous existing wind farm projects in Ireland, both onshore and offshore.
Figure 1 below shows existing wind farms in Ireland. This is mainly because the country has
very large wind resource and many parts have average wind speeds. In 2016, wind energy
accounted for 85% of renewable electricity in Ireland and 20.9% of the country’s total power
demand (Sustainable Energy Authority of Ireland , 2017). In 2017, the percentage of total
electricity demand accounted for by wind energy rose to 24% and the highest percentage
increase in installation of wind energy capacity was also recorded in the same year
SCHOOL OF CIVIL AND STRUCTURAL ENGINEERING
Page 5
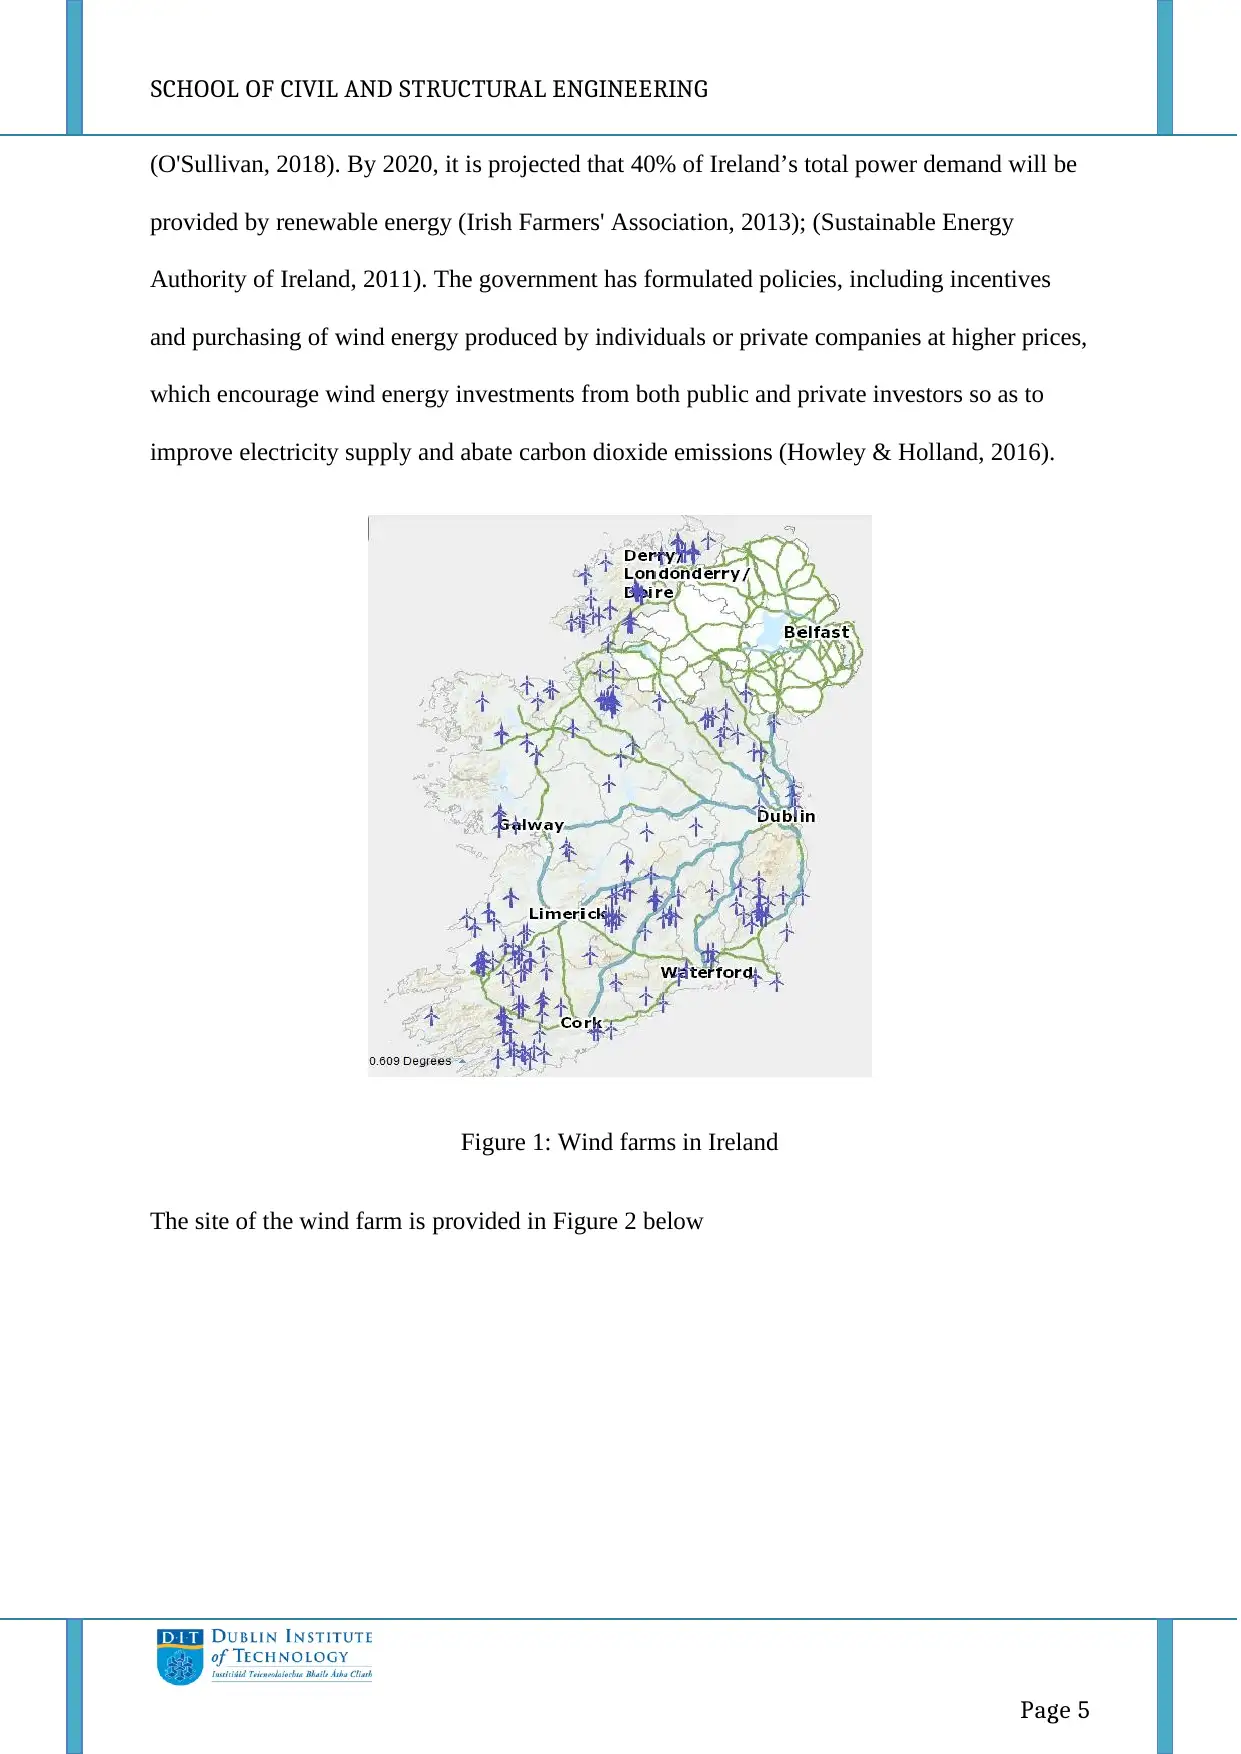
(O'Sullivan, 2018). By 2020, it is projected that 40% of Ireland’s total power demand will be
provided by renewable energy (Irish Farmers' Association, 2013); (Sustainable Energy
Authority of Ireland, 2011). The government has formulated policies, including incentives
and purchasing of wind energy produced by individuals or private companies at higher prices,
which encourage wind energy investments from both public and private investors so as to
improve electricity supply and abate carbon dioxide emissions (Howley & Holland, 2016).
Figure 1: Wind farms in Ireland
The site of the wind farm is provided in Figure 2 below
Page 5
(O'Sullivan, 2018). By 2020, it is projected that 40% of Ireland’s total power demand will be
provided by renewable energy (Irish Farmers' Association, 2013); (Sustainable Energy
Authority of Ireland, 2011). The government has formulated policies, including incentives
and purchasing of wind energy produced by individuals or private companies at higher prices,
which encourage wind energy investments from both public and private investors so as to
improve electricity supply and abate carbon dioxide emissions (Howley & Holland, 2016).
Figure 1: Wind farms in Ireland
The site of the wind farm is provided in Figure 2 below
⊘ This is a preview!⊘
Do you want full access?
Subscribe today to unlock all pages.
Trusted by 1+ million students worldwide
SCHOOL OF CIVIL AND STRUCTURAL ENGINEERING
Page 6
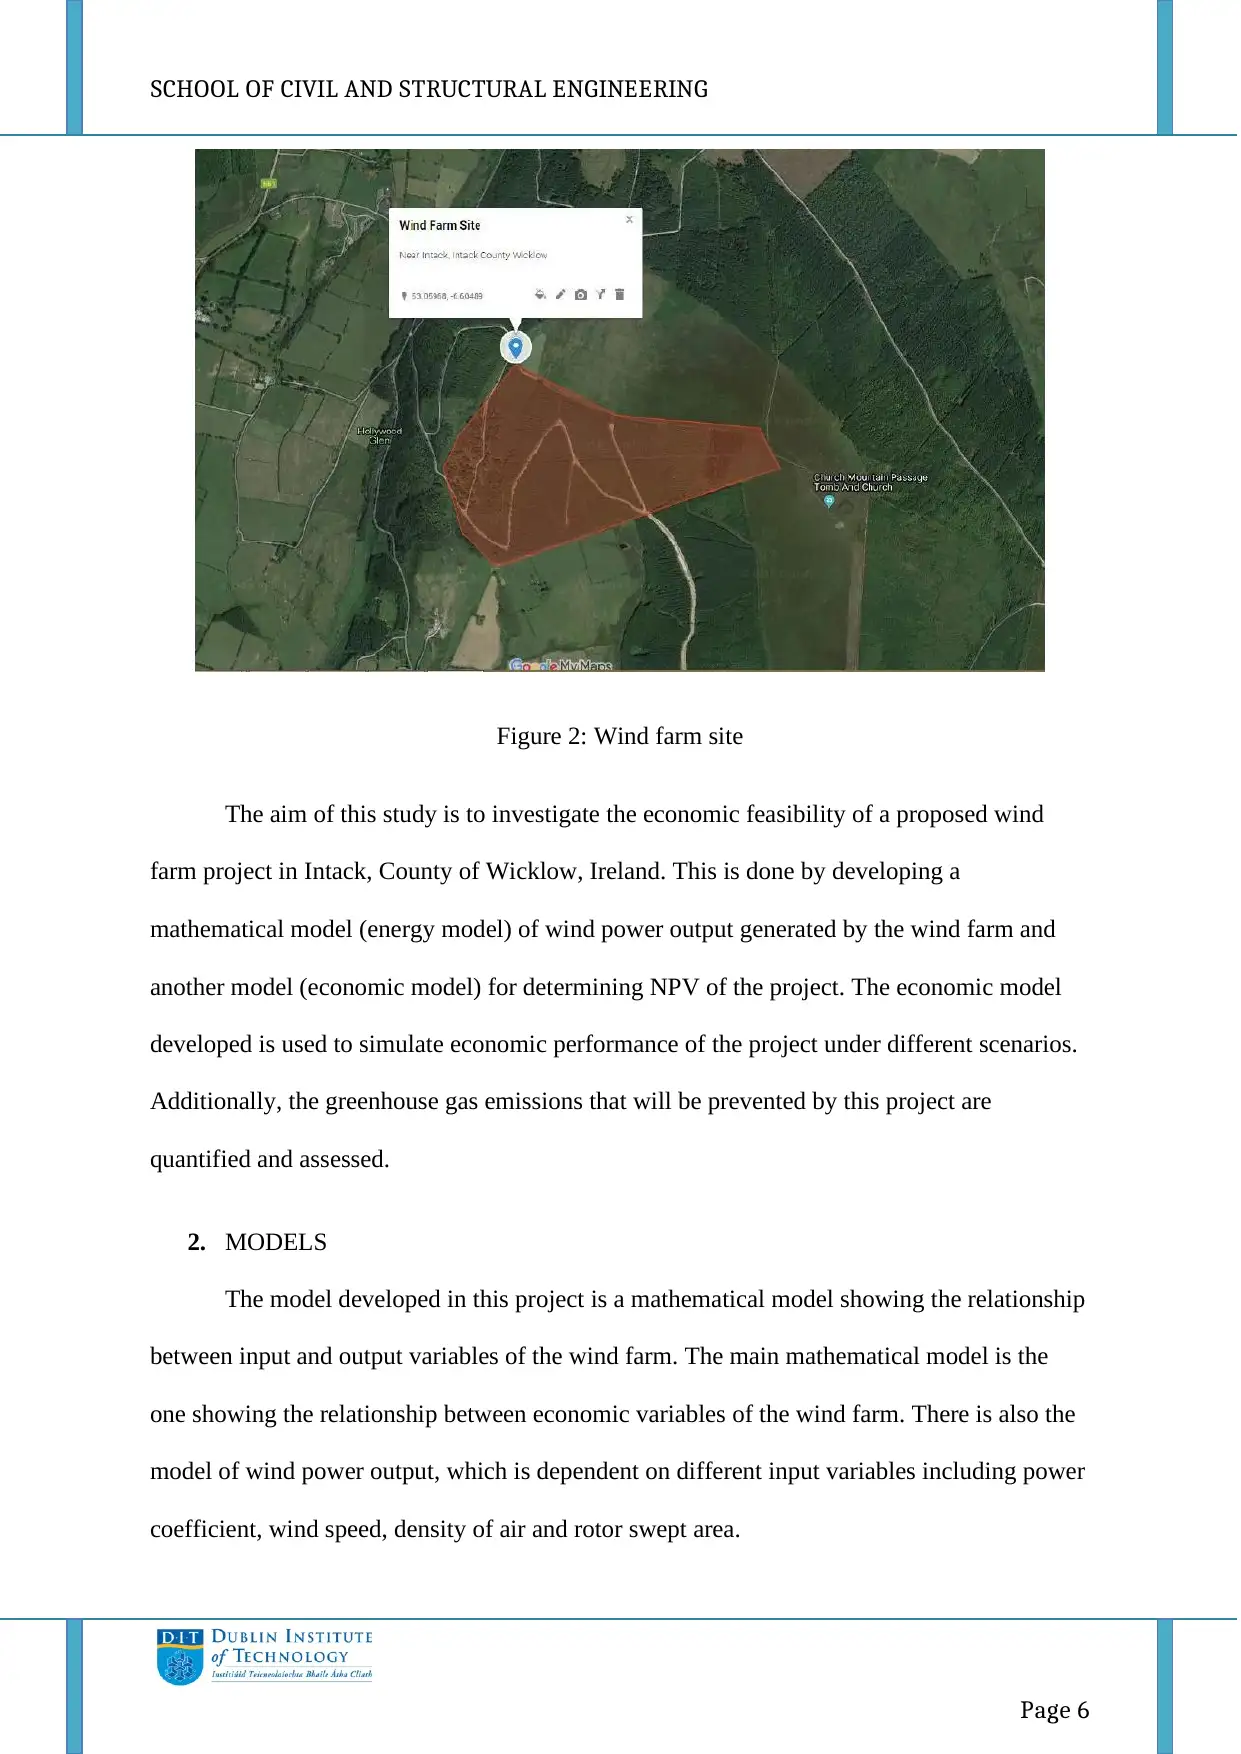
Figure 2: Wind farm site
The aim of this study is to investigate the economic feasibility of a proposed wind
farm project in Intack, County of Wicklow, Ireland. This is done by developing a
mathematical model (energy model) of wind power output generated by the wind farm and
another model (economic model) for determining NPV of the project. The economic model
developed is used to simulate economic performance of the project under different scenarios.
Additionally, the greenhouse gas emissions that will be prevented by this project are
quantified and assessed.
2. MODELS
The model developed in this project is a mathematical model showing the relationship
between input and output variables of the wind farm. The main mathematical model is the
one showing the relationship between economic variables of the wind farm. There is also the
model of wind power output, which is dependent on different input variables including power
coefficient, wind speed, density of air and rotor swept area.
Page 6
Figure 2: Wind farm site
The aim of this study is to investigate the economic feasibility of a proposed wind
farm project in Intack, County of Wicklow, Ireland. This is done by developing a
mathematical model (energy model) of wind power output generated by the wind farm and
another model (economic model) for determining NPV of the project. The economic model
developed is used to simulate economic performance of the project under different scenarios.
Additionally, the greenhouse gas emissions that will be prevented by this project are
quantified and assessed.
2. MODELS
The model developed in this project is a mathematical model showing the relationship
between input and output variables of the wind farm. The main mathematical model is the
one showing the relationship between economic variables of the wind farm. There is also the
model of wind power output, which is dependent on different input variables including power
coefficient, wind speed, density of air and rotor swept area.
Paraphrase This Document
Need a fresh take? Get an instant paraphrase of this document with our AI Paraphraser
SCHOOL OF CIVIL AND STRUCTURAL ENGINEERING
Page 7
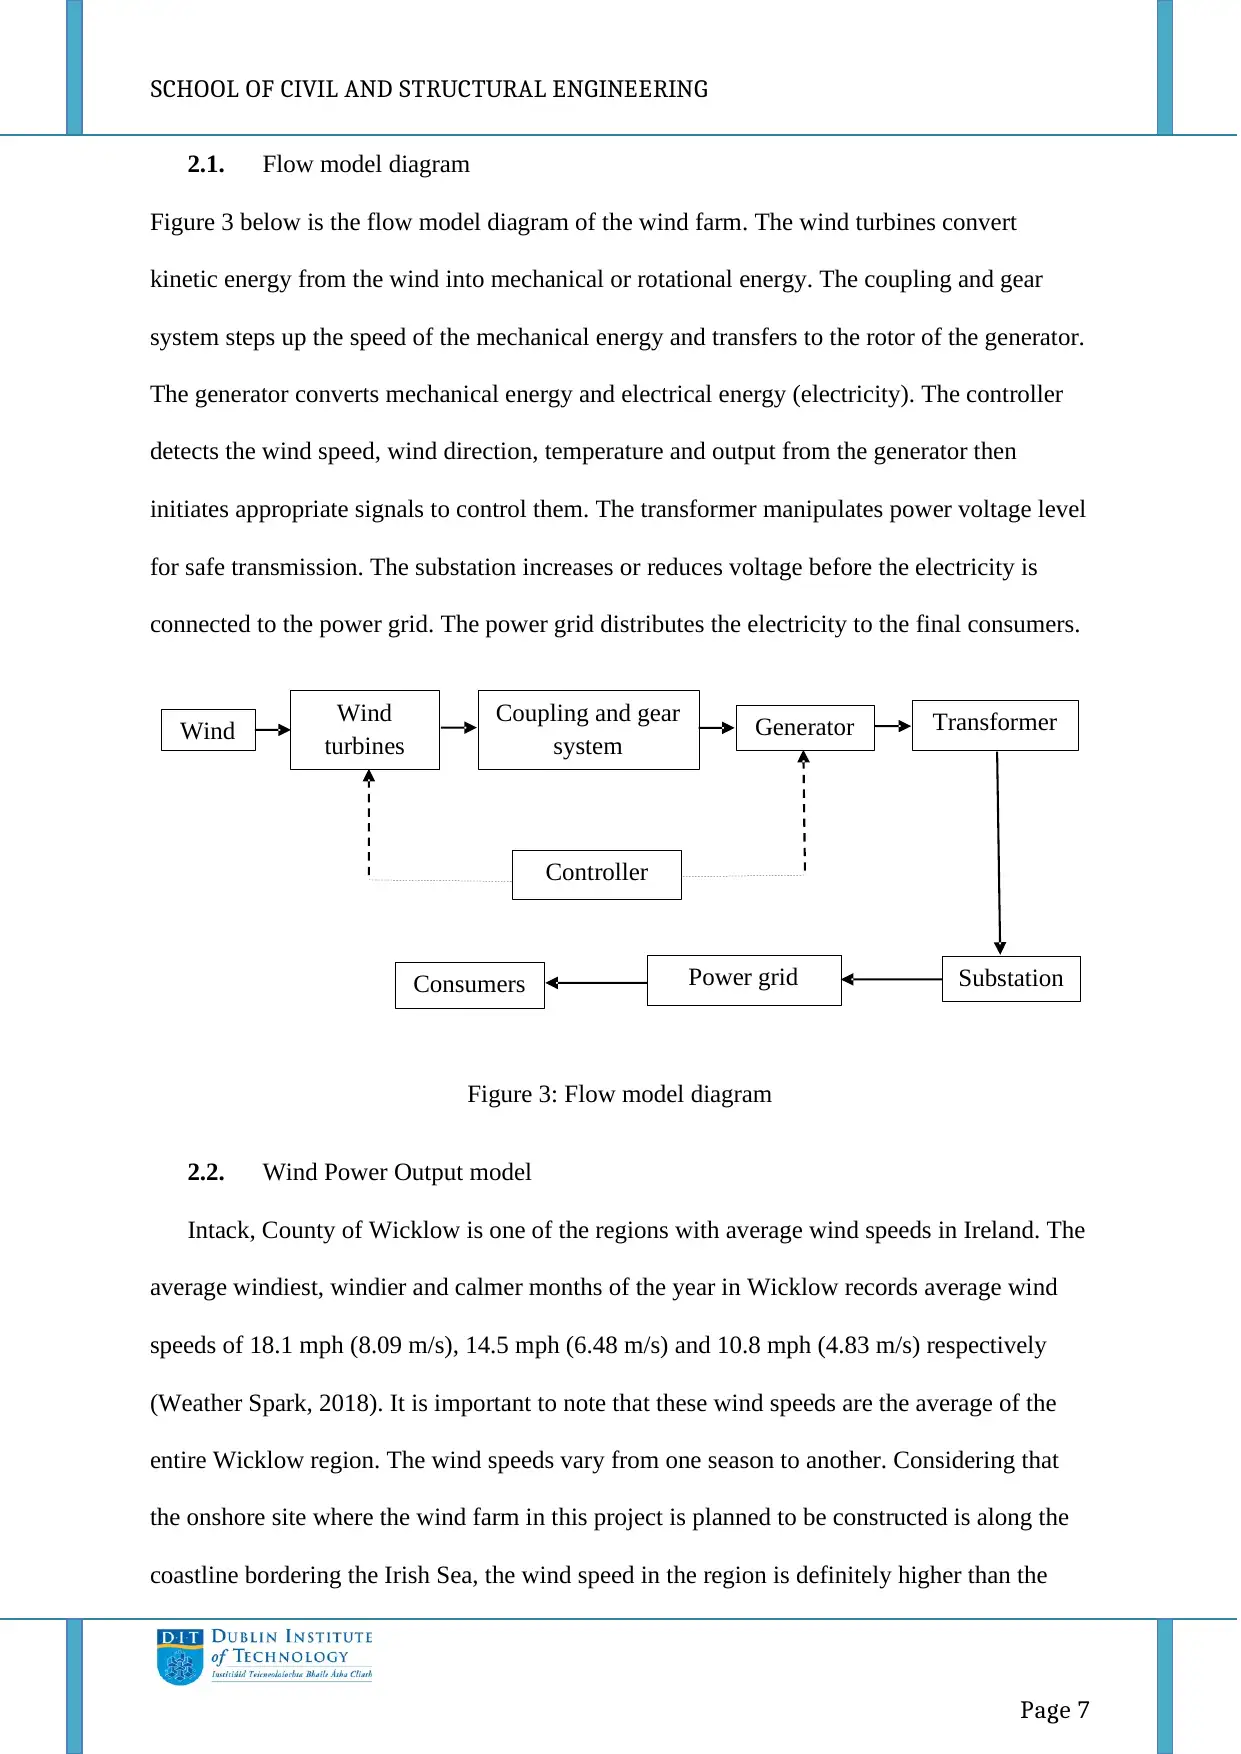
2.1. Flow model diagram
Figure 3 below is the flow model diagram of the wind farm. The wind turbines convert
kinetic energy from the wind into mechanical or rotational energy. The coupling and gear
system steps up the speed of the mechanical energy and transfers to the rotor of the generator.
The generator converts mechanical energy and electrical energy (electricity). The controller
detects the wind speed, wind direction, temperature and output from the generator then
initiates appropriate signals to control them. The transformer manipulates power voltage level
for safe transmission. The substation increases or reduces voltage before the electricity is
connected to the power grid. The power grid distributes the electricity to the final consumers.
Figure 3: Flow model diagram
2.2. Wind Power Output model
Intack, County of Wicklow is one of the regions with average wind speeds in Ireland. The
average windiest, windier and calmer months of the year in Wicklow records average wind
speeds of 18.1 mph (8.09 m/s), 14.5 mph (6.48 m/s) and 10.8 mph (4.83 m/s) respectively
(Weather Spark, 2018). It is important to note that these wind speeds are the average of the
entire Wicklow region. The wind speeds vary from one season to another. Considering that
the onshore site where the wind farm in this project is planned to be constructed is along the
coastline bordering the Irish Sea, the wind speed in the region is definitely higher than the
Wind Wind
turbines
Coupling and gear
system Generator Transformer
SubstationPower grid
Controller
Consumers
Page 7
2.1. Flow model diagram
Figure 3 below is the flow model diagram of the wind farm. The wind turbines convert
kinetic energy from the wind into mechanical or rotational energy. The coupling and gear
system steps up the speed of the mechanical energy and transfers to the rotor of the generator.
The generator converts mechanical energy and electrical energy (electricity). The controller
detects the wind speed, wind direction, temperature and output from the generator then
initiates appropriate signals to control them. The transformer manipulates power voltage level
for safe transmission. The substation increases or reduces voltage before the electricity is
connected to the power grid. The power grid distributes the electricity to the final consumers.
Figure 3: Flow model diagram
2.2. Wind Power Output model
Intack, County of Wicklow is one of the regions with average wind speeds in Ireland. The
average windiest, windier and calmer months of the year in Wicklow records average wind
speeds of 18.1 mph (8.09 m/s), 14.5 mph (6.48 m/s) and 10.8 mph (4.83 m/s) respectively
(Weather Spark, 2018). It is important to note that these wind speeds are the average of the
entire Wicklow region. The wind speeds vary from one season to another. Considering that
the onshore site where the wind farm in this project is planned to be constructed is along the
coastline bordering the Irish Sea, the wind speed in the region is definitely higher than the
Wind Wind
turbines
Coupling and gear
system Generator Transformer
SubstationPower grid
Controller
Consumers
SCHOOL OF CIVIL AND STRUCTURAL ENGINEERING
Page 8
average calmer, windier and windiest values. Therefore the wind power output in this project
is calculated using average wind speed of 18.5 mph (8.26 m/s). This value is obtained from
the IEA Wind website (IEA Wind, (n.d.)).
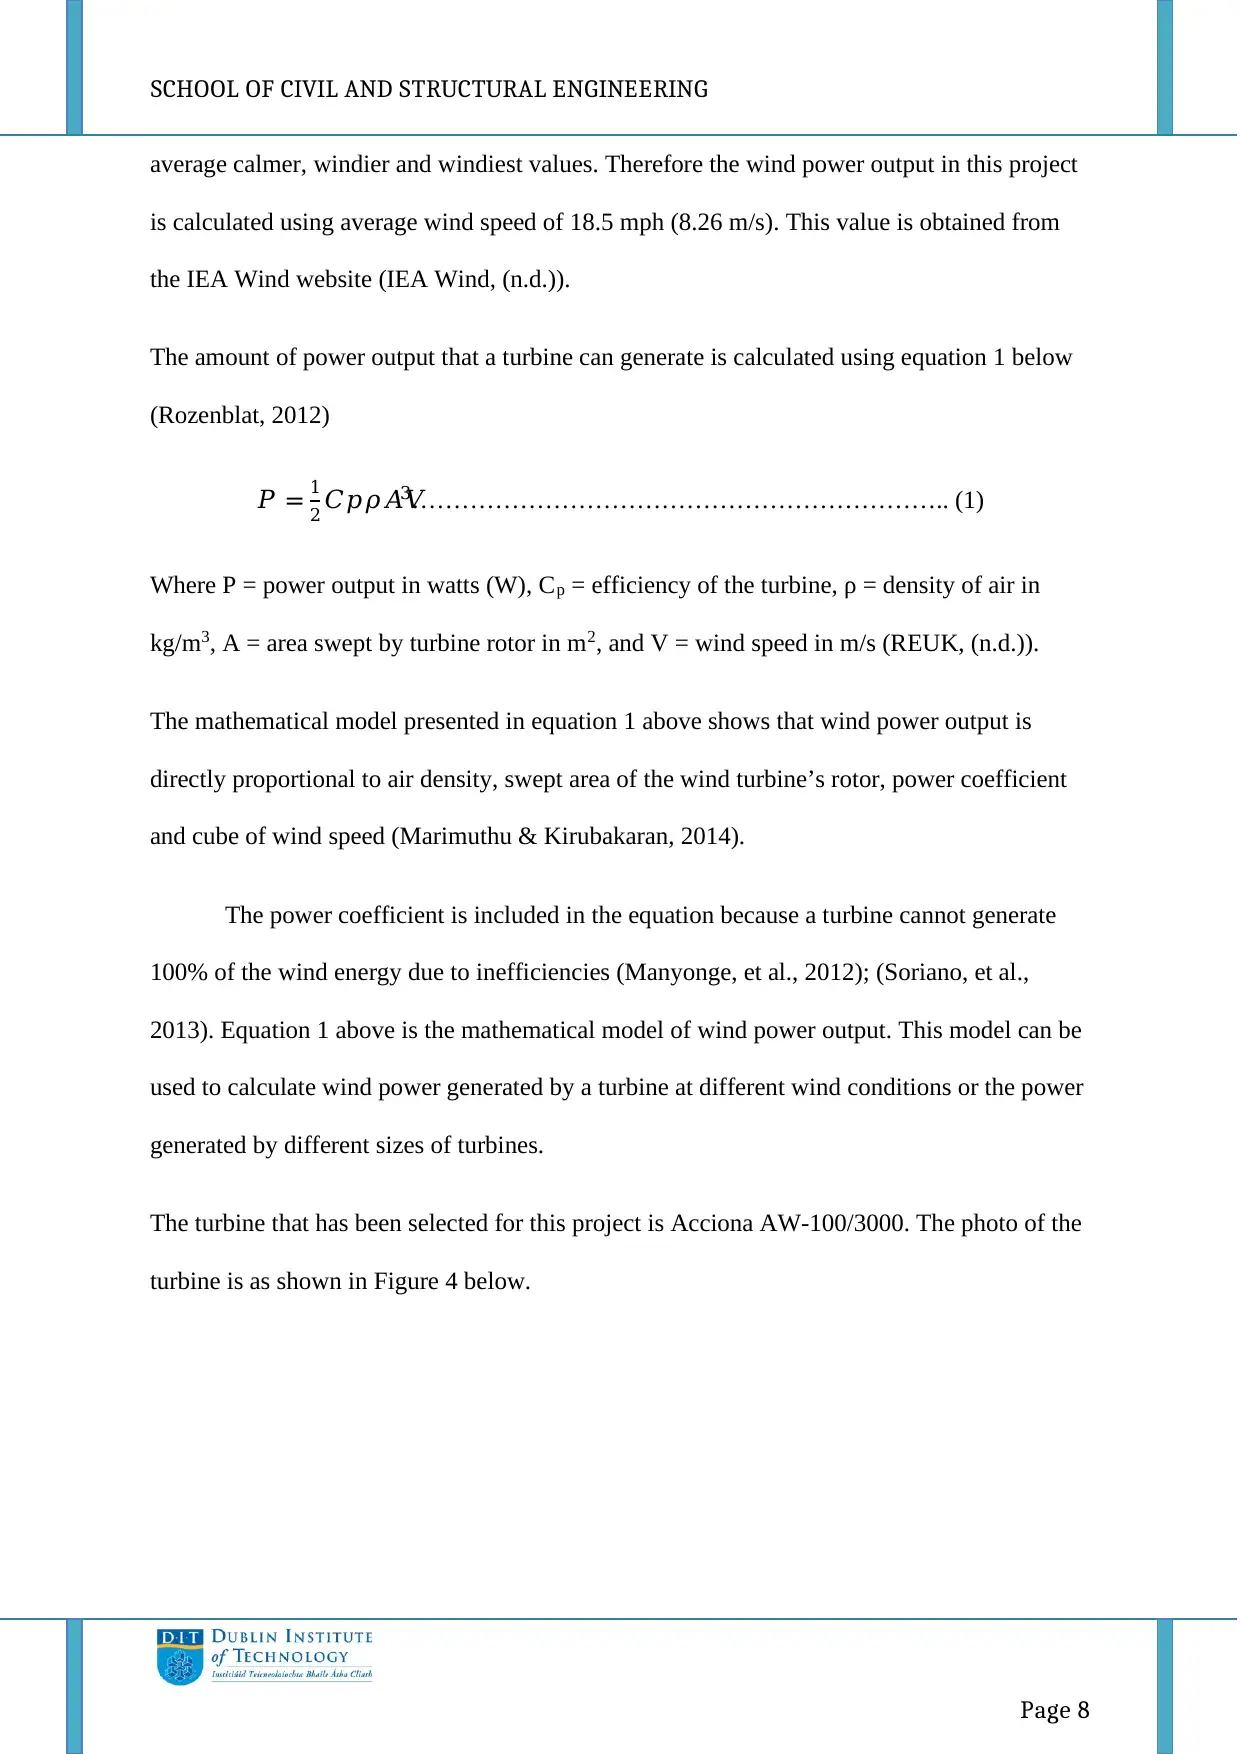
The amount of power output that a turbine can generate is calculated using equation 1 below
(Rozenblat, 2012)
𝑃 = 1
2 𝐶𝑝𝜌𝐴𝑉3……………………………………………………….. (1)
Where P = power output in watts (W), Cp = efficiency of the turbine, ρ = density of air in
kg/m3, A = area swept by turbine rotor in m2, and V = wind speed in m/s (REUK, (n.d.)).
The mathematical model presented in equation 1 above shows that wind power output is
directly proportional to air density, swept area of the wind turbine’s rotor, power coefficient
and cube of wind speed (Marimuthu & Kirubakaran, 2014).
The power coefficient is included in the equation because a turbine cannot generate
100% of the wind energy due to inefficiencies (Manyonge, et al., 2012); (Soriano, et al.,
2013). Equation 1 above is the mathematical model of wind power output. This model can be
used to calculate wind power generated by a turbine at different wind conditions or the power
generated by different sizes of turbines.
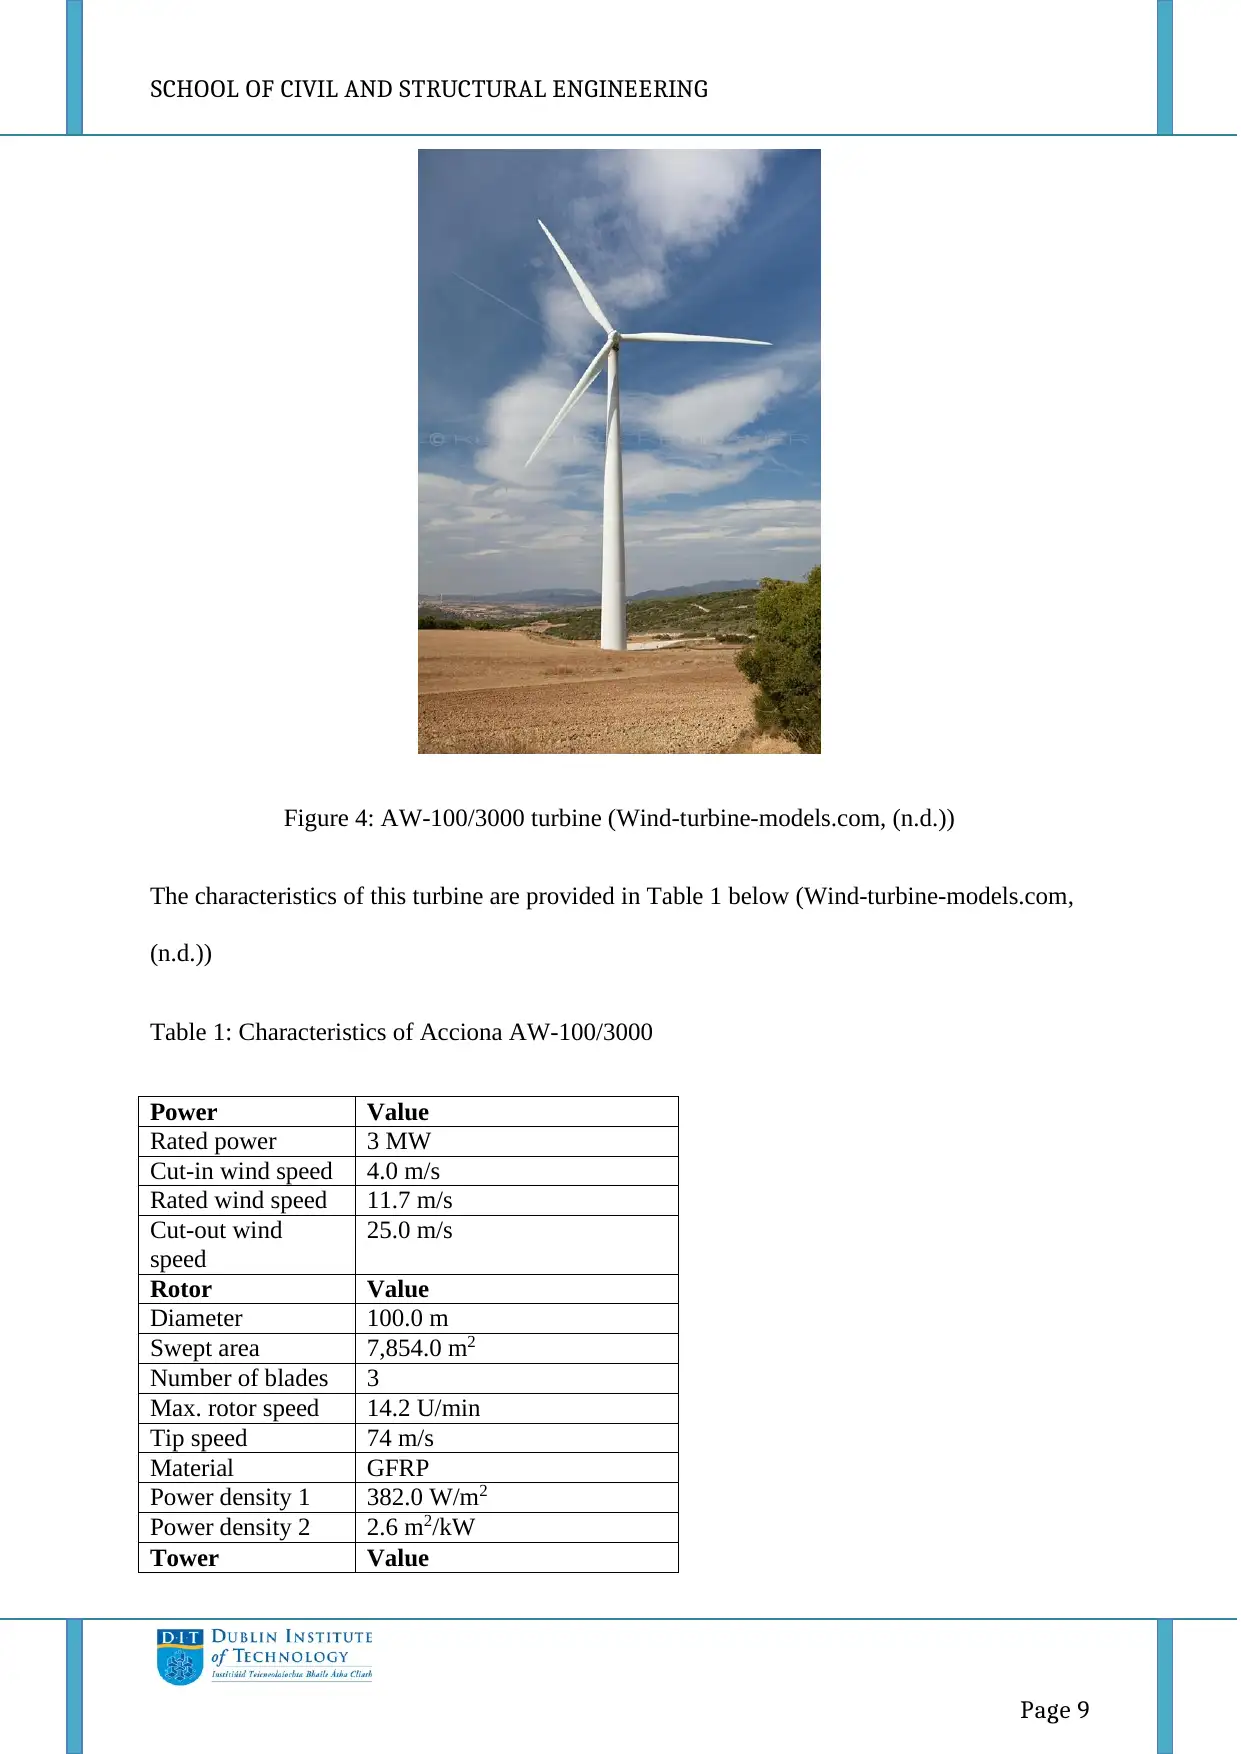
The turbine that has been selected for this project is Acciona AW-100/3000. The photo of the
turbine is as shown in Figure 4 below.
Page 8
average calmer, windier and windiest values. Therefore the wind power output in this project
is calculated using average wind speed of 18.5 mph (8.26 m/s). This value is obtained from
the IEA Wind website (IEA Wind, (n.d.)).
The amount of power output that a turbine can generate is calculated using equation 1 below
(Rozenblat, 2012)
𝑃 = 1
2 𝐶𝑝𝜌𝐴𝑉3……………………………………………………….. (1)
Where P = power output in watts (W), Cp = efficiency of the turbine, ρ = density of air in
kg/m3, A = area swept by turbine rotor in m2, and V = wind speed in m/s (REUK, (n.d.)).
The mathematical model presented in equation 1 above shows that wind power output is
directly proportional to air density, swept area of the wind turbine’s rotor, power coefficient
and cube of wind speed (Marimuthu & Kirubakaran, 2014).
The power coefficient is included in the equation because a turbine cannot generate
100% of the wind energy due to inefficiencies (Manyonge, et al., 2012); (Soriano, et al.,
2013). Equation 1 above is the mathematical model of wind power output. This model can be
used to calculate wind power generated by a turbine at different wind conditions or the power
generated by different sizes of turbines.
The turbine that has been selected for this project is Acciona AW-100/3000. The photo of the
turbine is as shown in Figure 4 below.
⊘ This is a preview!⊘
Do you want full access?
Subscribe today to unlock all pages.
Trusted by 1+ million students worldwide
SCHOOL OF CIVIL AND STRUCTURAL ENGINEERING
Page 9
Figure 4: AW-100/3000 turbine (Wind-turbine-models.com, (n.d.))
The characteristics of this turbine are provided in Table 1 below (Wind-turbine-models.com,
(n.d.))
Table 1: Characteristics of Acciona AW-100/3000
Power Value
Rated power 3 MW
Cut-in wind speed 4.0 m/s
Rated wind speed 11.7 m/s
Cut-out wind
speed
25.0 m/s
Rotor Value
Diameter 100.0 m
Swept area 7,854.0 m2
Number of blades 3
Max. rotor speed 14.2 U/min
Tip speed 74 m/s
Material GFRP
Power density 1 382.0 W/m2
Power density 2 2.6 m2/kW
Tower Value
Paraphrase This Document
Need a fresh take? Get an instant paraphrase of this document with our AI Paraphraser
SCHOOL OF CIVIL AND STRUCTURAL ENGINEERING
Page 10
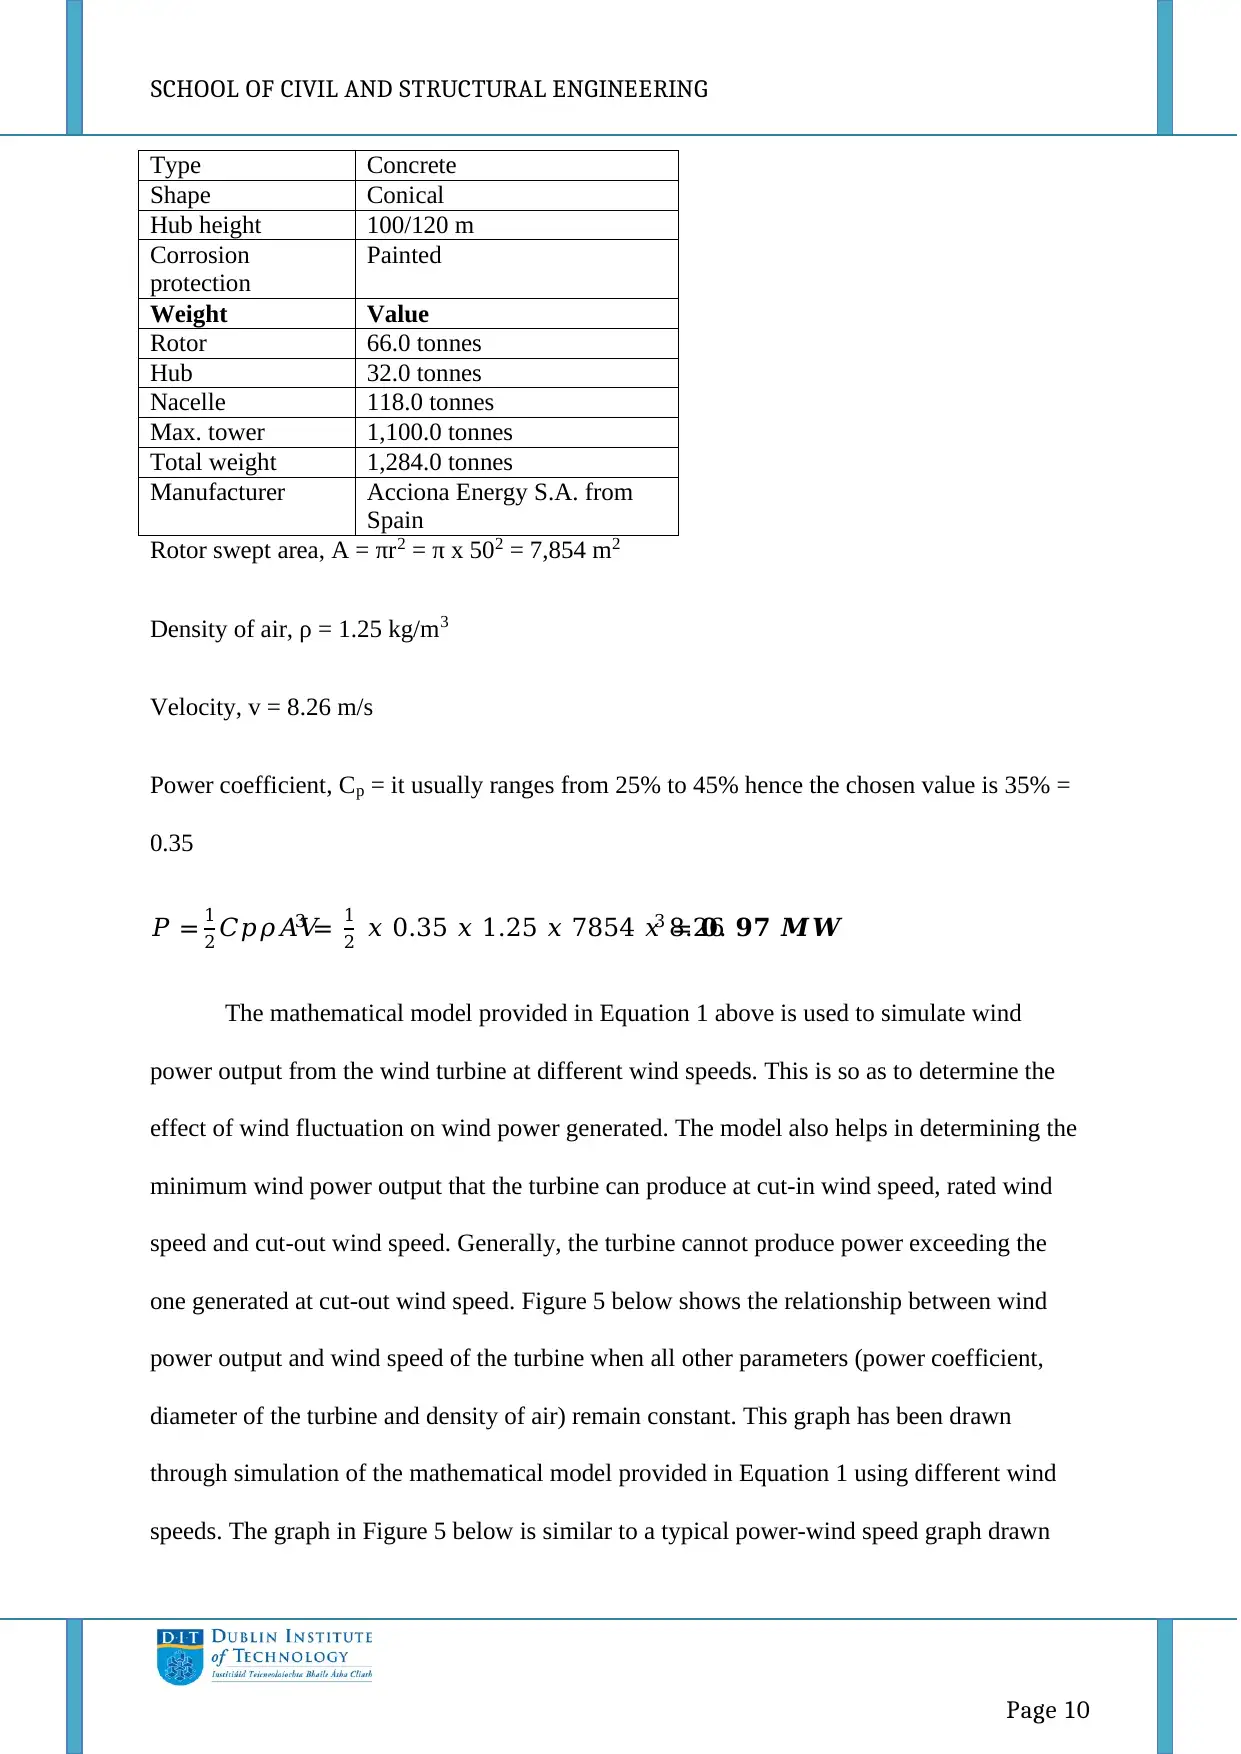
Rotor swept area, A = πr2 = π x 502 = 7,854 m2
Density of air, ρ = 1.25 kg/m3
Velocity, v = 8.26 m/s
Power coefficient, Cp = it usually ranges from 25% to 45% hence the chosen value is 35% =
0.35
𝑃 = 1
2 𝐶𝑝𝜌𝐴𝑉3 = 1
2 𝑥 0.35 𝑥 1.25 𝑥 7854 𝑥 8.263 = 𝟎. 𝟗𝟕 𝑴𝑾
The mathematical model provided in Equation 1 above is used to simulate wind
power output from the wind turbine at different wind speeds. This is so as to determine the
effect of wind fluctuation on wind power generated. The model also helps in determining the
minimum wind power output that the turbine can produce at cut-in wind speed, rated wind
speed and cut-out wind speed. Generally, the turbine cannot produce power exceeding the
one generated at cut-out wind speed. Figure 5 below shows the relationship between wind
power output and wind speed of the turbine when all other parameters (power coefficient,
diameter of the turbine and density of air) remain constant. This graph has been drawn
through simulation of the mathematical model provided in Equation 1 using different wind
speeds. The graph in Figure 5 below is similar to a typical power-wind speed graph drawn
Type Concrete
Shape Conical
Hub height 100/120 m
Corrosion
protection
Painted
Weight Value
Rotor 66.0 tonnes
Hub 32.0 tonnes
Nacelle 118.0 tonnes
Max. tower 1,100.0 tonnes
Total weight 1,284.0 tonnes
Manufacturer Acciona Energy S.A. from
Spain
Page 10
Rotor swept area, A = πr2 = π x 502 = 7,854 m2
Density of air, ρ = 1.25 kg/m3
Velocity, v = 8.26 m/s
Power coefficient, Cp = it usually ranges from 25% to 45% hence the chosen value is 35% =
0.35
𝑃 = 1
2 𝐶𝑝𝜌𝐴𝑉3 = 1
2 𝑥 0.35 𝑥 1.25 𝑥 7854 𝑥 8.263 = 𝟎. 𝟗𝟕 𝑴𝑾
The mathematical model provided in Equation 1 above is used to simulate wind
power output from the wind turbine at different wind speeds. This is so as to determine the
effect of wind fluctuation on wind power generated. The model also helps in determining the
minimum wind power output that the turbine can produce at cut-in wind speed, rated wind
speed and cut-out wind speed. Generally, the turbine cannot produce power exceeding the
one generated at cut-out wind speed. Figure 5 below shows the relationship between wind
power output and wind speed of the turbine when all other parameters (power coefficient,
diameter of the turbine and density of air) remain constant. This graph has been drawn
through simulation of the mathematical model provided in Equation 1 using different wind
speeds. The graph in Figure 5 below is similar to a typical power-wind speed graph drawn
Type Concrete
Shape Conical
Hub height 100/120 m
Corrosion
protection
Painted
Weight Value
Rotor 66.0 tonnes
Hub 32.0 tonnes
Nacelle 118.0 tonnes
Max. tower 1,100.0 tonnes
Total weight 1,284.0 tonnes
Manufacturer Acciona Energy S.A. from
Spain
SCHOOL OF CIVIL AND STRUCTURAL ENGINEERING
Page 11
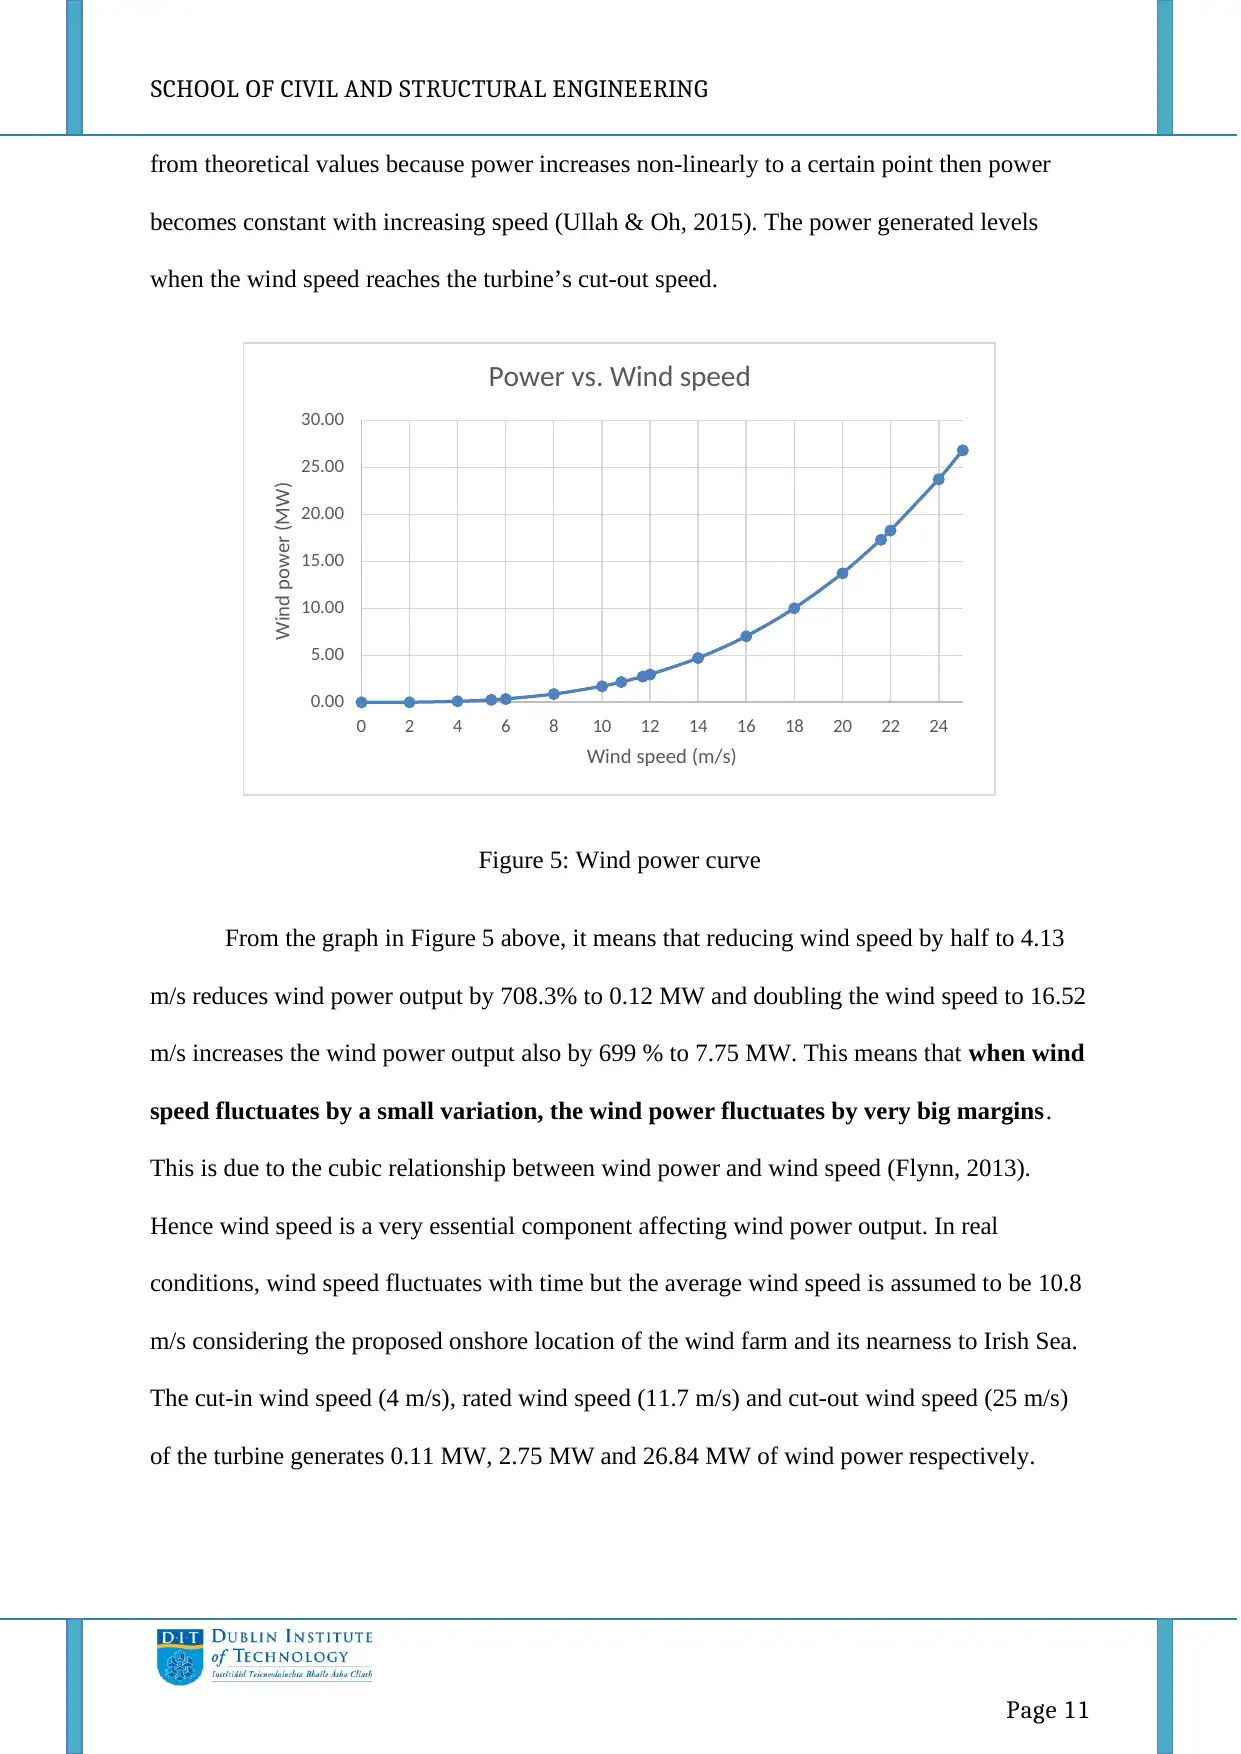
from theoretical values because power increases non-linearly to a certain point then power
becomes constant with increasing speed (Ullah & Oh, 2015). The power generated levels
when the wind speed reaches the turbine’s cut-out speed.
Figure 5: Wind power curve
From the graph in Figure 5 above, it means that reducing wind speed by half to 4.13
m/s reduces wind power output by 708.3% to 0.12 MW and doubling the wind speed to 16.52
m/s increases the wind power output also by 699 % to 7.75 MW. This means that when wind
speed fluctuates by a small variation, the wind power fluctuates by very big margins.
This is due to the cubic relationship between wind power and wind speed (Flynn, 2013).
Hence wind speed is a very essential component affecting wind power output. In real
conditions, wind speed fluctuates with time but the average wind speed is assumed to be 10.8
m/s considering the proposed onshore location of the wind farm and its nearness to Irish Sea.
The cut-in wind speed (4 m/s), rated wind speed (11.7 m/s) and cut-out wind speed (25 m/s)
of the turbine generates 0.11 MW, 2.75 MW and 26.84 MW of wind power respectively.
0.00
5.00
10.00
15.00
20.00
25.00
30.00
0 2 4 6 8 10 12 14 16 18 20 22 24
Wind power (MW)
Wind speed (m/s)
Power vs. Wind speed
Page 11
from theoretical values because power increases non-linearly to a certain point then power
becomes constant with increasing speed (Ullah & Oh, 2015). The power generated levels
when the wind speed reaches the turbine’s cut-out speed.
Figure 5: Wind power curve
From the graph in Figure 5 above, it means that reducing wind speed by half to 4.13
m/s reduces wind power output by 708.3% to 0.12 MW and doubling the wind speed to 16.52
m/s increases the wind power output also by 699 % to 7.75 MW. This means that when wind
speed fluctuates by a small variation, the wind power fluctuates by very big margins.
This is due to the cubic relationship between wind power and wind speed (Flynn, 2013).
Hence wind speed is a very essential component affecting wind power output. In real
conditions, wind speed fluctuates with time but the average wind speed is assumed to be 10.8
m/s considering the proposed onshore location of the wind farm and its nearness to Irish Sea.
The cut-in wind speed (4 m/s), rated wind speed (11.7 m/s) and cut-out wind speed (25 m/s)
of the turbine generates 0.11 MW, 2.75 MW and 26.84 MW of wind power respectively.
0.00
5.00
10.00
15.00
20.00
25.00
30.00
0 2 4 6 8 10 12 14 16 18 20 22 24
Wind power (MW)
Wind speed (m/s)
Power vs. Wind speed
⊘ This is a preview!⊘
Do you want full access?
Subscribe today to unlock all pages.
Trusted by 1+ million students worldwide
1 out of 54
Your All-in-One AI-Powered Toolkit for Academic Success.
+13062052269
info@desklib.com
Available 24*7 on WhatsApp / Email
![[object Object]](/_next/static/media/star-bottom.7253800d.svg)
Unlock your academic potential
Copyright © 2020–2026 A2Z Services. All Rights Reserved. Developed and managed by ZUCOL.