Historic Energy Projections: Comparing with Current Consumption
VerifiedAdded on 2023/04/22
|11
|2460
|167
Report
AI Summary
This report provides a comparative analysis of historic energy projections and current energy consumption data, highlighting the discrepancies between predicted and actual energy use. The analysis reveals that projected energy consumption has generally been higher than actual consumption, with discrepancies ranging from 18.4% to 27.9% in the years examined (2000, 2010, 2020, and 2025). The report identifies several factors contributing to these differences, including technological development, economic and social changes, environmental factors, population growth, user behavior, and the assumptions used in energy modeling. It also discusses how these discrepancies can affect future energy market projections, emphasizing the importance of incorporating relevant variables and refining assumptions in energy modeling systems to improve the accuracy of future energy demand predictions. The report concludes that understanding these differences is crucial for developing effective strategies to meet future global energy demands and reduce greenhouse gas emissions.
Comparison of Historic Energy Projections and Current Data 1
COMPARISON OF HISTORIC ENERGY PROJECTIONS AND CURRENT DATA
Name
Course code
Module name
Professor
University
City/state
Date
COMPARISON OF HISTORIC ENERGY PROJECTIONS AND CURRENT DATA
Name
Course code
Module name
Professor
University
City/state
Date
Paraphrase This Document
Need a fresh take? Get an instant paraphrase of this document with our AI Paraphraser
Comparison of Historic Energy Projections and Current Data 2
Executive Summary
For many decades, global energy consumption has been increasing and this trend is projected to
remain in the next several decades. Renewable energy consumption is also increasing rapidly
whereas dependence on non-renewable energy is decreasing. Energy modelling systems are used
to predict future energy consumption. However, there is always discrepancy between projected
and actual energy consumption. Data analyzed in this report revealed the discrepancy between
projected and actual global energy consumption ranged from 18.4% and 27.9%, with projected
energy consumption being greater than actual energy consumption. Some of the factors
contributing to this discrepancy include: population growth, environmental changes,
technological development, economic and social development, user behavior, and type of
variables and assumptions made. This information can be used to improve energy consumption
projections in the future.
Comparison of Historic Energy Projections and Current Data 3
1. Introduction
Global energy demand has continued to increase over the years and this trend is anticipated
to be maintained in the coming decades due to increasing global population, changing lifestyles,
and ongoing social and economic development. Energy experts, both in the public and private
sectors, usually predict energy demand using historic data. These predictions are used to develop
appropriate investment strategies of meeting future energy demand cost effectively and
sustainably. They can also be used to monitor greenhouse gas emissions and other environmental
impacts related to energy production and consumption (Owusu & Asumadu-Sarkodie, 2016).
However, there is usually a dissimilarity between the predicted energy use and the actual energy
use. The energy projections can either be overestimated or underestimated. The main aim of this
report is to explore the comparison between historic energy projections and actual energy
consumption (that is, comparison between energy demand projections and actual energy
demand). The report will also highlight some of the reasons or factors contributing to this
difference and the effect of this difference on future energy demand projections. Findings from
this report can help energy experts to establish suitable strategies that they can use to improve the
accuracy of future energy demand projections.
2. Comparison of historic and actual global energy consumption
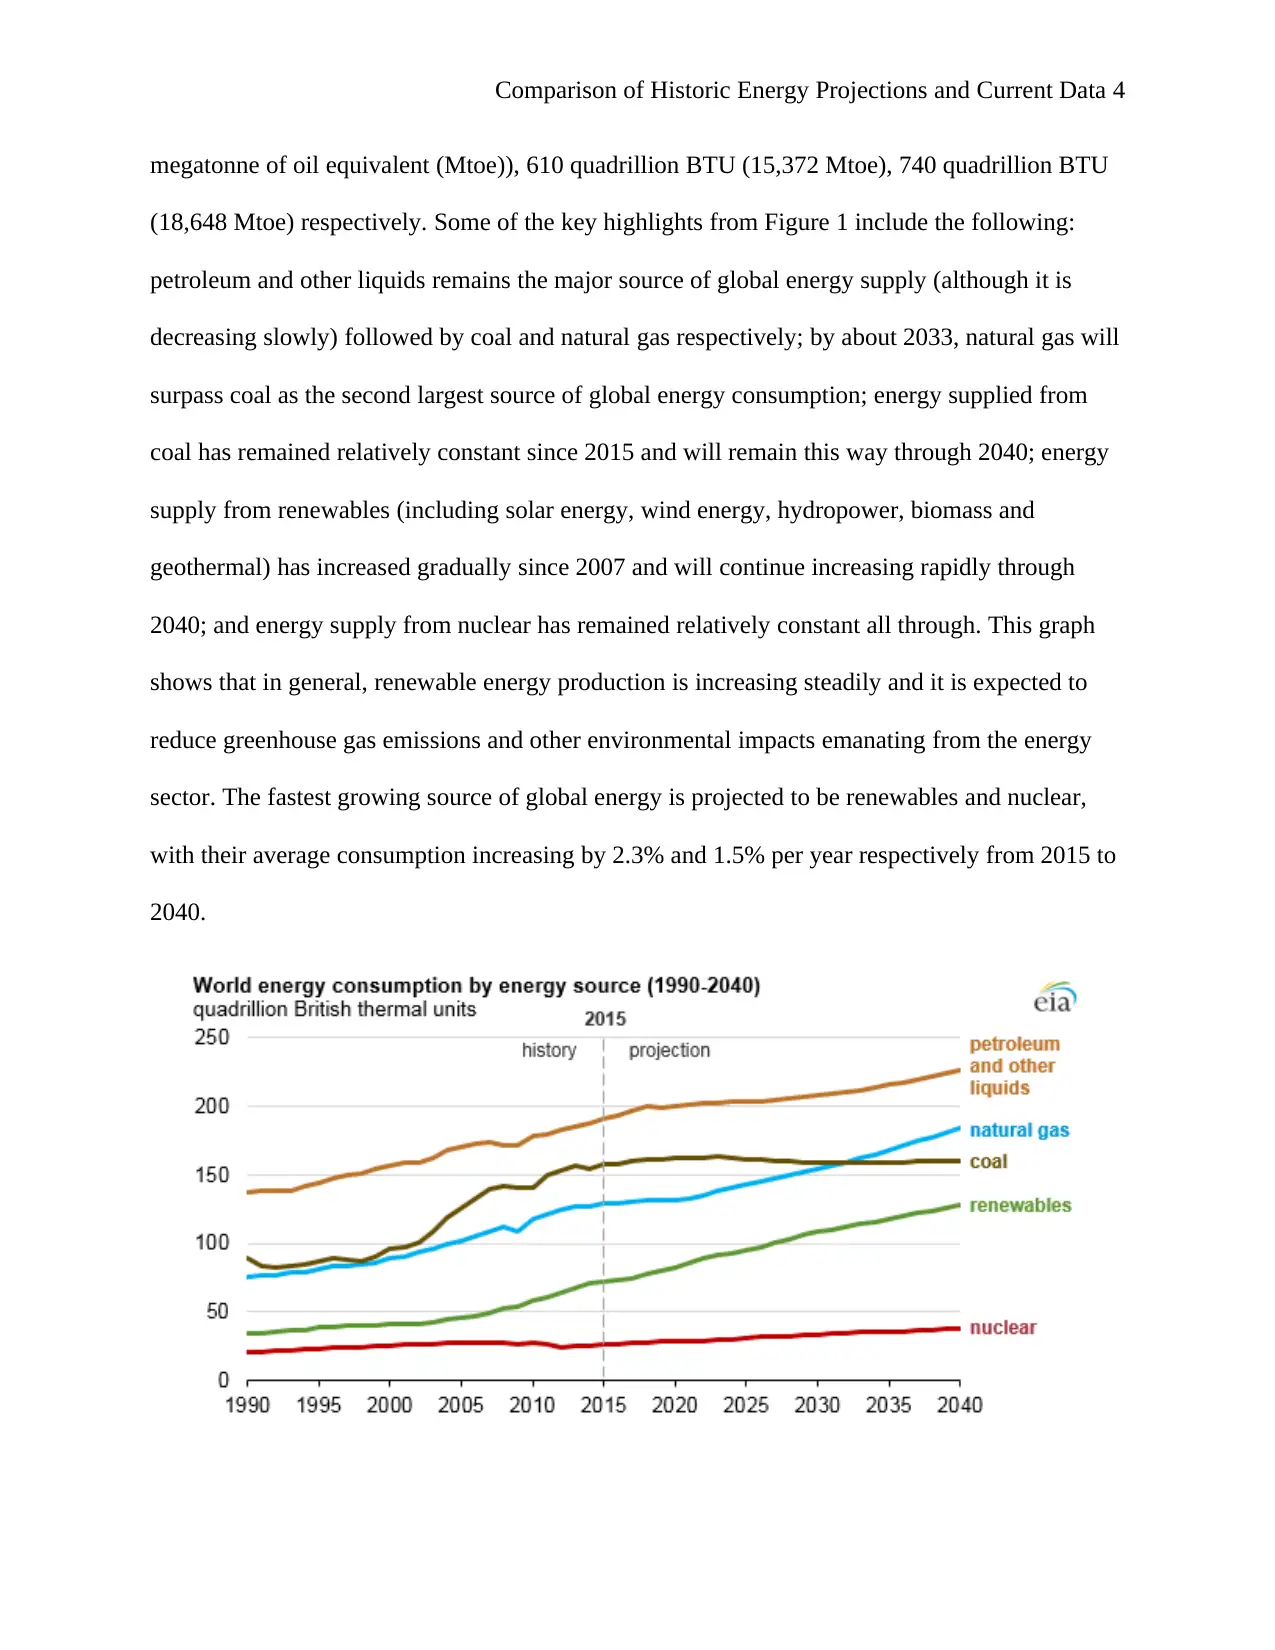
Many companies, organizations and experts predict global energy consumption using
different energy modelling systems (EMS). Figure 1 below shows historical and predicted global
energy consumption by source of energy as estimated by International Energy Agency (IEA).
The graphs in Figure 1 below shows that the world energy consumption has been increasing
since 1990 and will continue increasing through 2040. The estimated total global energy
consumption in 1990, 2018 and 2040 is 365 quadrillion British thermal units (BTU) (9,198
1. Introduction
Global energy demand has continued to increase over the years and this trend is anticipated
to be maintained in the coming decades due to increasing global population, changing lifestyles,
and ongoing social and economic development. Energy experts, both in the public and private
sectors, usually predict energy demand using historic data. These predictions are used to develop
appropriate investment strategies of meeting future energy demand cost effectively and
sustainably. They can also be used to monitor greenhouse gas emissions and other environmental
impacts related to energy production and consumption (Owusu & Asumadu-Sarkodie, 2016).
However, there is usually a dissimilarity between the predicted energy use and the actual energy
use. The energy projections can either be overestimated or underestimated. The main aim of this
report is to explore the comparison between historic energy projections and actual energy
consumption (that is, comparison between energy demand projections and actual energy
demand). The report will also highlight some of the reasons or factors contributing to this
difference and the effect of this difference on future energy demand projections. Findings from
this report can help energy experts to establish suitable strategies that they can use to improve the
accuracy of future energy demand projections.
2. Comparison of historic and actual global energy consumption
Many companies, organizations and experts predict global energy consumption using
different energy modelling systems (EMS). Figure 1 below shows historical and predicted global
energy consumption by source of energy as estimated by International Energy Agency (IEA).
The graphs in Figure 1 below shows that the world energy consumption has been increasing
since 1990 and will continue increasing through 2040. The estimated total global energy
consumption in 1990, 2018 and 2040 is 365 quadrillion British thermal units (BTU) (9,198
⊘ This is a preview!⊘
Do you want full access?
Subscribe today to unlock all pages.
Trusted by 1+ million students worldwide
Comparison of Historic Energy Projections and Current Data 4
megatonne of oil equivalent (Mtoe)), 610 quadrillion BTU (15,372 Mtoe), 740 quadrillion BTU
(18,648 Mtoe) respectively. Some of the key highlights from Figure 1 include the following:
petroleum and other liquids remains the major source of global energy supply (although it is
decreasing slowly) followed by coal and natural gas respectively; by about 2033, natural gas will
surpass coal as the second largest source of global energy consumption; energy supplied from
coal has remained relatively constant since 2015 and will remain this way through 2040; energy
supply from renewables (including solar energy, wind energy, hydropower, biomass and
geothermal) has increased gradually since 2007 and will continue increasing rapidly through
2040; and energy supply from nuclear has remained relatively constant all through. This graph
shows that in general, renewable energy production is increasing steadily and it is expected to
reduce greenhouse gas emissions and other environmental impacts emanating from the energy
sector. The fastest growing source of global energy is projected to be renewables and nuclear,
with their average consumption increasing by 2.3% and 1.5% per year respectively from 2015 to
2040.
Paraphrase This Document
Need a fresh take? Get an instant paraphrase of this document with our AI Paraphraser
Comparison of Historic Energy Projections and Current Data 5
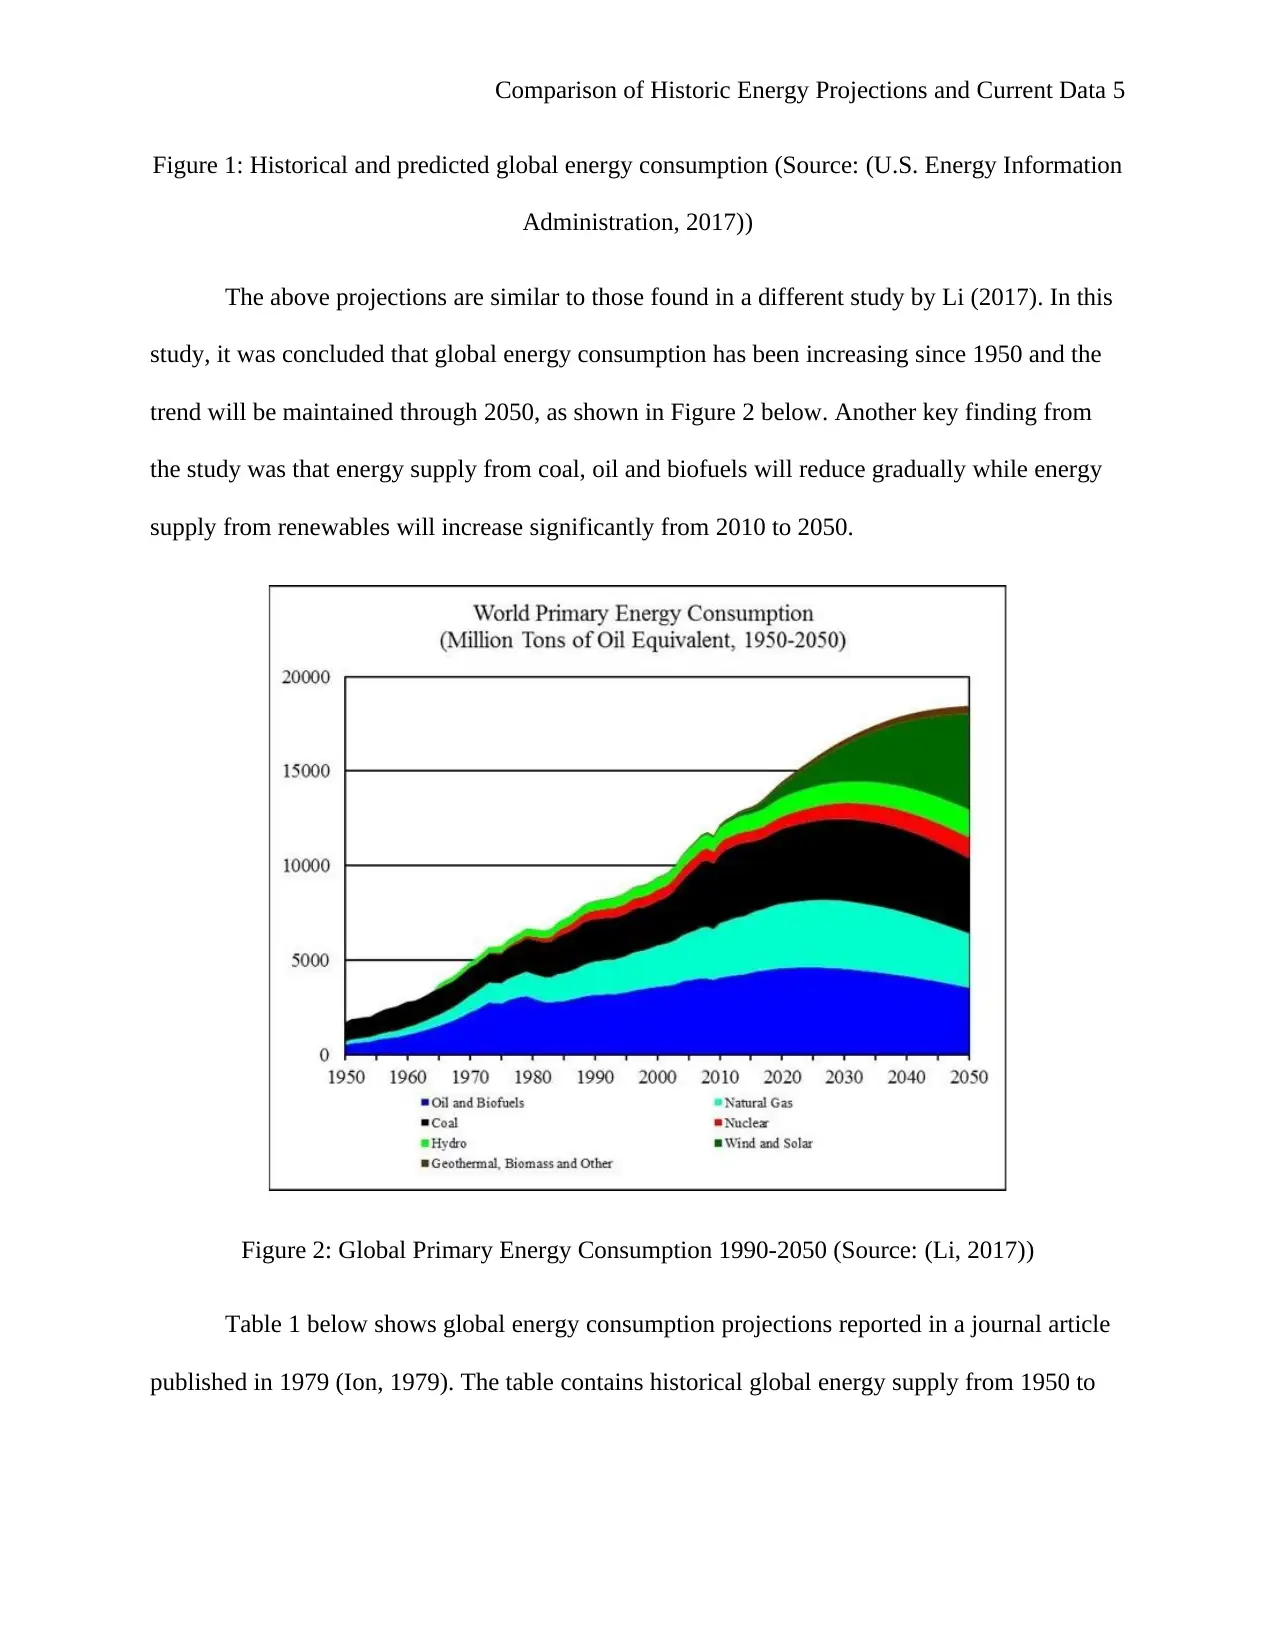
Figure 1: Historical and predicted global energy consumption (Source: (U.S. Energy Information
Administration, 2017))
The above projections are similar to those found in a different study by Li (2017). In this
study, it was concluded that global energy consumption has been increasing since 1950 and the
trend will be maintained through 2050, as shown in Figure 2 below. Another key finding from
the study was that energy supply from coal, oil and biofuels will reduce gradually while energy
supply from renewables will increase significantly from 2010 to 2050.
Figure 2: Global Primary Energy Consumption 1990-2050 (Source: (Li, 2017))
Table 1 below shows global energy consumption projections reported in a journal article
published in 1979 (Ion, 1979). The table contains historical global energy supply from 1950 to
Comparison of Historic Energy Projections and Current Data 6
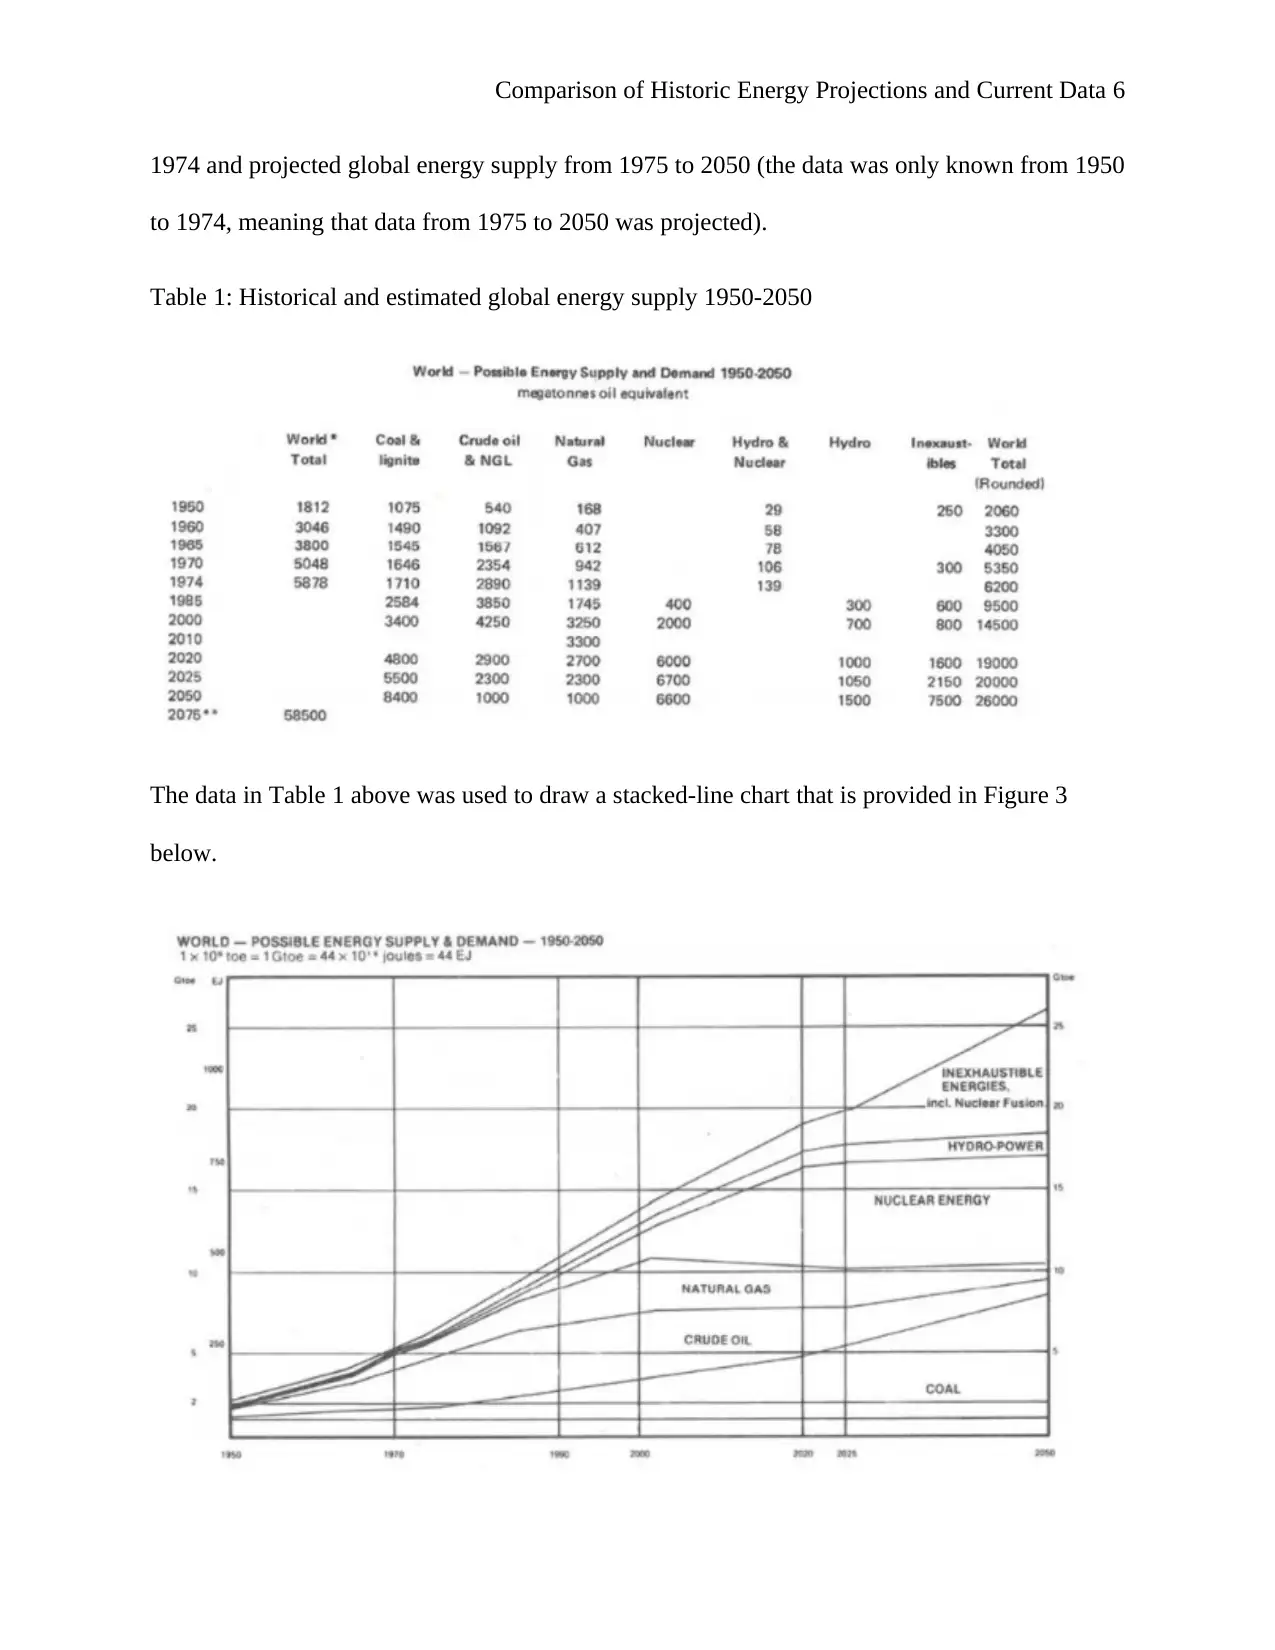
1974 and projected global energy supply from 1975 to 2050 (the data was only known from 1950
to 1974, meaning that data from 1975 to 2050 was projected).
Table 1: Historical and estimated global energy supply 1950-2050
The data in Table 1 above was used to draw a stacked-line chart that is provided in Figure 3
below.
⊘ This is a preview!⊘
Do you want full access?
Subscribe today to unlock all pages.
Trusted by 1+ million students worldwide
Comparison of Historic Energy Projections and Current Data 7
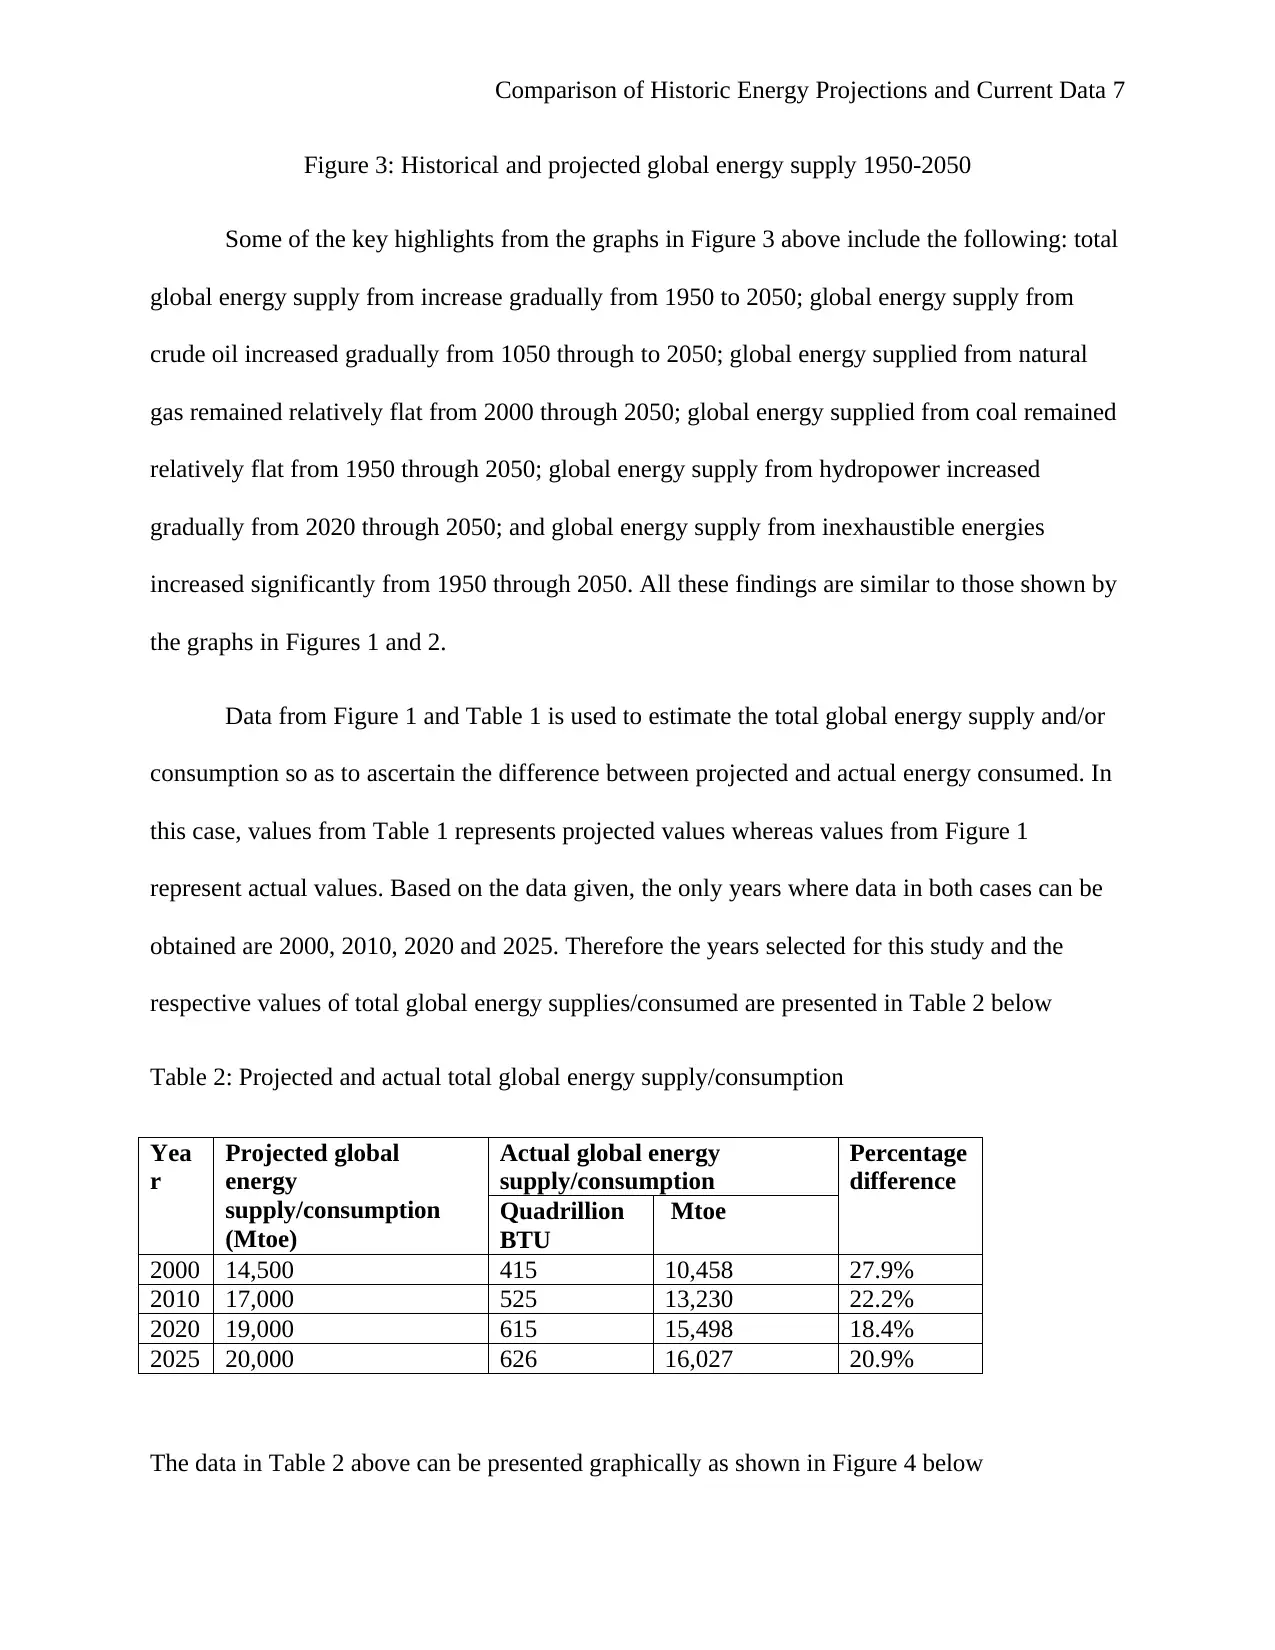
Figure 3: Historical and projected global energy supply 1950-2050
Some of the key highlights from the graphs in Figure 3 above include the following: total
global energy supply from increase gradually from 1950 to 2050; global energy supply from
crude oil increased gradually from 1050 through to 2050; global energy supplied from natural
gas remained relatively flat from 2000 through 2050; global energy supplied from coal remained
relatively flat from 1950 through 2050; global energy supply from hydropower increased
gradually from 2020 through 2050; and global energy supply from inexhaustible energies
increased significantly from 1950 through 2050. All these findings are similar to those shown by
the graphs in Figures 1 and 2.
Data from Figure 1 and Table 1 is used to estimate the total global energy supply and/or
consumption so as to ascertain the difference between projected and actual energy consumed. In
this case, values from Table 1 represents projected values whereas values from Figure 1
represent actual values. Based on the data given, the only years where data in both cases can be
obtained are 2000, 2010, 2020 and 2025. Therefore the years selected for this study and the
respective values of total global energy supplies/consumed are presented in Table 2 below
Table 2: Projected and actual total global energy supply/consumption
Yea
r
Projected global
energy
supply/consumption
(Mtoe)
Actual global energy
supply/consumption
Percentage
difference
Quadrillion
BTU
Mtoe
2000 14,500 415 10,458 27.9%
2010 17,000 525 13,230 22.2%
2020 19,000 615 15,498 18.4%
2025 20,000 626 16,027 20.9%
The data in Table 2 above can be presented graphically as shown in Figure 4 below
Paraphrase This Document
Need a fresh take? Get an instant paraphrase of this document with our AI Paraphraser
Comparison of Historic Energy Projections and Current Data 8
2000 2005 2010 2015 2020 2025
0
5000
10000
15000
20000
25000
Comparison of projected and actual global
energy
Projected global energy Actual global energy
Year
Global energy supply/consumptionn
(Mtoe)
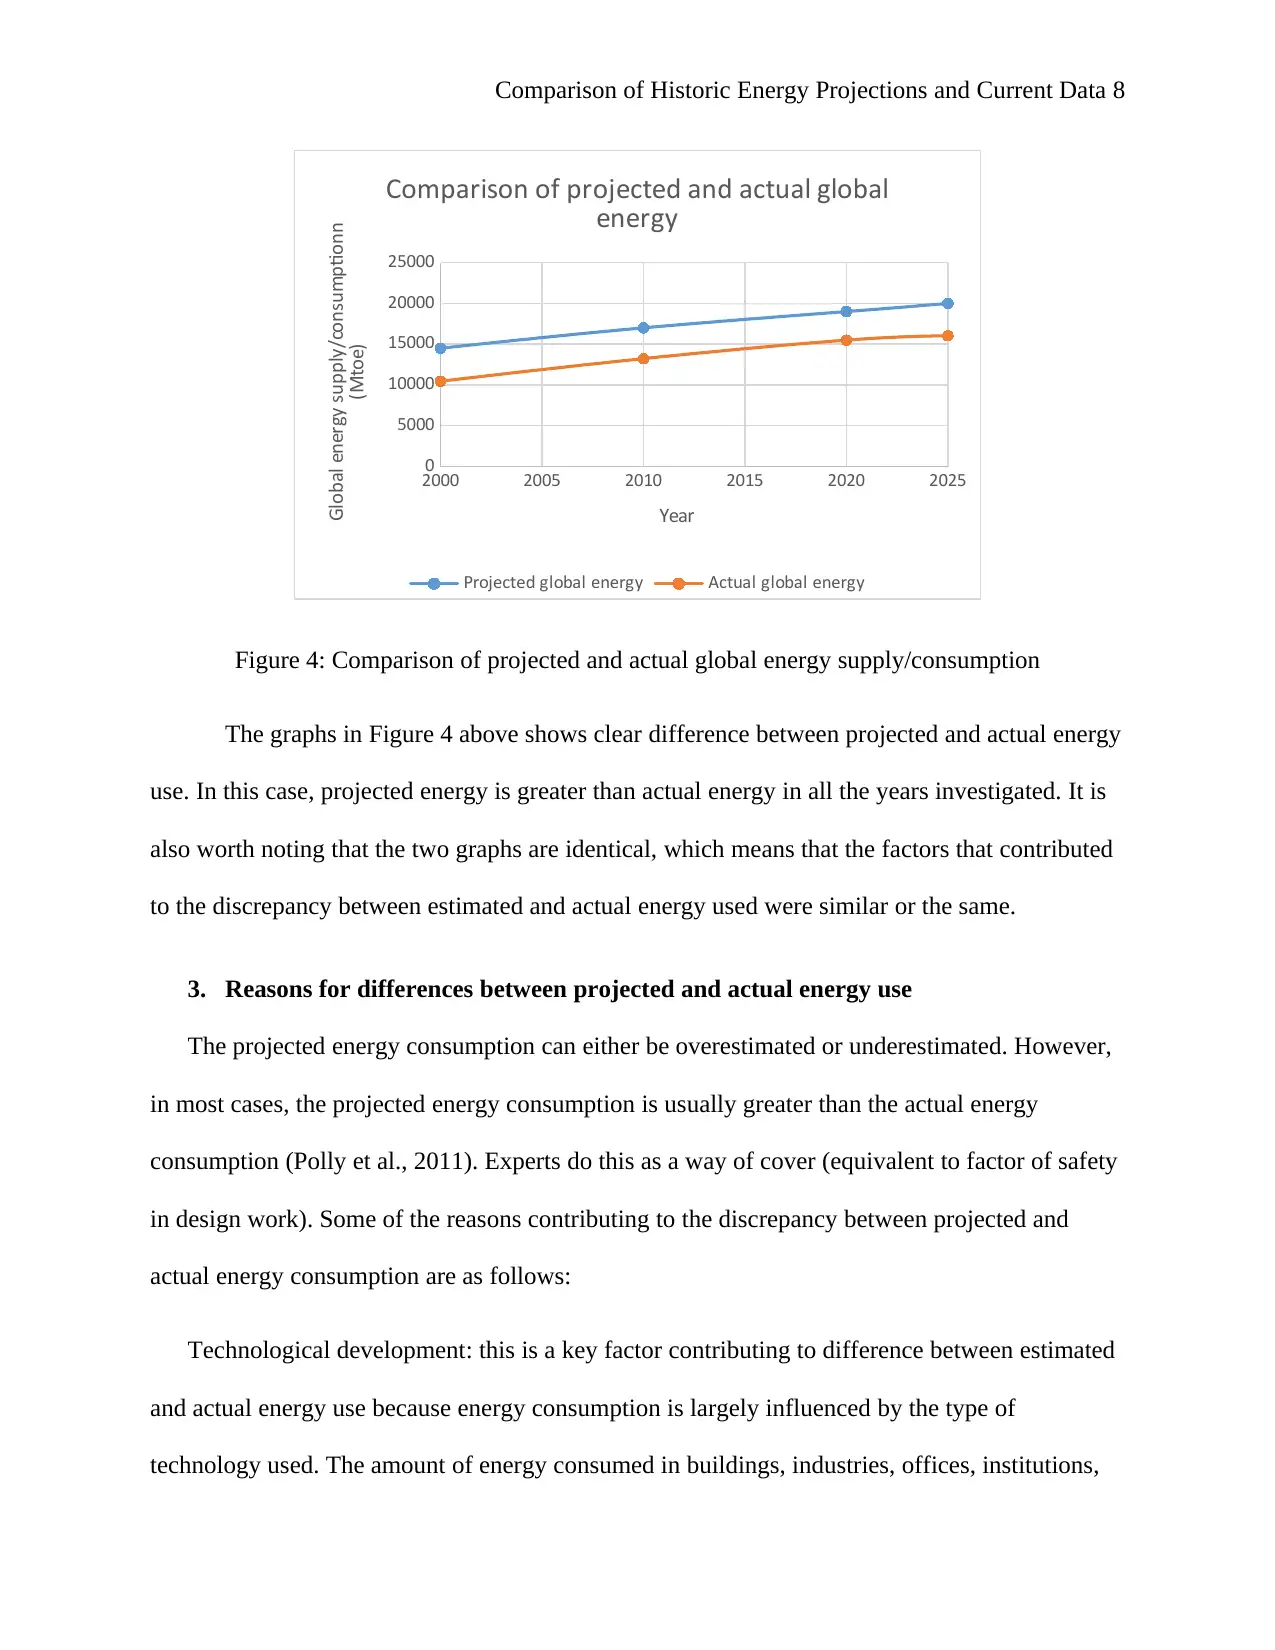
Figure 4: Comparison of projected and actual global energy supply/consumption
The graphs in Figure 4 above shows clear difference between projected and actual energy
use. In this case, projected energy is greater than actual energy in all the years investigated. It is
also worth noting that the two graphs are identical, which means that the factors that contributed
to the discrepancy between estimated and actual energy used were similar or the same.
3. Reasons for differences between projected and actual energy use
The projected energy consumption can either be overestimated or underestimated. However,
in most cases, the projected energy consumption is usually greater than the actual energy
consumption (Polly et al., 2011). Experts do this as a way of cover (equivalent to factor of safety
in design work). Some of the reasons contributing to the discrepancy between projected and
actual energy consumption are as follows:
Technological development: this is a key factor contributing to difference between estimated
and actual energy use because energy consumption is largely influenced by the type of
technology used. The amount of energy consumed in buildings, industries, offices, institutions,
2000 2005 2010 2015 2020 2025
0
5000
10000
15000
20000
25000
Comparison of projected and actual global
energy
Projected global energy Actual global energy
Year
Global energy supply/consumptionn
(Mtoe)
Figure 4: Comparison of projected and actual global energy supply/consumption
The graphs in Figure 4 above shows clear difference between projected and actual energy
use. In this case, projected energy is greater than actual energy in all the years investigated. It is
also worth noting that the two graphs are identical, which means that the factors that contributed
to the discrepancy between estimated and actual energy used were similar or the same.
3. Reasons for differences between projected and actual energy use
The projected energy consumption can either be overestimated or underestimated. However,
in most cases, the projected energy consumption is usually greater than the actual energy
consumption (Polly et al., 2011). Experts do this as a way of cover (equivalent to factor of safety
in design work). Some of the reasons contributing to the discrepancy between projected and
actual energy consumption are as follows:
Technological development: this is a key factor contributing to difference between estimated
and actual energy use because energy consumption is largely influenced by the type of
technology used. The amount of energy consumed in buildings, industries, offices, institutions,
Comparison of Historic Energy Projections and Current Data 9
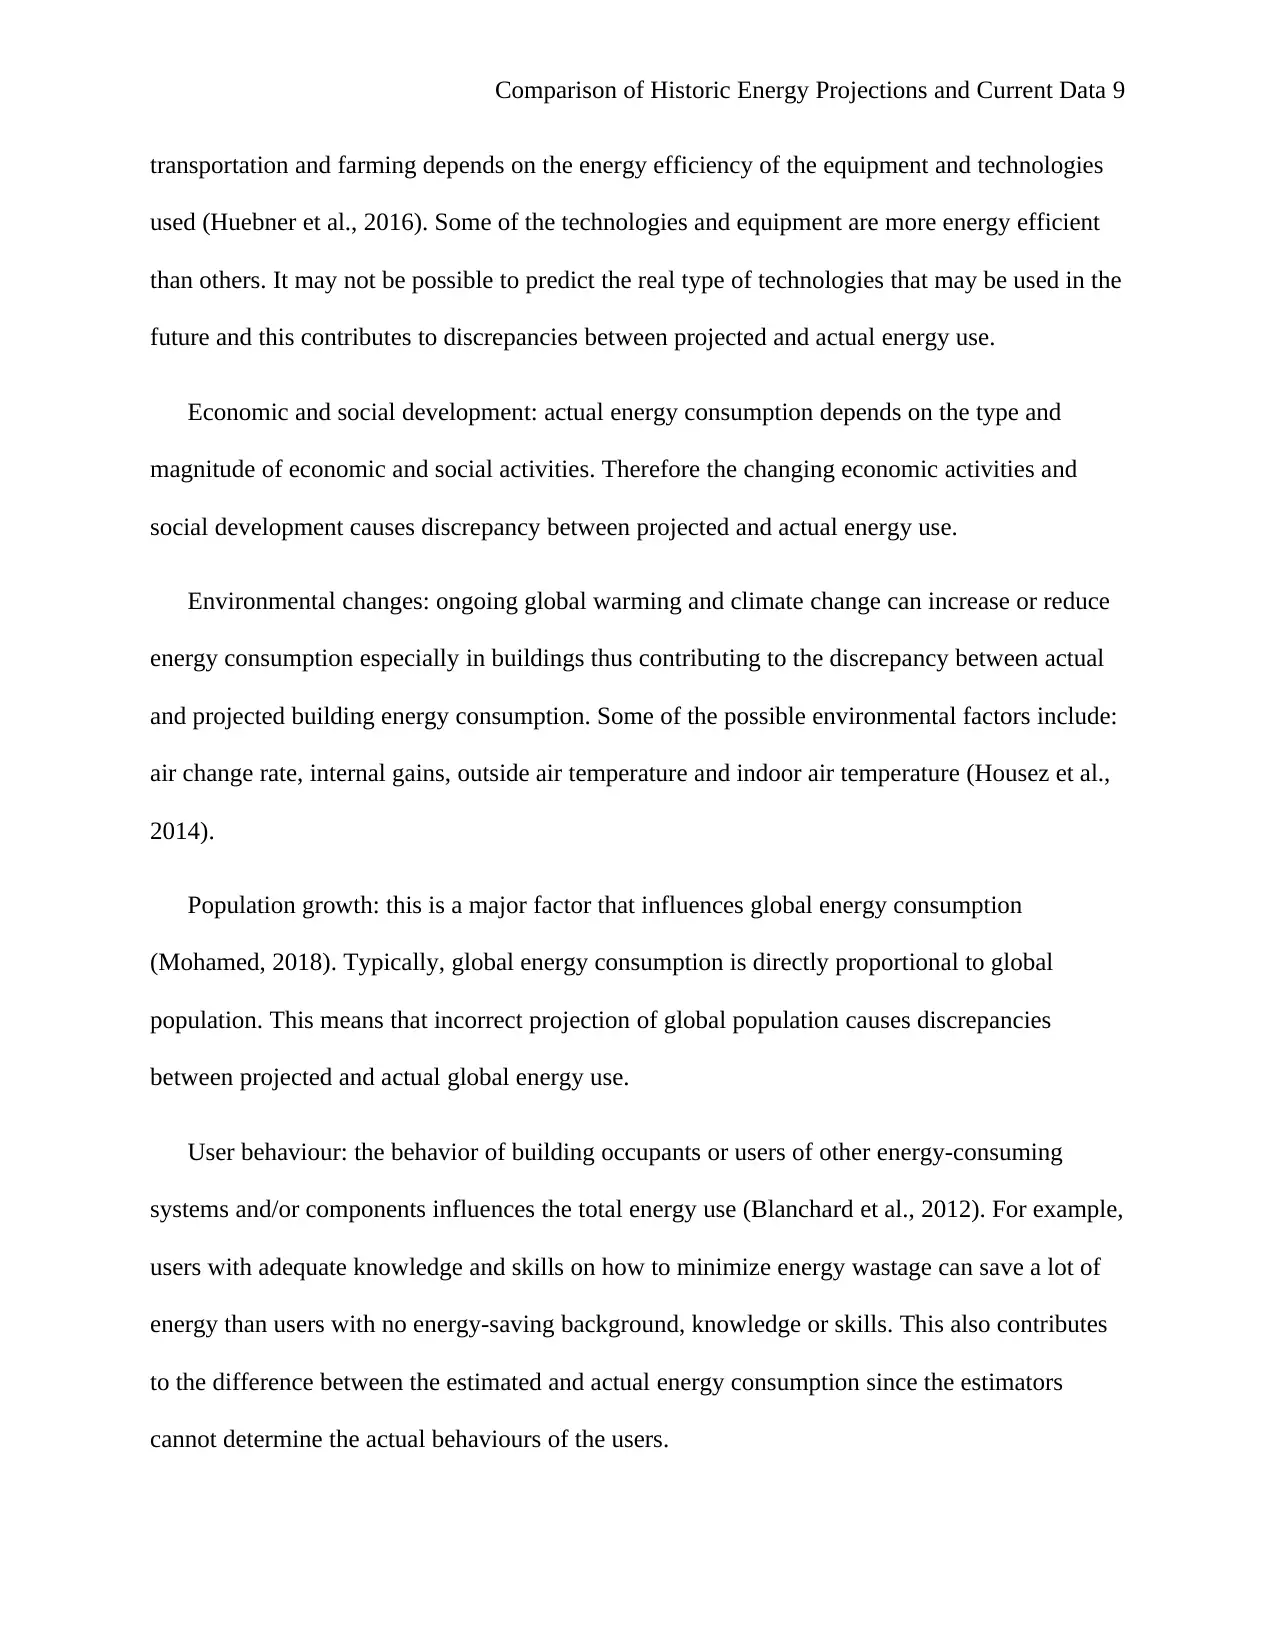
transportation and farming depends on the energy efficiency of the equipment and technologies
used (Huebner et al., 2016). Some of the technologies and equipment are more energy efficient
than others. It may not be possible to predict the real type of technologies that may be used in the
future and this contributes to discrepancies between projected and actual energy use.
Economic and social development: actual energy consumption depends on the type and
magnitude of economic and social activities. Therefore the changing economic activities and
social development causes discrepancy between projected and actual energy use.
Environmental changes: ongoing global warming and climate change can increase or reduce
energy consumption especially in buildings thus contributing to the discrepancy between actual
and projected building energy consumption. Some of the possible environmental factors include:
air change rate, internal gains, outside air temperature and indoor air temperature (Housez et al.,
2014).
Population growth: this is a major factor that influences global energy consumption
(Mohamed, 2018). Typically, global energy consumption is directly proportional to global
population. This means that incorrect projection of global population causes discrepancies
between projected and actual global energy use.
User behaviour: the behavior of building occupants or users of other energy-consuming
systems and/or components influences the total energy use (Blanchard et al., 2012). For example,
users with adequate knowledge and skills on how to minimize energy wastage can save a lot of
energy than users with no energy-saving background, knowledge or skills. This also contributes
to the difference between the estimated and actual energy consumption since the estimators
cannot determine the actual behaviours of the users.
⊘ This is a preview!⊘
Do you want full access?
Subscribe today to unlock all pages.
Trusted by 1+ million students worldwide
Comparison of Historic Energy Projections and Current Data 10
Type of assumptions and variables used: energy use projections are made using a wide range
of variables and assumptions. The type and number of these variables and assumptions used in
the energy modelling systems also contribute to the discrepancy between projected and actual
energy use.
4. How the differences between energy use projections and actual energy use affect
future energy market projections
The differences between energy use projections and actual energy use affect future energy
market projections because they provide relevant stakeholders with essential knowledge and
strategies of improving their projections. This include integrating more relevant variables and
make improved assumptions when making global energy use projections.
5. Conclusions
Global energy consumption has been on the rise for decades and is projected to continue
increasing in the future. As a result, governments rely on energy consumption projections to
develop strategies of meeting future energy demand. These projections are also used to make
investments decisions that will increase renewable energy supply so as to reduce greenhouse gas
emissions from the energy sector. However, differences between anticipated and actual energy
consumption are inevitable. From the set of four years analyzed in this report, the discrepancy
between projected and actual global energy consumption ranged between 18.4% and 27.9%.
Some of the factors that have been found to contribute to the difference between anticipated and
actual energy consumption include: population growth, environmental changes, technological
development, economic and social development, user behavior, and type of variables and
assumptions made. Information about these discrepancies can be used to improve energy
Paraphrase This Document
Need a fresh take? Get an instant paraphrase of this document with our AI Paraphraser
Comparison of Historic Energy Projections and Current Data 11
modelling systems. As a result, it will be easier and cost effective to meet the future global
energy demand.
References
Blanchard, J., Widdr, S., Giever, E. & Baechler, M., 2012.
Actual and Estimated Energy Savings
Comparison for Deep Energy Retrofits in the Pacific Northwest, Washington, D.C.: U.S. Department of
Energy.
Housez, P., Pont, U. & Mahdavi, A., 2014. A comparison of projected and actual energy performance of
buildings after thermal retrofit measures.
Journal of Building Physics, 38(2), pp. 138-155.
Huebner, G., Shipworth, D., Hamilton, I., Chalabi, Z. & Oreszczyn, T., 2016. Understanding electricity
consumption: A comparative contribution of building factors, socio-demographics, appliances,
behaviours and attitudes.
Applied Energy, 177(1), pp. 692-702.
Ion, D., 1979. World energy supplies.
Proceedings of the Geologists' Association, 90(4), pp. 193-202.
Li, M., 2017.
World Energy 2017-2050: Annual Report, Salt Lake City, UT: University of Utah.
Mohamed, Z., 2018.
Comparison of historic energy projections and current data, Leicester, UK: De
Montfort University.
Owusu, P. & Asumadu-Sarkodie, S., 2016. A review of renewable energy sources, sustainability issues
and climate change mitigation.
Cogent Engineering, 3(1), pp. 1-15.
Polly, B., Kruis, N. & Roberts, D., 2011.
Assessing and Improving the Accuracy of Energy Analysis for
Residential Buildings, Washington, D.C.: U.S. Department of Energy.
U.S. Energy Information Administration, 2017.
EIA projects 28% increase in world energy use by 2040.
[Online]
Available at: https://www.eia.gov/todayinenergy/detail.php?id=32912
[Accessed 29 June 2019].
1 out of 11
Related Documents


Your All-in-One AI-Powered Toolkit for Academic Success.
+13062052269
info@desklib.com
Available 24*7 on WhatsApp / Email
![[object Object]](/_next/static/media/star-bottom.7253800d.svg)
Unlock your academic potential
Copyright © 2020–2026 A2Z Services. All Rights Reserved. Developed and managed by ZUCOL.