ENG790s2 Energy Systems Lab 1: Solar Collector Experiment Report
VerifiedAdded on 2022/08/29
|22
|3257
|85
Report
AI Summary
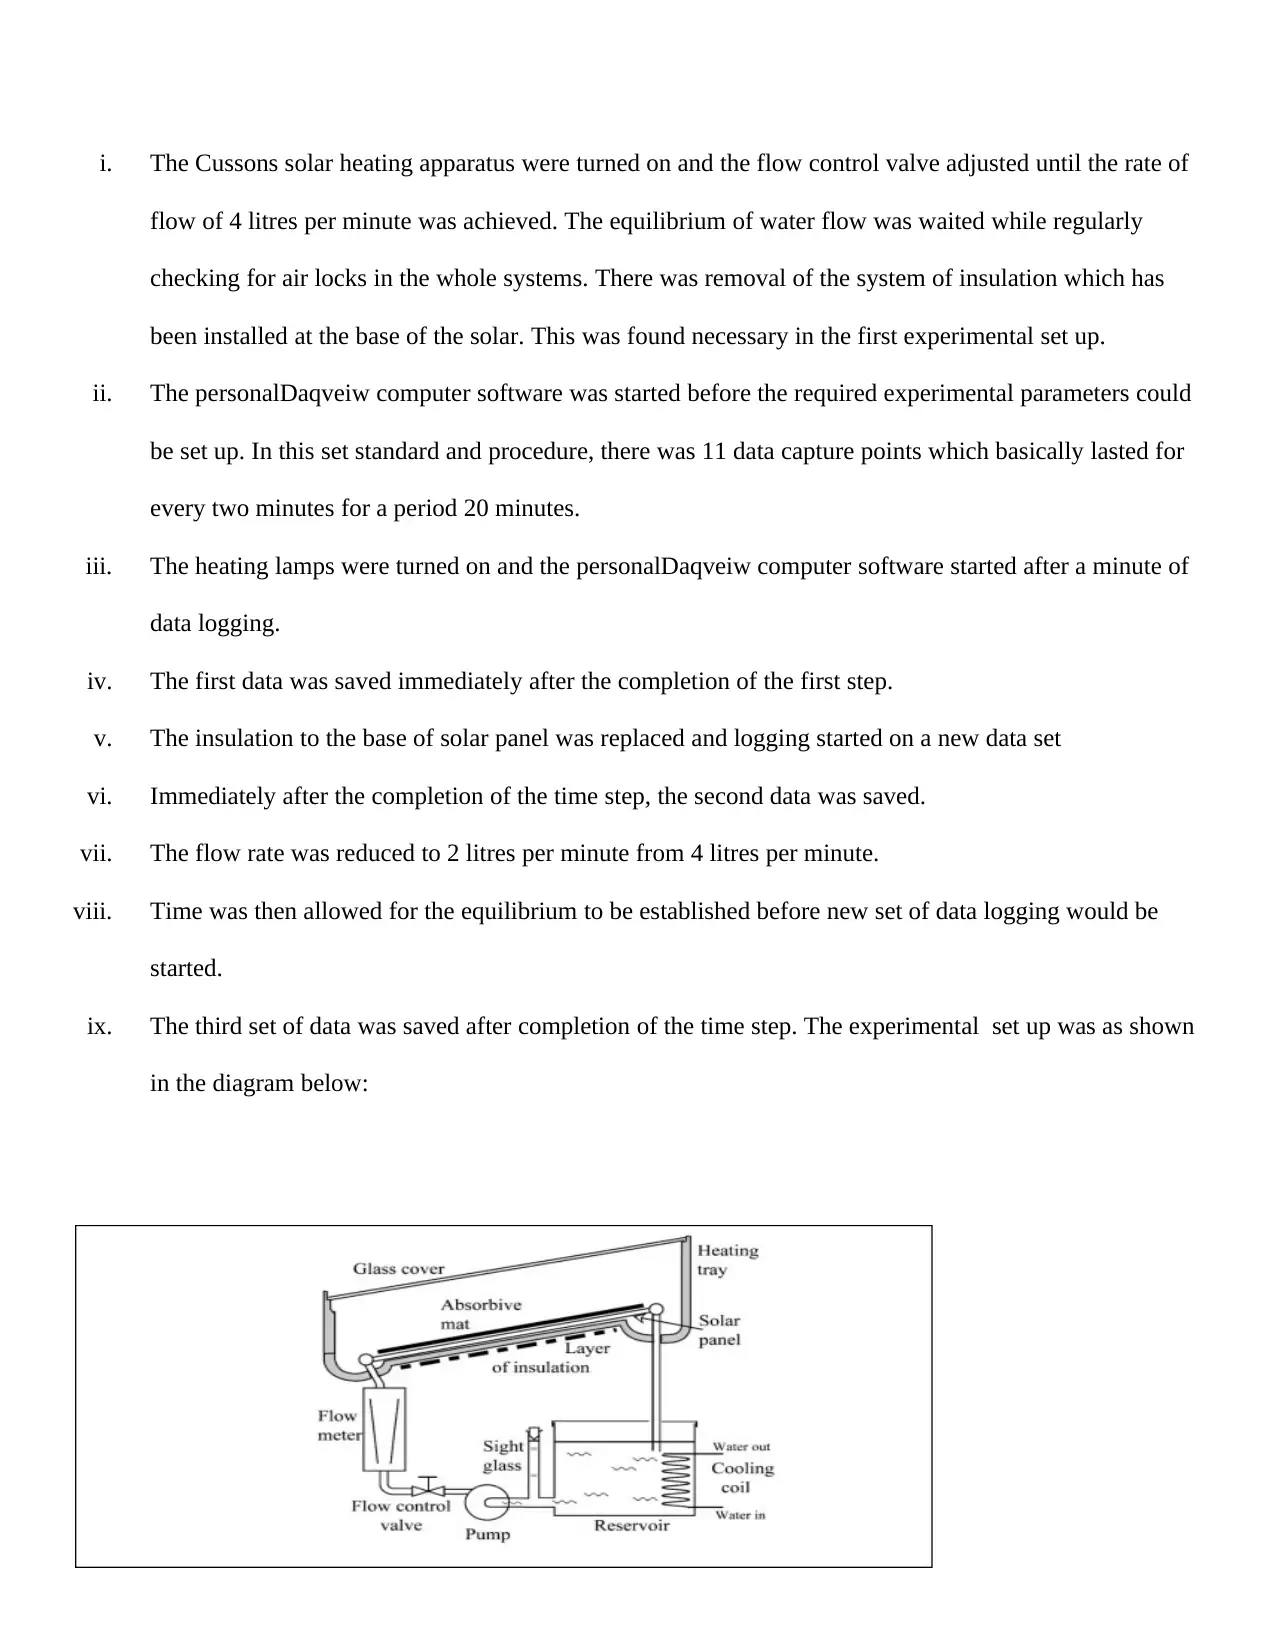
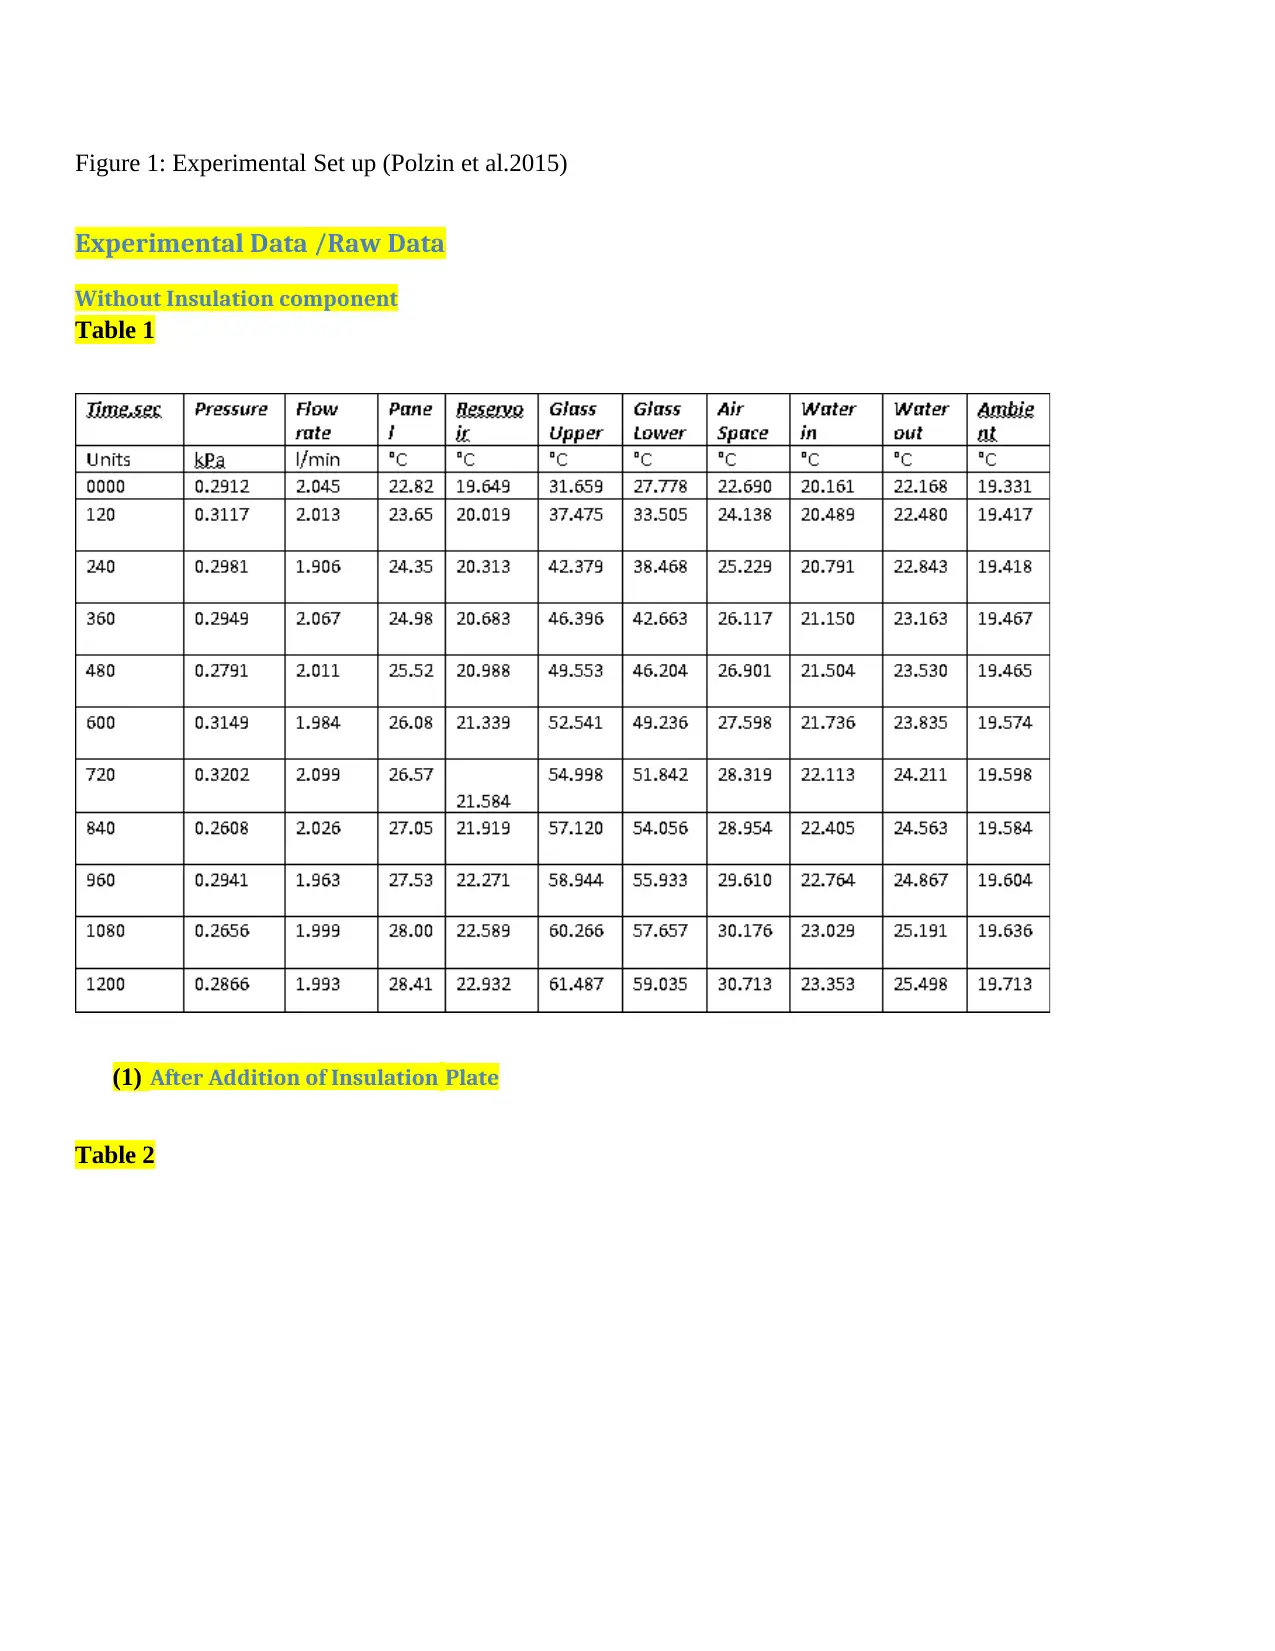
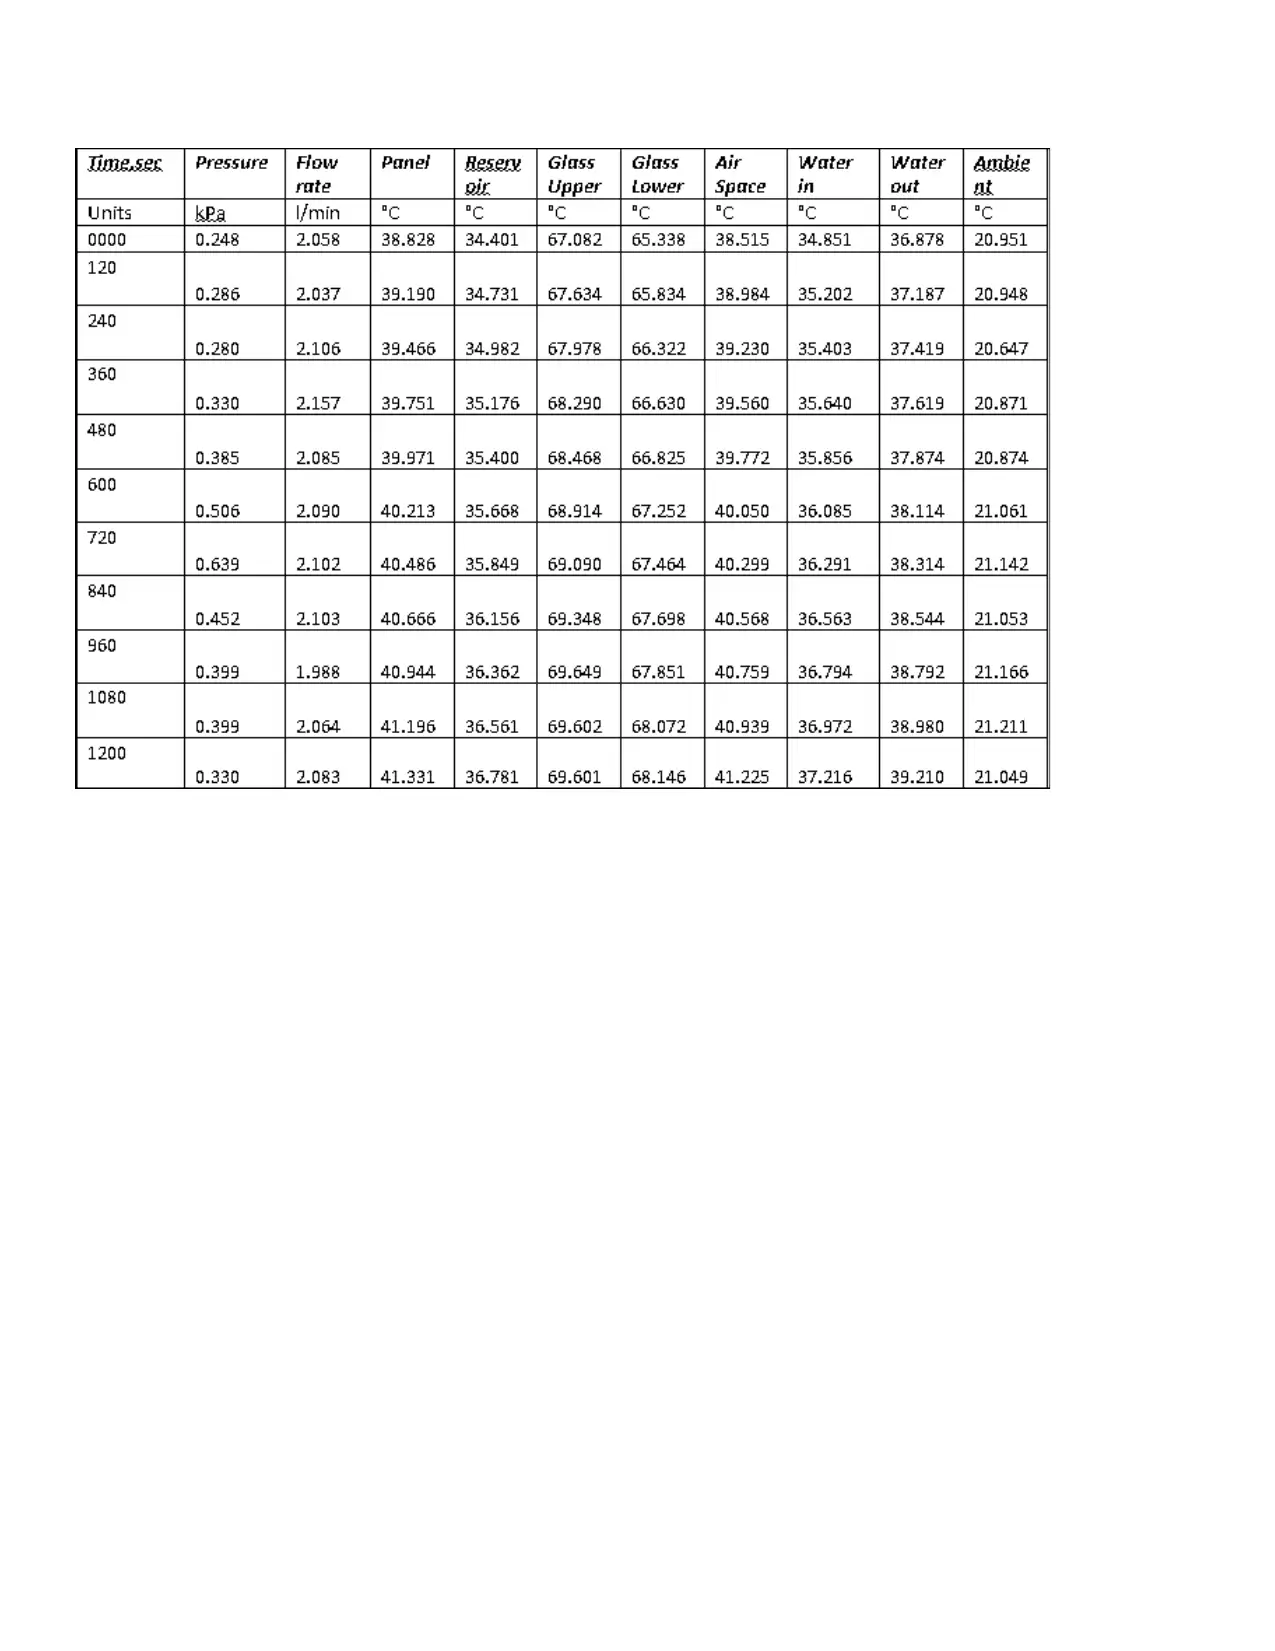
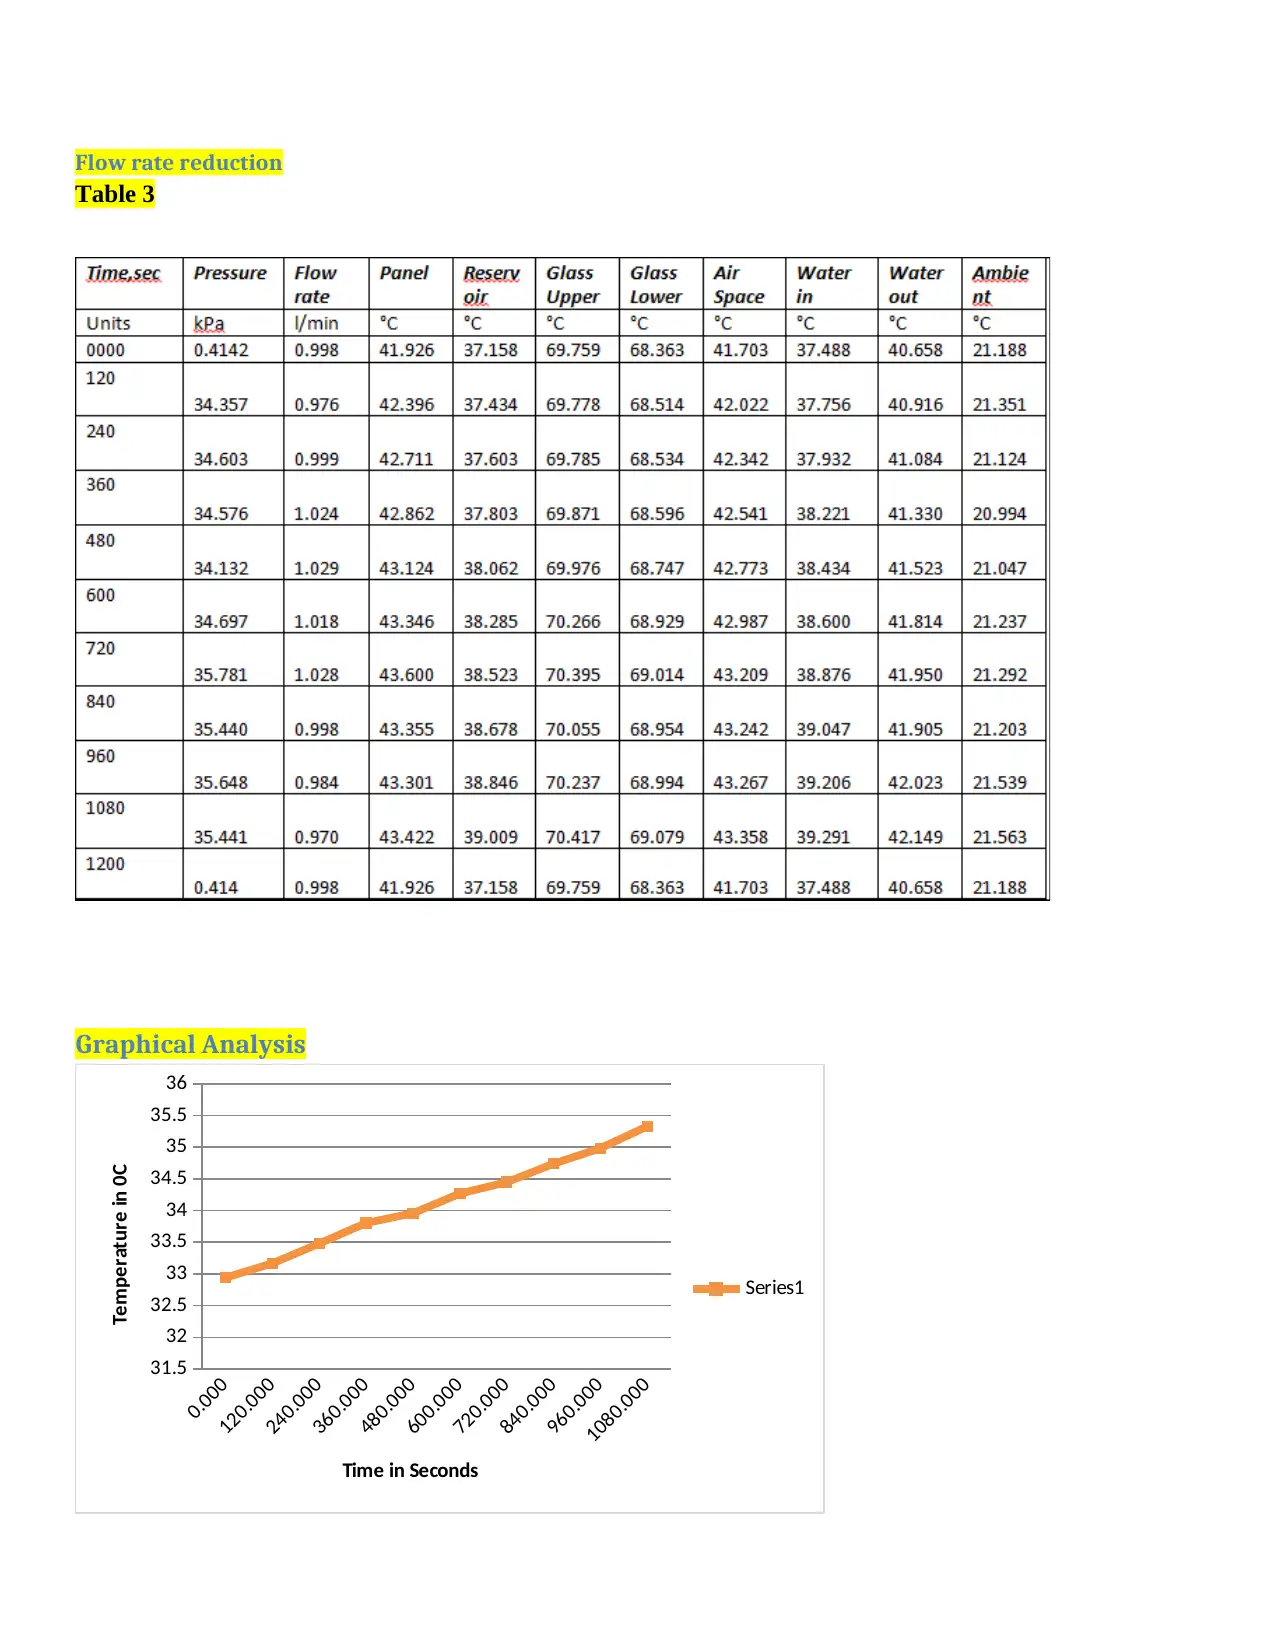
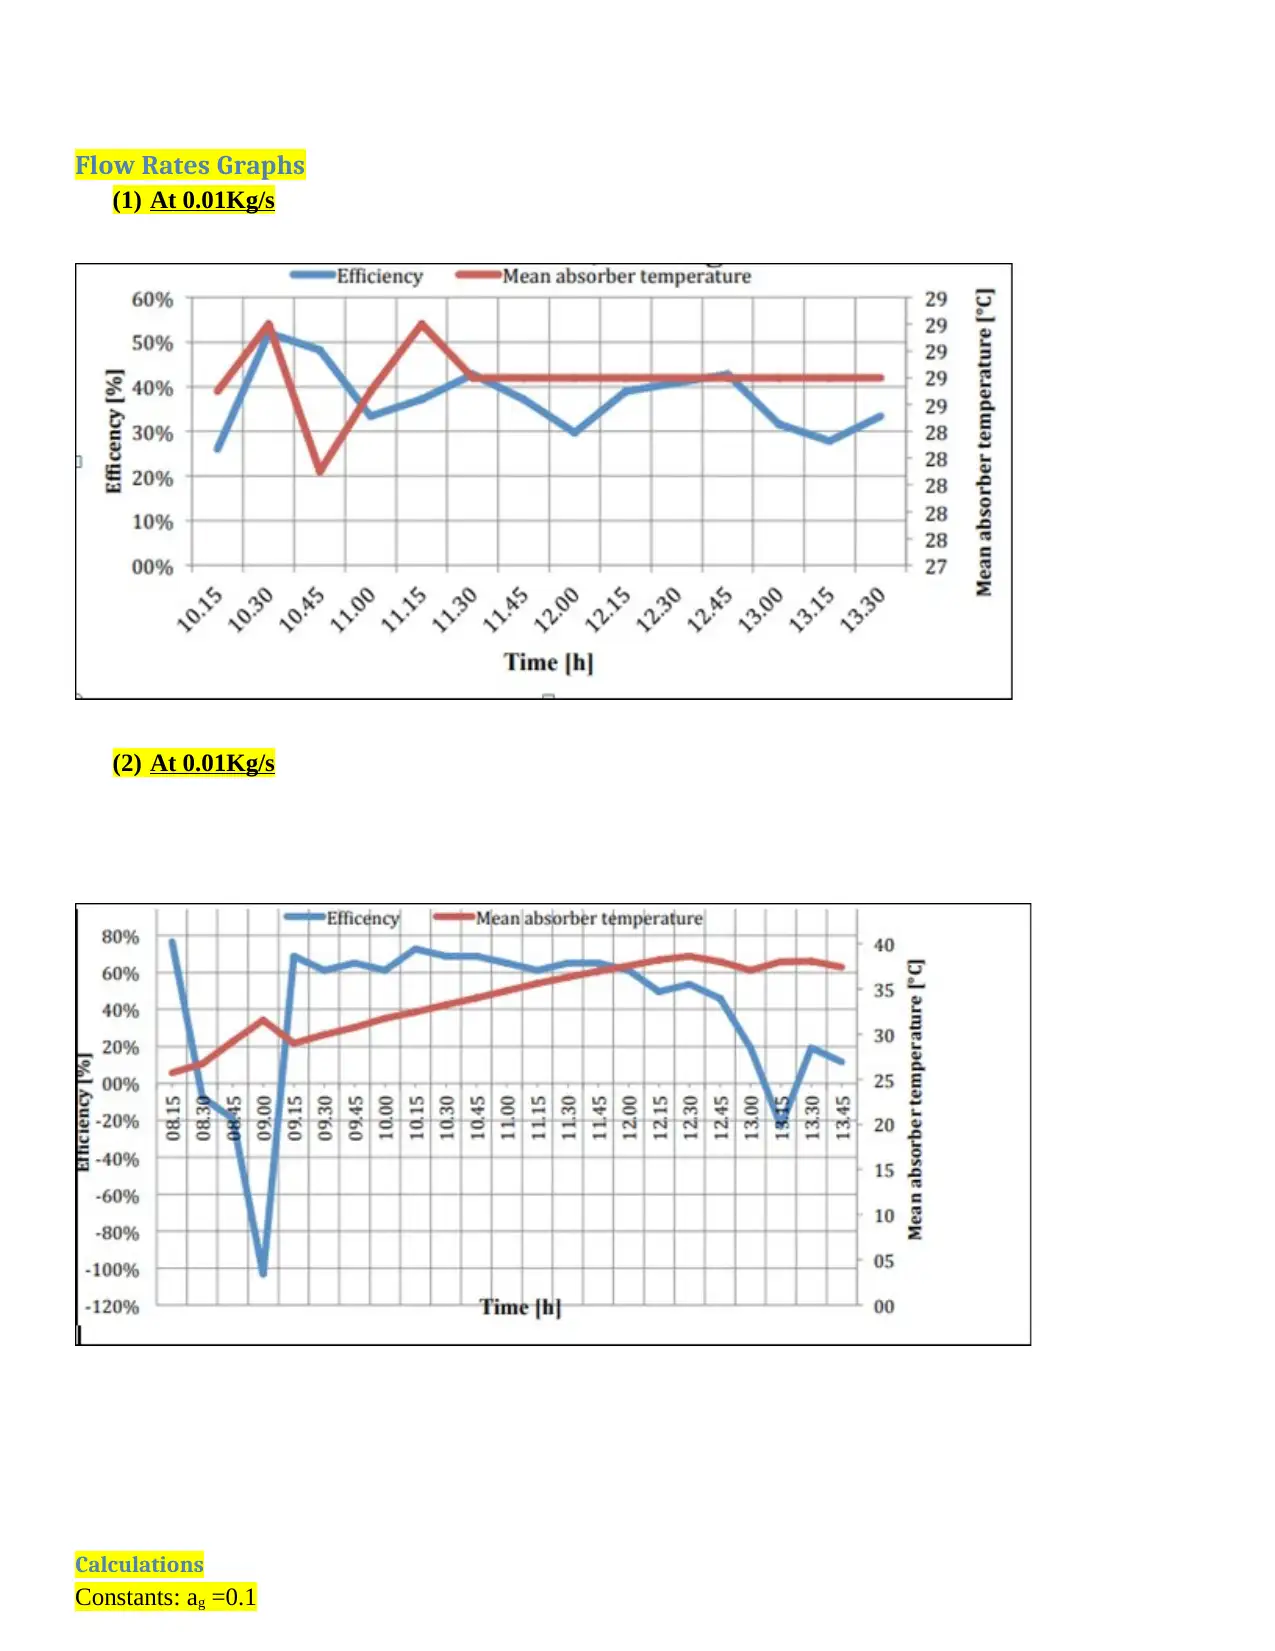
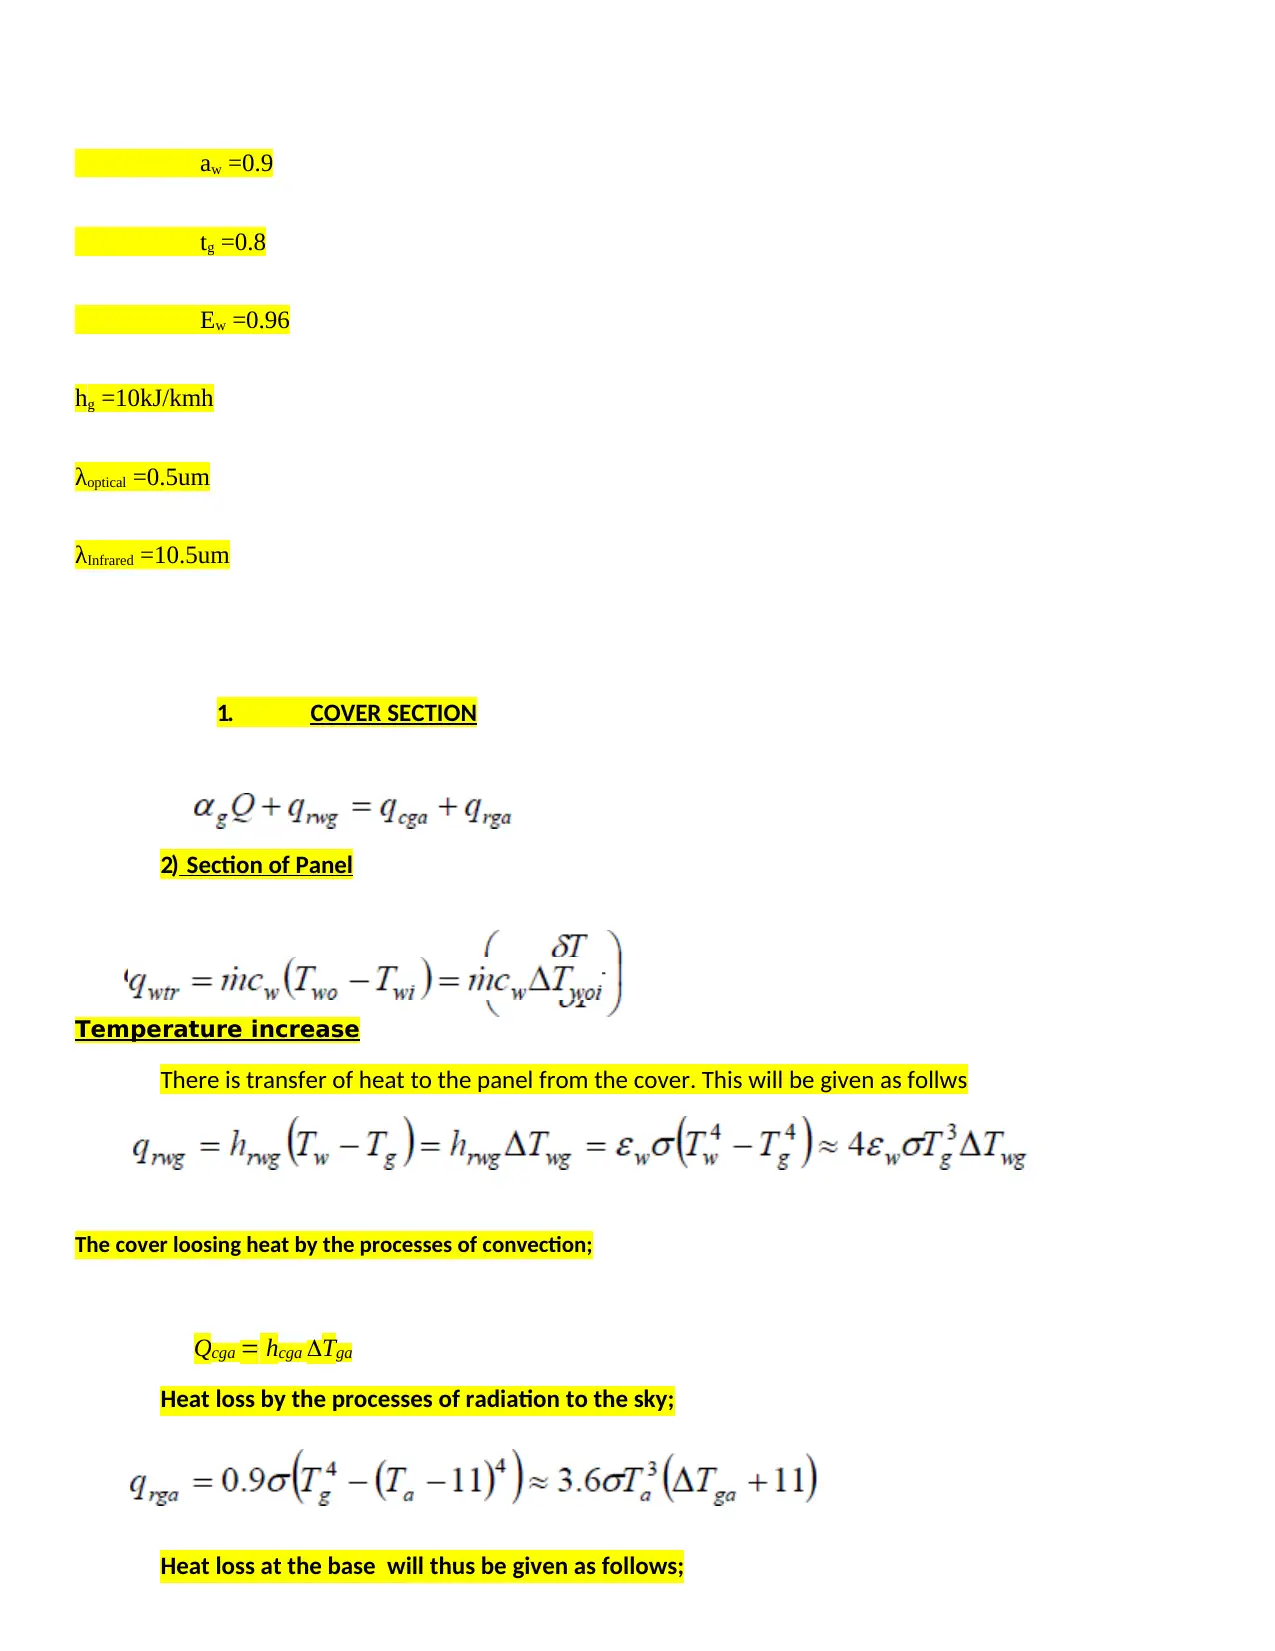
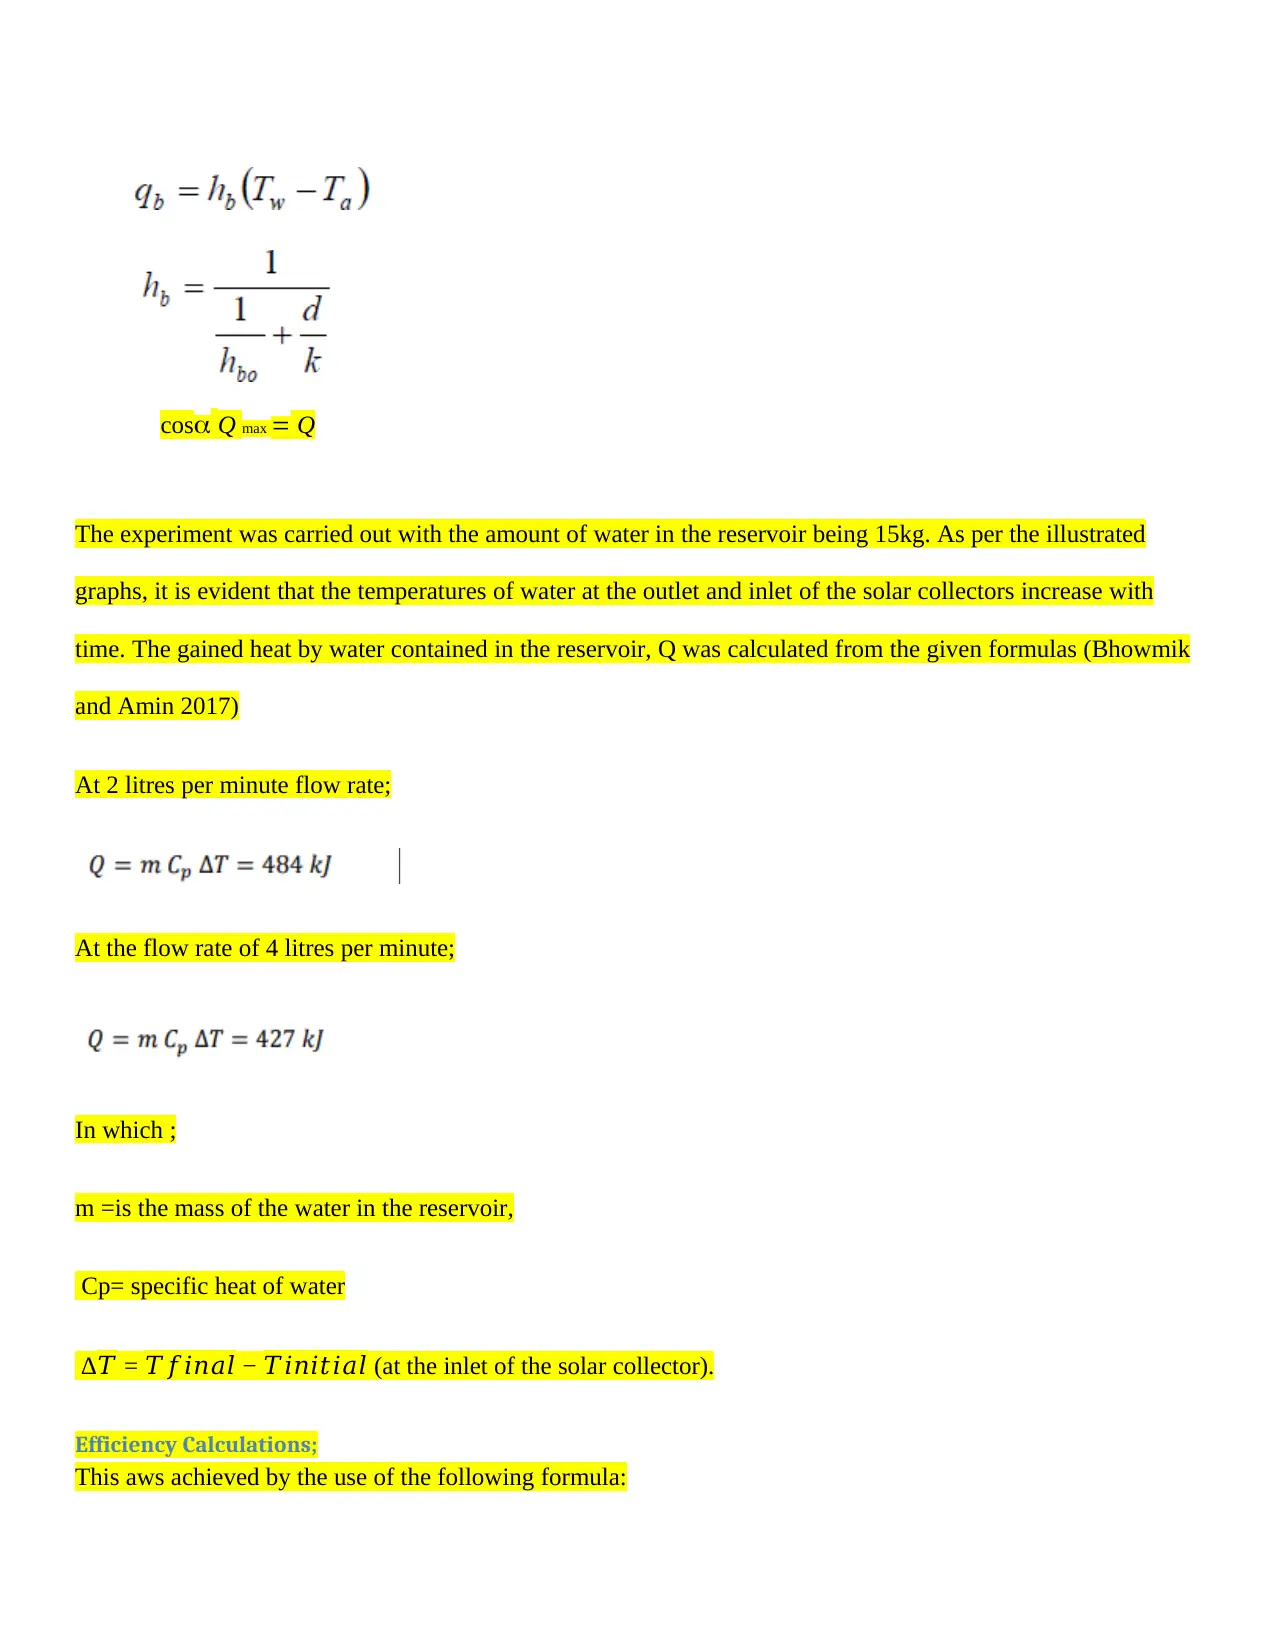
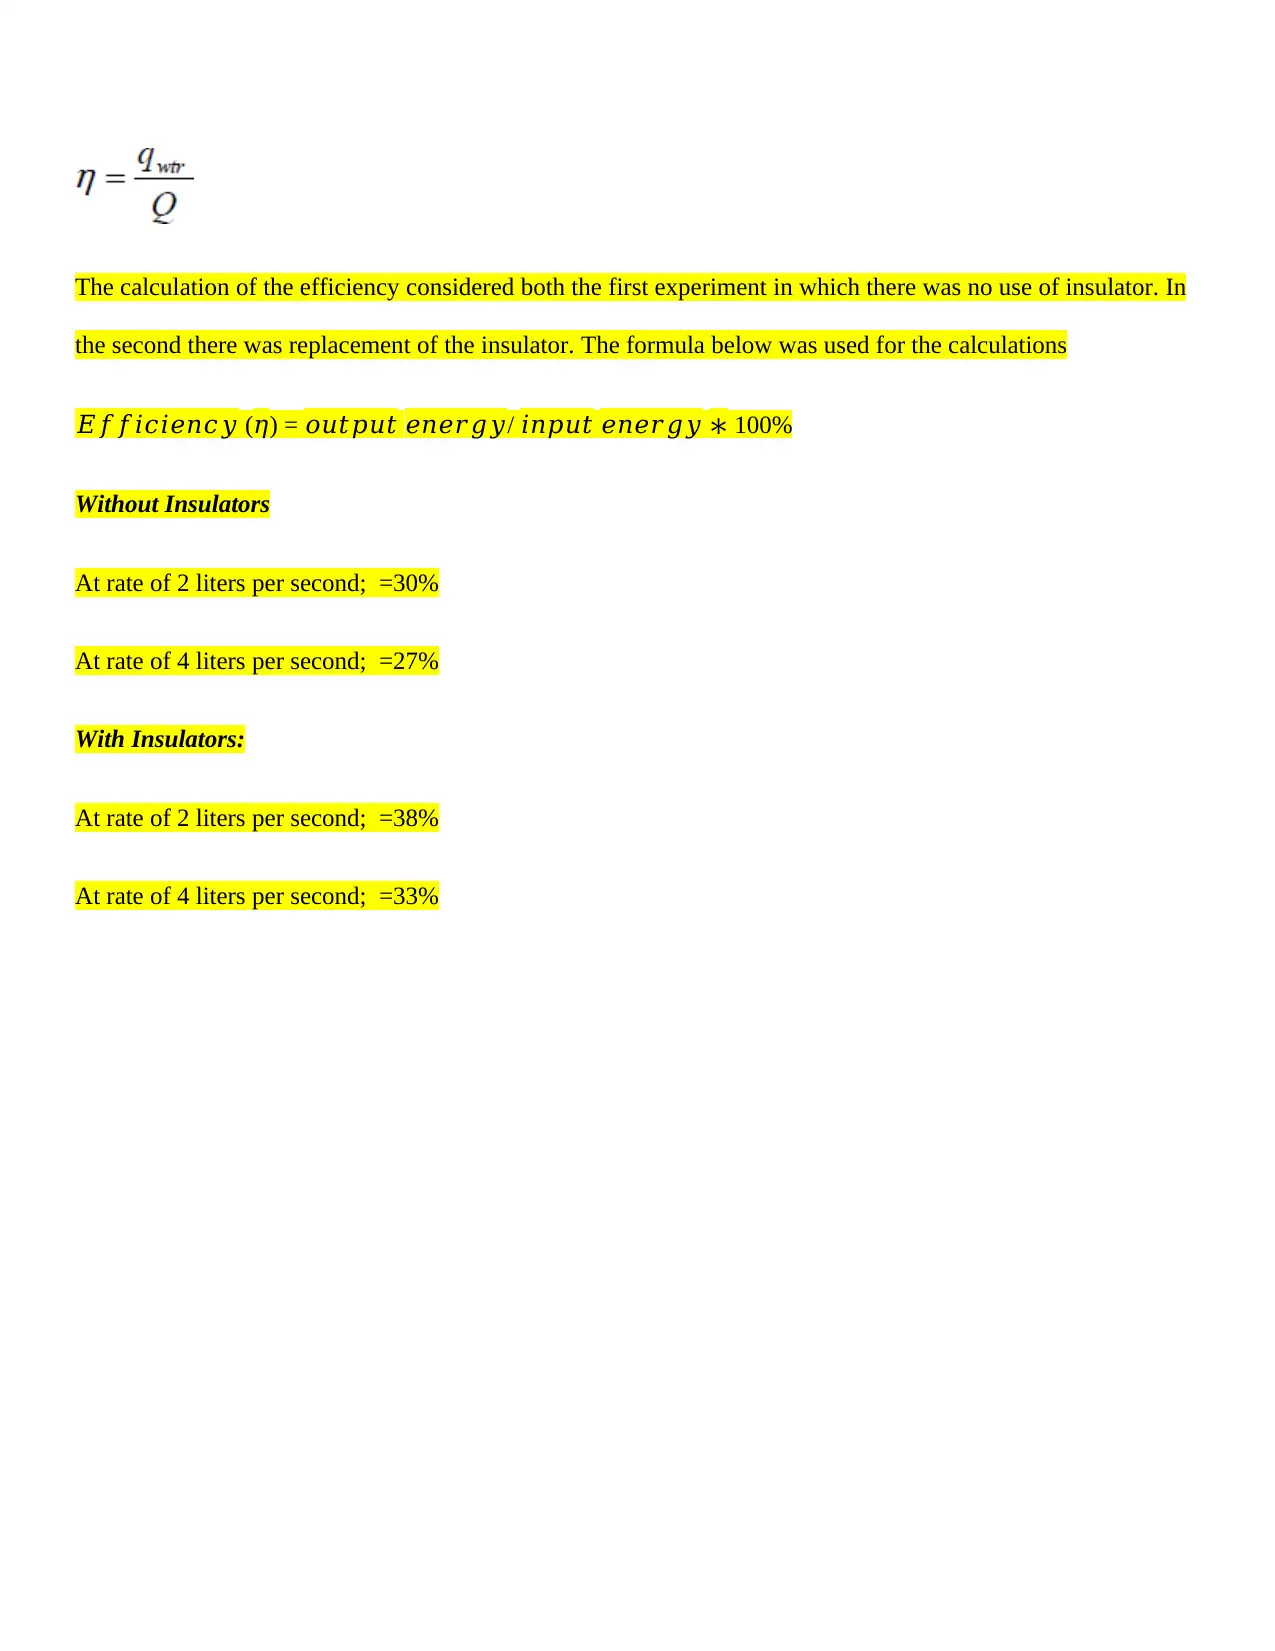
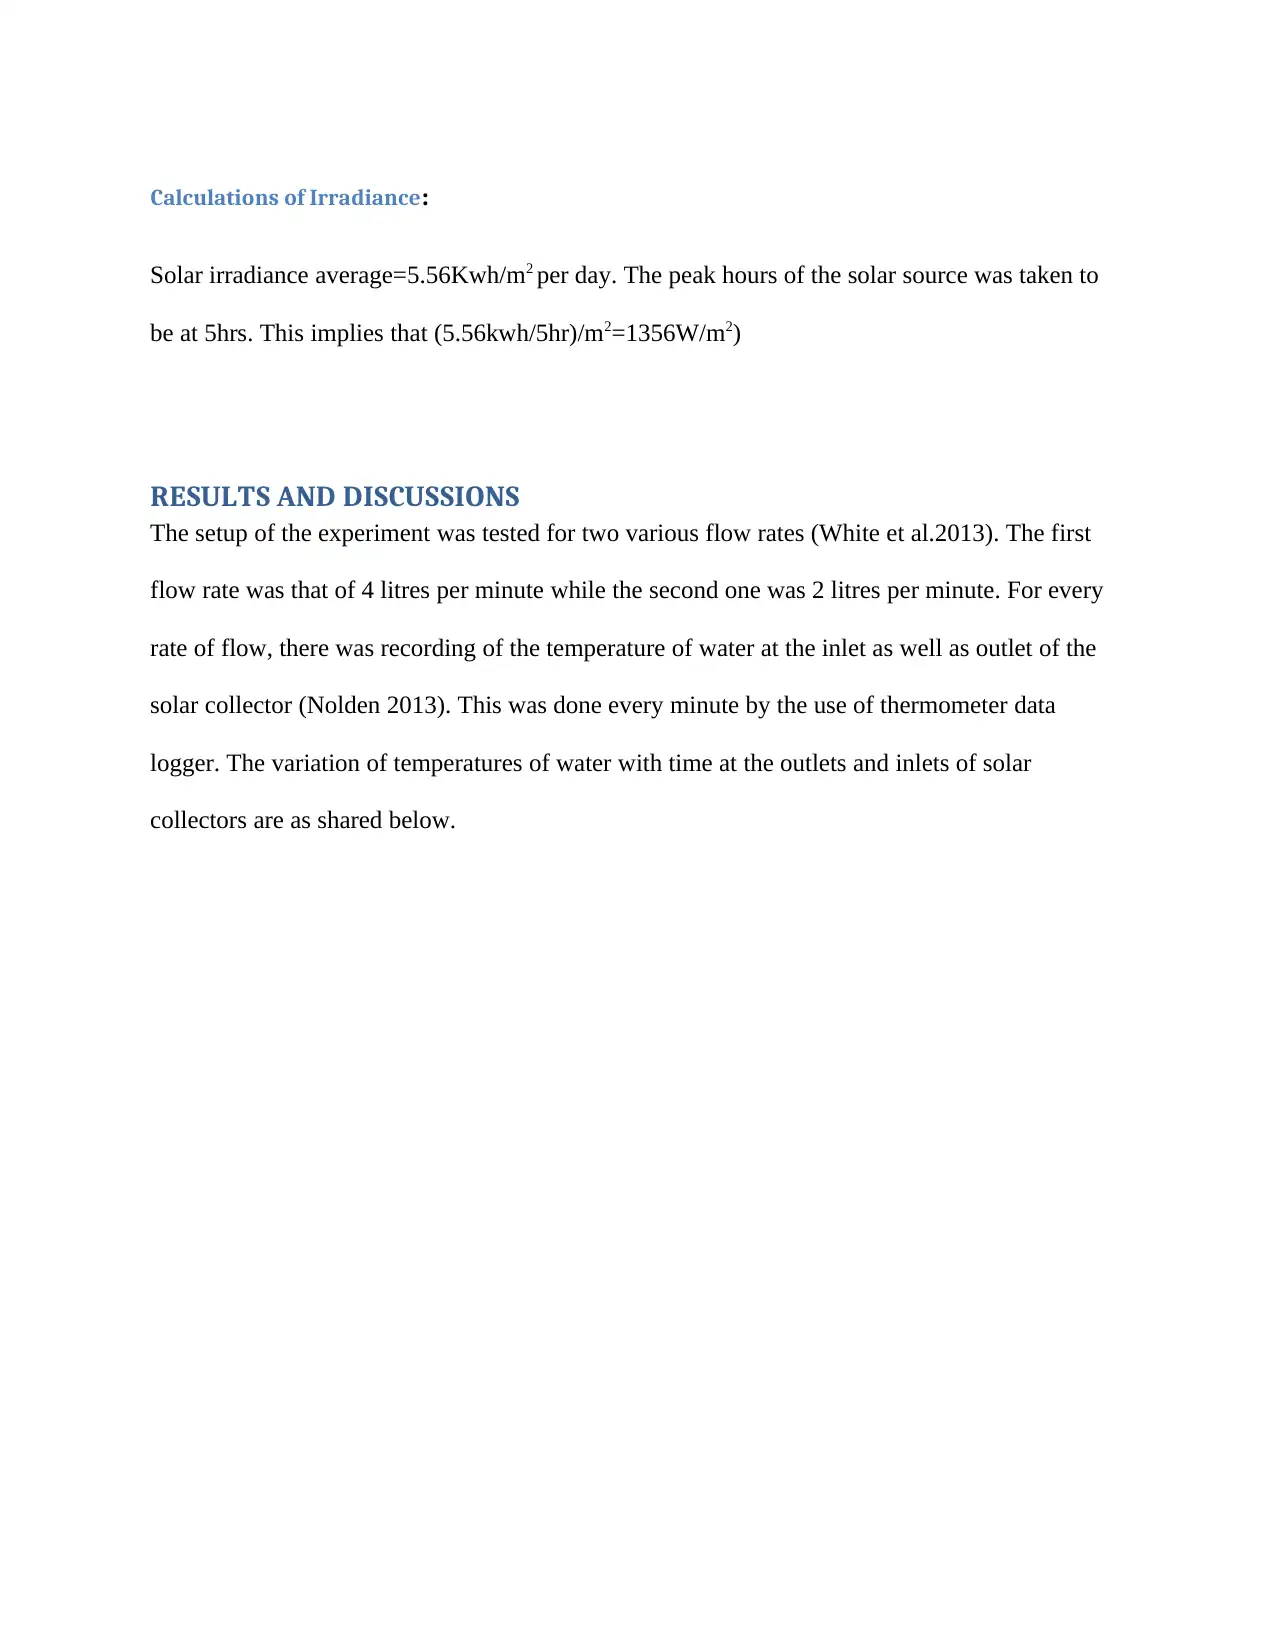
This report details a laboratory experiment on a solar collector, conducted using a Cussons P1740 solar heating apparatus. The experiment aimed to demonstrate the principle of solar energy collection and analyze its efficiency. The methodology involved setting up the apparatus, varying water flow rates, and collecting data on temperatures at the inlet and outlet of the collector with and without insulation. The report includes raw experimental data, graphical analysis of flow rates, and calculations of efficiency and irradiance. Results and discussions highlight the impact of mass flow rate and global irradiance on the collector's performance, along with error analysis. The study found that higher mass flow rates and the presence of insulation increased efficiency. The report concludes with recommendations for improving solar collection methods and provides a comparison between experimental and theoretical results. The report also includes an in-depth analysis of errors, including those related to global irradiance and mass flow rates, and their effect on the overall outcome.

ENERGY SYSTEMS LAB 1
By Name
Course
Instructor
Institution
Location
Date
By Name
Course
Instructor
Institution
Location
Date
Paraphrase This Document
Need a fresh take? Get an instant paraphrase of this document with our AI Paraphraser

Contents
INTRODUCTION..................................................................................................................................................................... 2
AIM/OBJECTIVES...................................................................................................................................................................2
METHODOLOGY....................................................................................................................................................................2
Experimental Data /Raw Data...........................................................................................................................................3
Without Insulation component.....................................................................................................................................3
(1) After Addition of Insulation...............................................................................................................................4
Flow rate reduction.......................................................................................................................................................6
Graphical Analysis.............................................................................................................................................................6
Flow Rates Graphs.............................................................................................................................................................7
Calculations...................................................................................................................................................................8
Efficiency Calculations;..................................................................................................................................................9
Calculations of Irradiance............................................................................................................................................11
RESULTS AND DISCUSSIONS................................................................................................................................................11
Error Analysis..............................................................................................................................................................14
Error in the global irradiance/ Reasons for difference between theoretical and experimental results.......................14
Error Analysis in the case of mass flow rates/ Reasons for difference between theoretical and experimental results
.................................................................................................................................................................................... 15
Comparison of experimental results and theoretical results.......................................................................................17
Effective method for solar collection...........................................................................................................................17
CONCLUSIONS AND RECOMMENDATIONS.........................................................................................................................18
REFERENCES........................................................................................................................................................................ 19

INTRODUCTION
Considering that there are limited resources of fossil fuels and environmental issues, the world has begun giving
more attention to the renewable sources of energy. The solar radiation energy has been regarded as one of such
renewable sources. The concept of tapping solar energy has been utilized in very many areas including water
heating in the case of swimming pools, general hot water systems as well as support to the sources of energy in
the case of central heating installations. In such kind of set ups, the solar radiation energy are converted into
heat energy by the use of solar panels (Delfani, Karami and Akhavan 2016).
It is important to note that the use of solar energy in heating of water is basically not a new idea at all. Such
kind of the wide use as well as simplicity of solar collectors makes the entire idea a noble concept worth
studying. In such kinds of the heating systems, solar collectors have been regarded as the main components
actively involved in the solar-heating systems. The solar collectors will always serve to assist in gathering of the
energy from the sun, have its radiations transformed into other forms (heat) before having the heat transferred to
the fluid-preferably air or water.
AIM/OBJECTIVES
The primary objective of this experiment work was to demonstrate the solar energy collection principle.
METHODOLOGY
Experimental Procedure
⊘ This is a preview!⊘
Do you want full access?
Subscribe today to unlock all pages.

Trusted by 1+ million students worldwide

i. The Cussons solar heating apparatus were turned on and the flow control valve adjusted until the rate of
flow of 4 litres per minute was achieved. The equilibrium of water flow was waited while regularly
checking for air locks in the whole systems. There was removal of the system of insulation which has
been installed at the base of the solar. This was found necessary in the first experimental set up.
ii. The personalDaqveiw computer software was started before the required experimental parameters could
be set up. In this set standard and procedure, there was 11 data capture points which basically lasted for
every two minutes for a period 20 minutes.
iii. The heating lamps were turned on and the personalDaqveiw computer software started after a minute of
data logging.
iv. The first data was saved immediately after the completion of the first step.
v. The insulation to the base of solar panel was replaced and logging started on a new data set
vi. Immediately after the completion of the time step, the second data was saved.
vii. The flow rate was reduced to 2 litres per minute from 4 litres per minute.
viii. Time was then allowed for the equilibrium to be established before new set of data logging would be
started.
ix. The third set of data was saved after completion of the time step. The experimental set up was as shown
in the diagram below:
Paraphrase This Document
Need a fresh take? Get an instant paraphrase of this document with our AI Paraphraser

Figure 1: Experimental Set up (Polzin et al.2015)
Experimental Data /Raw Data
Without Insulation component
Table 1
(1) After Addition of Insulation Plate
Table 2
Experimental Data /Raw Data
Without Insulation component
Table 1
(1) After Addition of Insulation Plate
Table 2

⊘ This is a preview!⊘
Do you want full access?
Subscribe today to unlock all pages.

Trusted by 1+ million students worldwide

Flow rate reduction
Table 3
Graphical Analysis
0.000
120.000
240.000
360.000
480.000
600.000
720.000
840.000
960.000
1080.000
31.5
32
32.5
33
33.5
34
34.5
35
35.5
36
Series1
Time in Seconds
Temperature in 0C
Table 3
Graphical Analysis
0.000
120.000
240.000
360.000
480.000
600.000
720.000
840.000
960.000
1080.000
31.5
32
32.5
33
33.5
34
34.5
35
35.5
36
Series1
Time in Seconds
Temperature in 0C
Paraphrase This Document
Need a fresh take? Get an instant paraphrase of this document with our AI Paraphraser

Flow Rates Graphs
(1) At 0.01Kg/s
(2) At 0.01Kg/s
Calculations
Constants: ag =0.1
(1) At 0.01Kg/s
(2) At 0.01Kg/s
Calculations
Constants: ag =0.1

aw =0.9
tg =0.8
Ew =0.96
hg =10kJ/kmh
λoptical =0.5um
λInfrared =10.5um
1. COVER SECTION
2) Section of Panel
Temperature increase
There is transfer of heat to the panel from the cover. This will be given as follws
The cover loosing heat by the processes of convection;
Qcga hcga Tga
Heat loss by the processes of radiation to the sky;
Heat loss at the base will thus be given as follows;
⊘ This is a preview!⊘
Do you want full access?
Subscribe today to unlock all pages.

Trusted by 1+ million students worldwide

cos Q max Q
The experiment was carried out with the amount of water in the reservoir being 15kg. As per the illustrated
graphs, it is evident that the temperatures of water at the outlet and inlet of the solar collectors increase with
time. The gained heat by water contained in the reservoir, Q was calculated from the given formulas (Bhowmik
and Amin 2017)
At 2 litres per minute flow rate;
At the flow rate of 4 litres per minute;
In which ;
m =is the mass of the water in the reservoir,
Cp= specific heat of water
∆𝑇 = 𝑇𝑓𝑖𝑛𝑎𝑙 − 𝑇𝑖𝑛𝑖𝑡𝑖𝑎𝑙 (at the inlet of the solar collector).
Efficiency Calculations;
This aws achieved by the use of the following formula:
Paraphrase This Document
Need a fresh take? Get an instant paraphrase of this document with our AI Paraphraser

The calculation of the efficiency considered both the first experiment in which there was no use of insulator. In
the second there was replacement of the insulator. The formula below was used for the calculations
𝐸𝑓𝑓𝑖𝑐𝑖𝑒𝑛𝑐𝑦 (𝜂) = 𝑜𝑢𝑡𝑝𝑢𝑡 𝑒𝑛𝑒𝑟𝑔𝑦/ 𝑖𝑛𝑝𝑢𝑡 𝑒𝑛𝑒𝑟𝑔𝑦 ∗ 100%
Without Insulators
At rate of 2 liters per second; =30%
At rate of 4 liters per second; =27%
With Insulators:
At rate of 2 liters per second; =38%
At rate of 4 liters per second; =33%

Calculations of Irradiance:
Solar irradiance average=5.56Kwh/m2 per day. The peak hours of the solar source was taken to
be at 5hrs. This implies that (5.56kwh/5hr)/m2=1356W/m2)
RESULTS AND DISCUSSIONS
The setup of the experiment was tested for two various flow rates (White et al.2013). The first
flow rate was that of 4 litres per minute while the second one was 2 litres per minute. For every
rate of flow, there was recording of the temperature of water at the inlet as well as outlet of the
solar collector (Nolden 2013). This was done every minute by the use of thermometer data
logger. The variation of temperatures of water with time at the outlets and inlets of solar
collectors are as shared below.
⊘ This is a preview!⊘
Do you want full access?
Subscribe today to unlock all pages.

Trusted by 1+ million students worldwide
1 out of 22
Related Documents
Your All-in-One AI-Powered Toolkit for Academic Success.
+13062052269
info@desklib.com
Available 24*7 on WhatsApp / Email
Unlock your academic potential
Copyright © 2020–2026 A2Z Services. All Rights Reserved. Developed and managed by ZUCOL.


