Enero Group Limited Financial Analysis
VerifiedAdded on 2019/11/12
|24
|3495
|148
Report
AI Summary
This report provides a comprehensive financial analysis of Enero Group Limited, an Australian marketing and communication services company. The analysis covers the period from 2015 to 2017, utilizing data from the company's annual reports. The report begins with an introduction to Enero Group, its services, and its operations. It then delves into an analysis of the company's financial statements, including the statement of financial performance, statement of financial position, and statement of cash flows. A common-size analysis is performed to facilitate comparisons across the three years. The core of the report is a detailed ratio analysis, covering liquidity ratios, profitability ratios, solvency ratios, and market strength ratios. Each ratio is calculated, interpreted, and its trend over time is discussed. Finally, the report concludes with an overall assessment of Enero Group's financial performance, highlighting its strengths and weaknesses based on the analysis.

RUNNING HEAD: INTRODUCTION TO ACCOUNTING AND FINANCE
INTRODUCTION TO ACCOUNTING AND FINANCE
INTRODUCTION TO ACCOUNTING AND FINANCE
Paraphrase This Document
Need a fresh take? Get an instant paraphrase of this document with our AI Paraphraser
INTRODUCTION TO ACCOUNTING AND FINANCE 1
Contents
Enero Group Limited.............................................................................................................................2
Introduction.......................................................................................................................................2
Industry situation and company plans...............................................................................................2
Financial statement Analysis.............................................................................................................3
Ratio Analysis...................................................................................................................................10
Conclusion.......................................................................................................................................19
Bibliography.....................................................................................................................................20
INTRODUCTION TO ACCOUNTING AND FINANCE 2
Enero Group Limited
Introduction
Enero is a company providing joined services of marketing and communication. The
services include advertisement, media planning, research, public relations, direct marketing
and design and event management (Bloomberg, 2017)1. It mainly operates from Sydney,
London and New York, and many other locations (Enero, 2017)2. Enero group limited is
based in Pyrmont, New South Wales, Australia. The CEO of the company is Matthew
Melhuish. The most recent share price is A$ 1.04 (date 30.06.2017) and the dividend per
share is 5 cents (date 26.06.2017). Independent auditor of the company is KPMG. Their
opinion on the company’s financial statements is that Enero group limited has prepared its
financial statements for the year ended 30 June 2017 in accordance with Australian
Accounting standards and the Corporations Regulations 2001.
Industry situation and company plans
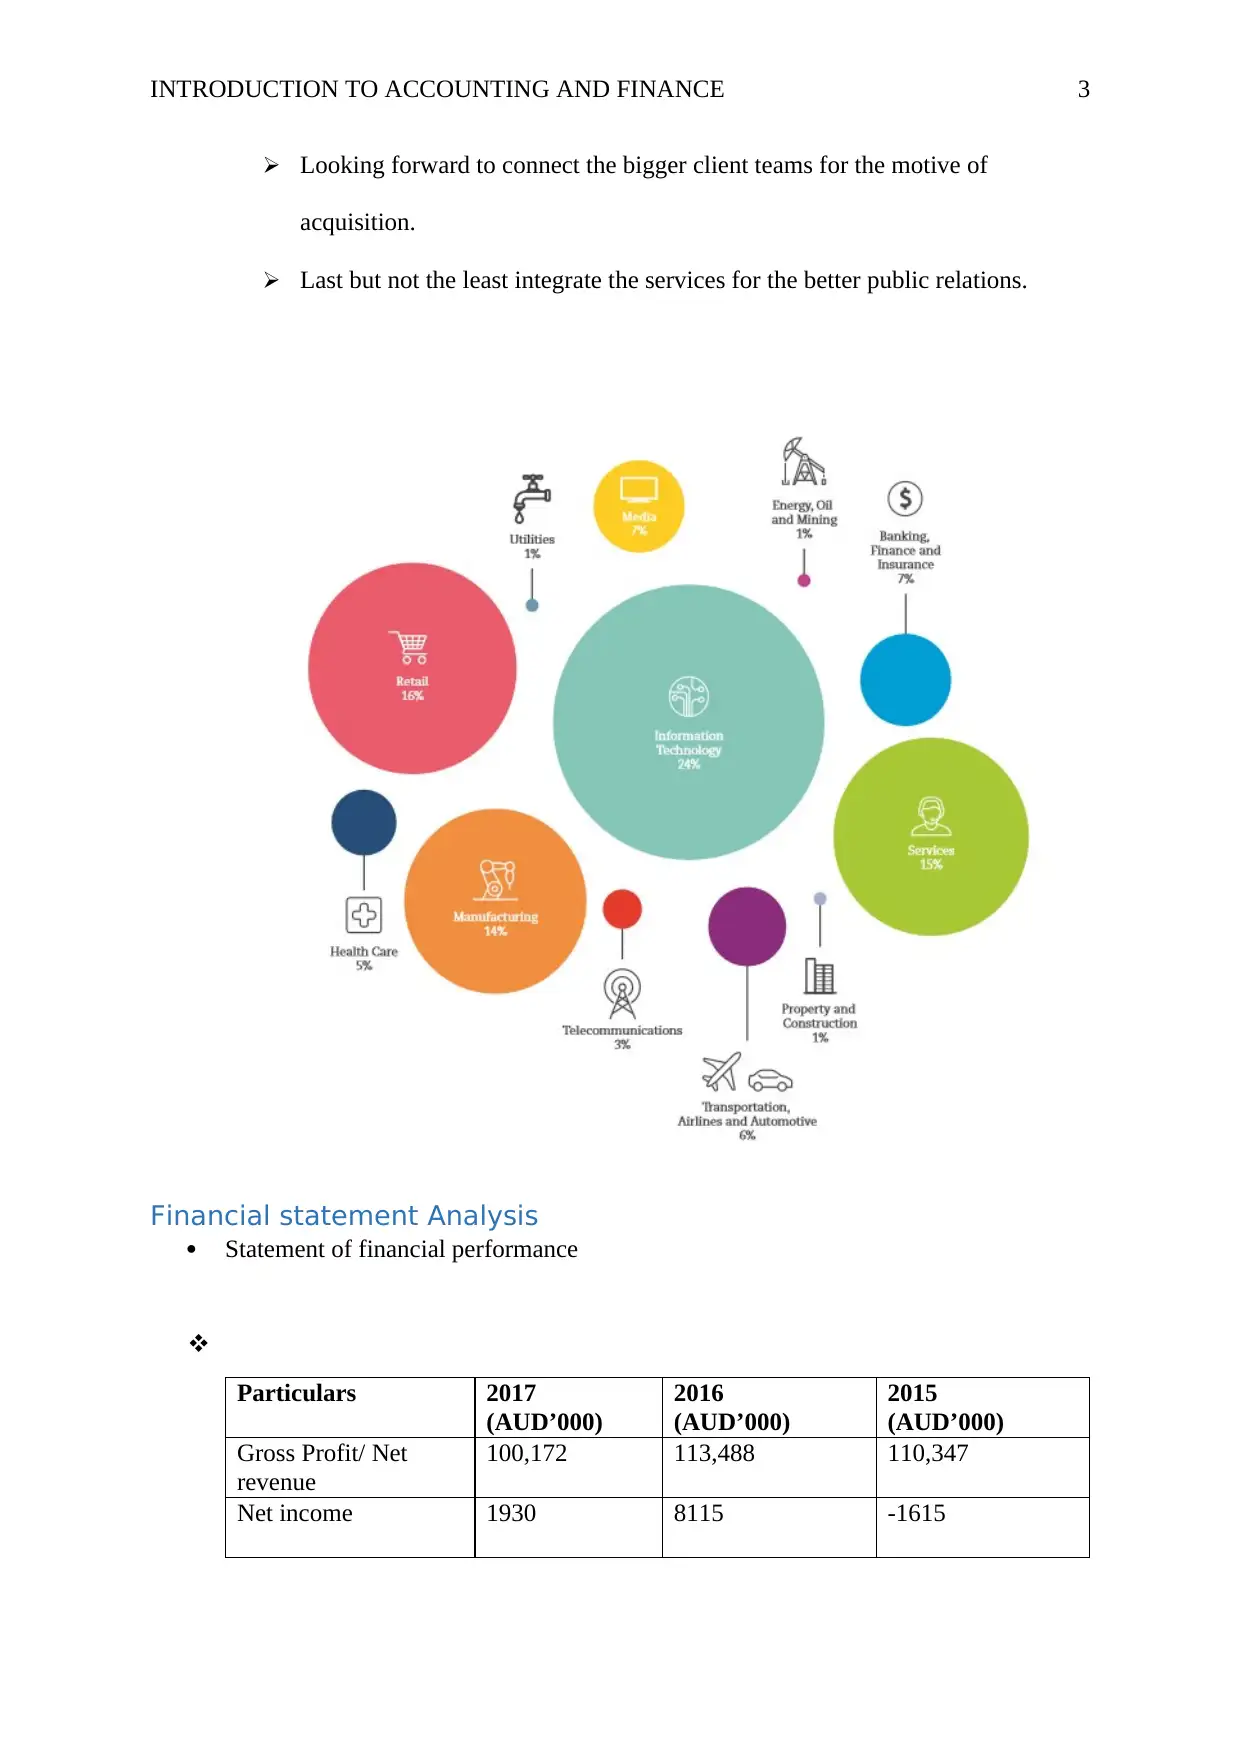
Enero Group limited has strong clients across the industry and sector group validates
expansion of revenue. It has been observed that largest client represents only 13% of
the total net revenue. Further the company has more than 700 client relationships.
This company has awarded with an 84 industry awards across the group.
The future plans of the company are as follows:
Fetch additional new resources.
Discover new sectors to sell the services
Expand the business in new geographies for the purpose to enhance the
networked clients.
1 Bloomberg. 2017. Company Overview of Enero Group Limited. Retrieved on 13 September 2017 from
http://www.bloomberg.com/research/stocks/private/snapshot.asp?privcapId=11190588.
2 Enero Group Limited. 2017. Annual Report. Retrieved on 13 September 2017 from
http://enero.com/images/enero/annual-reports/Enero_Annual_Report_FY17.PDF.
Enero Group Limited
Introduction
Enero is a company providing joined services of marketing and communication. The
services include advertisement, media planning, research, public relations, direct marketing
and design and event management (Bloomberg, 2017)1. It mainly operates from Sydney,
London and New York, and many other locations (Enero, 2017)2. Enero group limited is
based in Pyrmont, New South Wales, Australia. The CEO of the company is Matthew
Melhuish. The most recent share price is A$ 1.04 (date 30.06.2017) and the dividend per
share is 5 cents (date 26.06.2017). Independent auditor of the company is KPMG. Their
opinion on the company’s financial statements is that Enero group limited has prepared its
financial statements for the year ended 30 June 2017 in accordance with Australian
Accounting standards and the Corporations Regulations 2001.
Industry situation and company plans
Enero Group limited has strong clients across the industry and sector group validates
expansion of revenue. It has been observed that largest client represents only 13% of
the total net revenue. Further the company has more than 700 client relationships.
This company has awarded with an 84 industry awards across the group.
The future plans of the company are as follows:
Fetch additional new resources.
Discover new sectors to sell the services
Expand the business in new geographies for the purpose to enhance the
networked clients.
1 Bloomberg. 2017. Company Overview of Enero Group Limited. Retrieved on 13 September 2017 from
http://www.bloomberg.com/research/stocks/private/snapshot.asp?privcapId=11190588.
2 Enero Group Limited. 2017. Annual Report. Retrieved on 13 September 2017 from
http://enero.com/images/enero/annual-reports/Enero_Annual_Report_FY17.PDF.
⊘ This is a preview!⊘
Do you want full access?
Subscribe today to unlock all pages.
Trusted by 1+ million students worldwide
INTRODUCTION TO ACCOUNTING AND FINANCE 3
Looking forward to connect the bigger client teams for the motive of
acquisition.
Last but not the least integrate the services for the better public relations.
Financial statement Analysis
Statement of financial performance
Particulars 2017
(AUD’000)
2016
(AUD’000)
2015
(AUD’000)
Gross Profit/ Net
revenue
100,172 113,488 110,347
Net income 1930 8115 -1615
Paraphrase This Document
Need a fresh take? Get an instant paraphrase of this document with our AI Paraphraser
INTRODUCTION TO ACCOUNTING AND FINANCE 4
Income from
operations
3436 10073 576
(Source: Annual Report, 2017;2016;2015)345.
Comment:
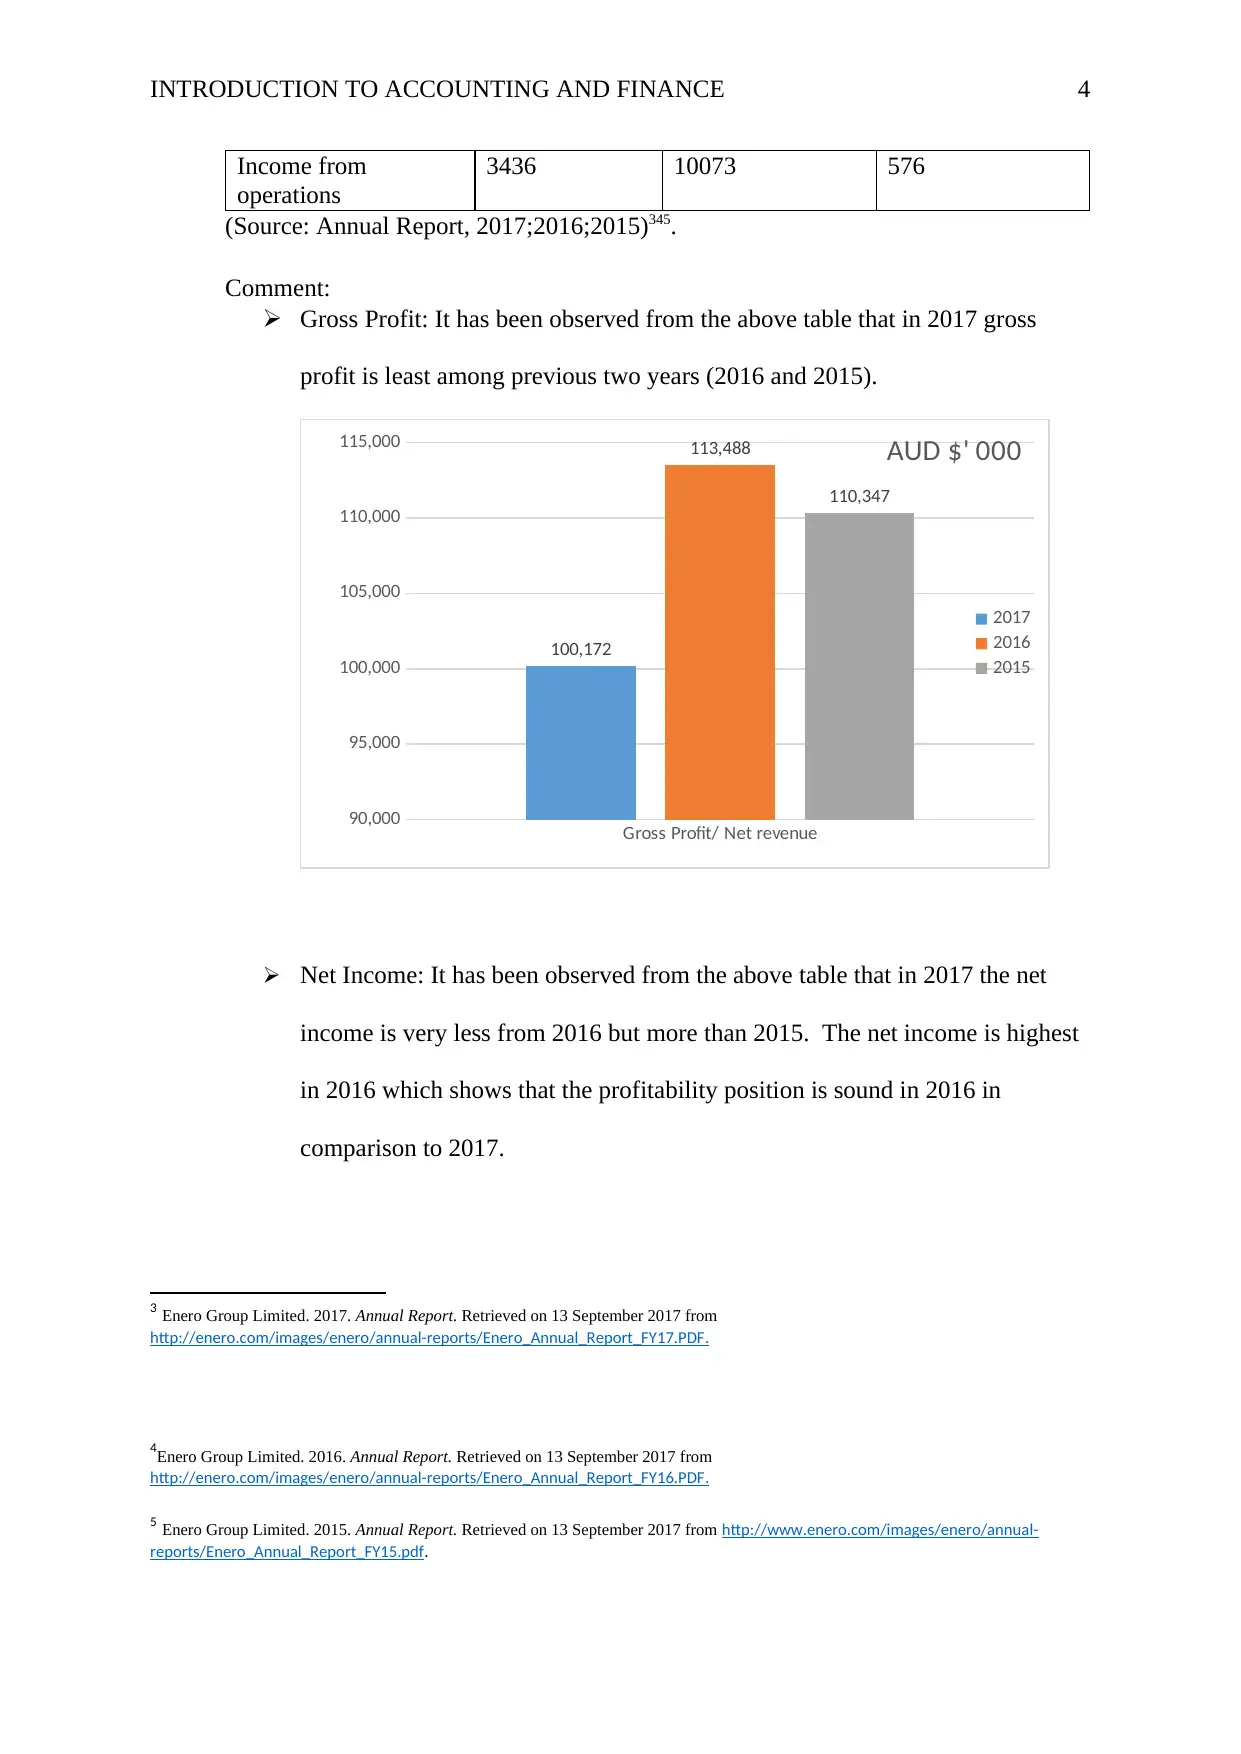
Gross Profit: It has been observed from the above table that in 2017 gross
profit is least among previous two years (2016 and 2015).
Gross Profit/ Net revenue
90,000
95,000
100,000
105,000
110,000
115,000
100,172
113,488
110,347
AUD $' 000
2017
2016
2015
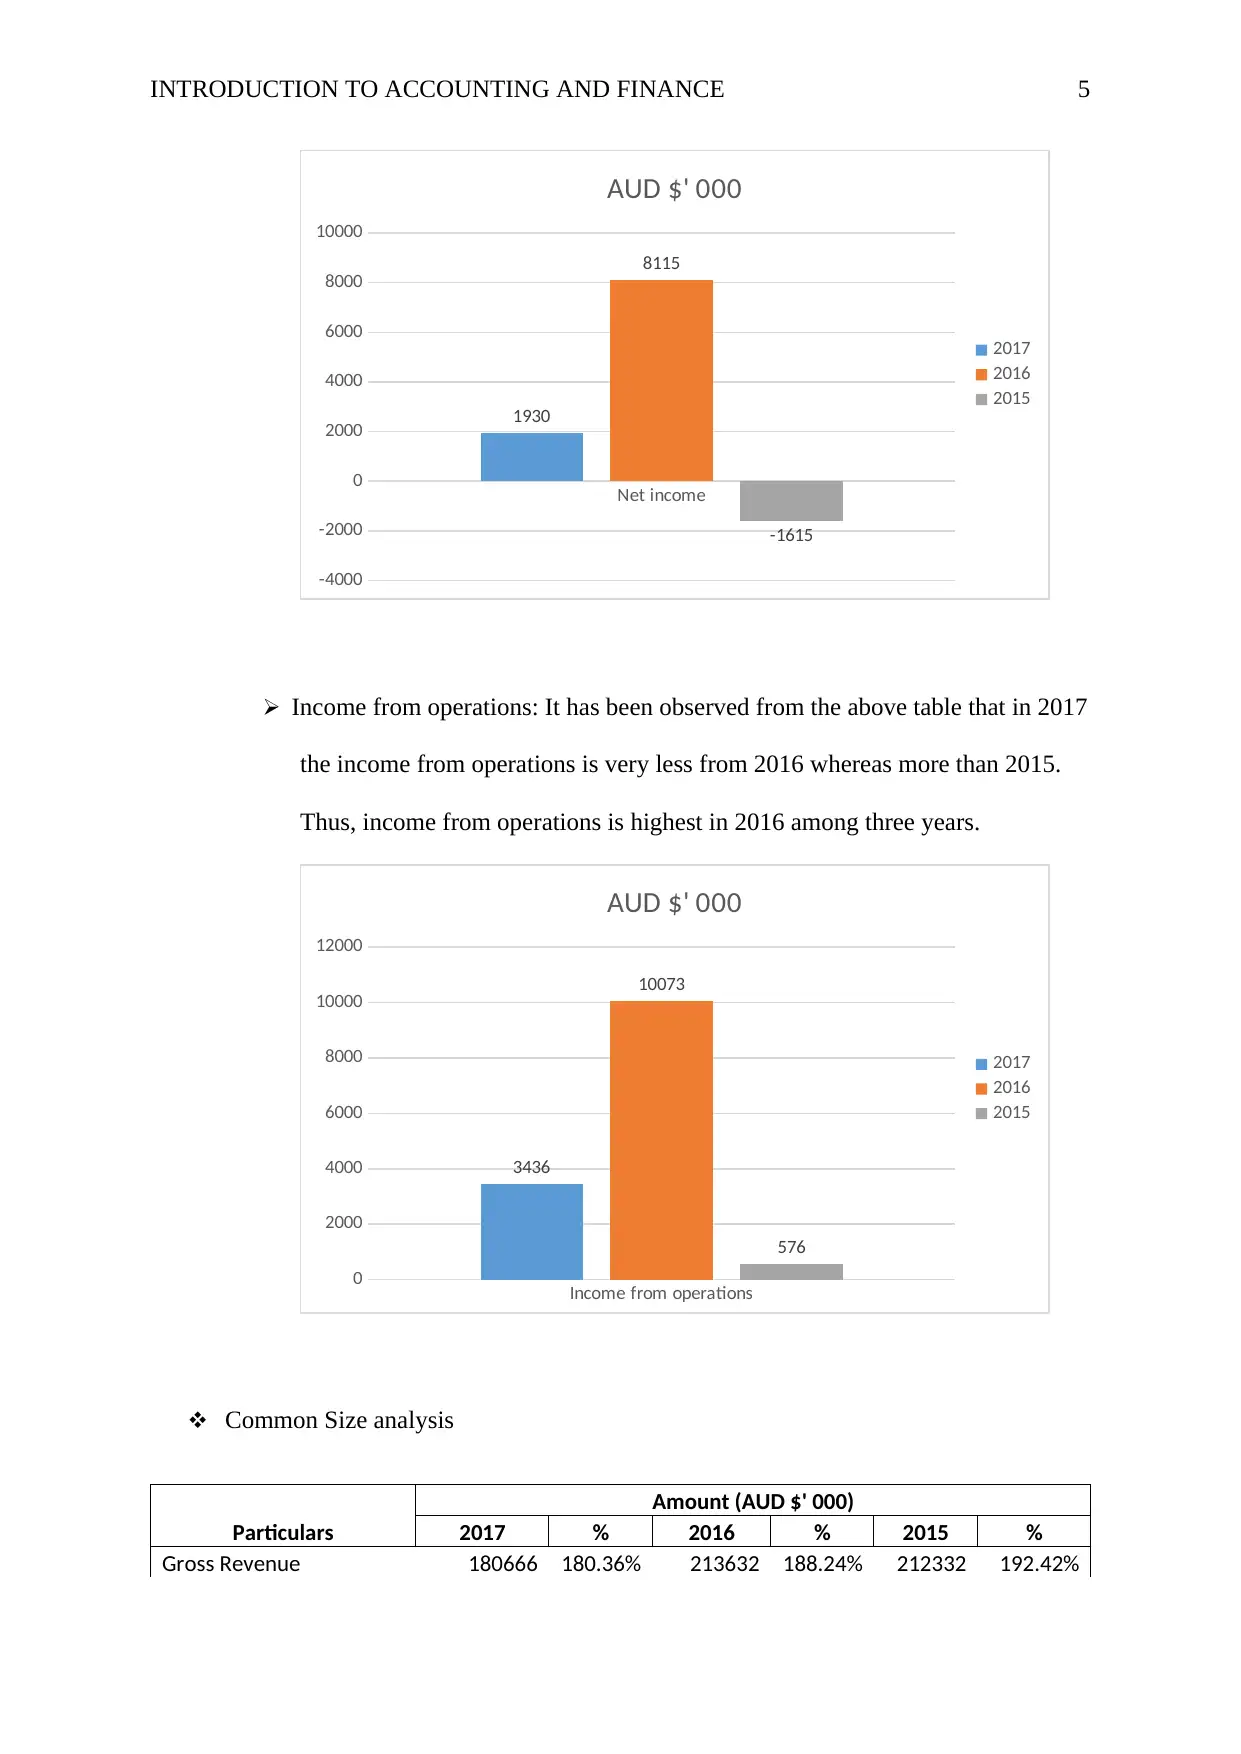
Net Income: It has been observed from the above table that in 2017 the net
income is very less from 2016 but more than 2015. The net income is highest
in 2016 which shows that the profitability position is sound in 2016 in
comparison to 2017.
3 Enero Group Limited. 2017. Annual Report. Retrieved on 13 September 2017 from
http://enero.com/images/enero/annual-reports/Enero_Annual_Report_FY17.PDF.
4Enero Group Limited. 2016. Annual Report. Retrieved on 13 September 2017 from
http://enero.com/images/enero/annual-reports/Enero_Annual_Report_FY16.PDF.
5 Enero Group Limited. 2015. Annual Report. Retrieved on 13 September 2017 from http://www.enero.com/images/enero/annual-
reports/Enero_Annual_Report_FY15.pdf.
Income from
operations
3436 10073 576
(Source: Annual Report, 2017;2016;2015)345.
Comment:
Gross Profit: It has been observed from the above table that in 2017 gross
profit is least among previous two years (2016 and 2015).
Gross Profit/ Net revenue
90,000
95,000
100,000
105,000
110,000
115,000
100,172
113,488
110,347
AUD $' 000
2017
2016
2015
Net Income: It has been observed from the above table that in 2017 the net
income is very less from 2016 but more than 2015. The net income is highest
in 2016 which shows that the profitability position is sound in 2016 in
comparison to 2017.
3 Enero Group Limited. 2017. Annual Report. Retrieved on 13 September 2017 from
http://enero.com/images/enero/annual-reports/Enero_Annual_Report_FY17.PDF.
4Enero Group Limited. 2016. Annual Report. Retrieved on 13 September 2017 from
http://enero.com/images/enero/annual-reports/Enero_Annual_Report_FY16.PDF.
5 Enero Group Limited. 2015. Annual Report. Retrieved on 13 September 2017 from http://www.enero.com/images/enero/annual-
reports/Enero_Annual_Report_FY15.pdf.
INTRODUCTION TO ACCOUNTING AND FINANCE 5
Net income
-4000
-2000
0
2000
4000
6000
8000
10000
1930
8115
-1615
AUD $' 000
2017
2016
2015
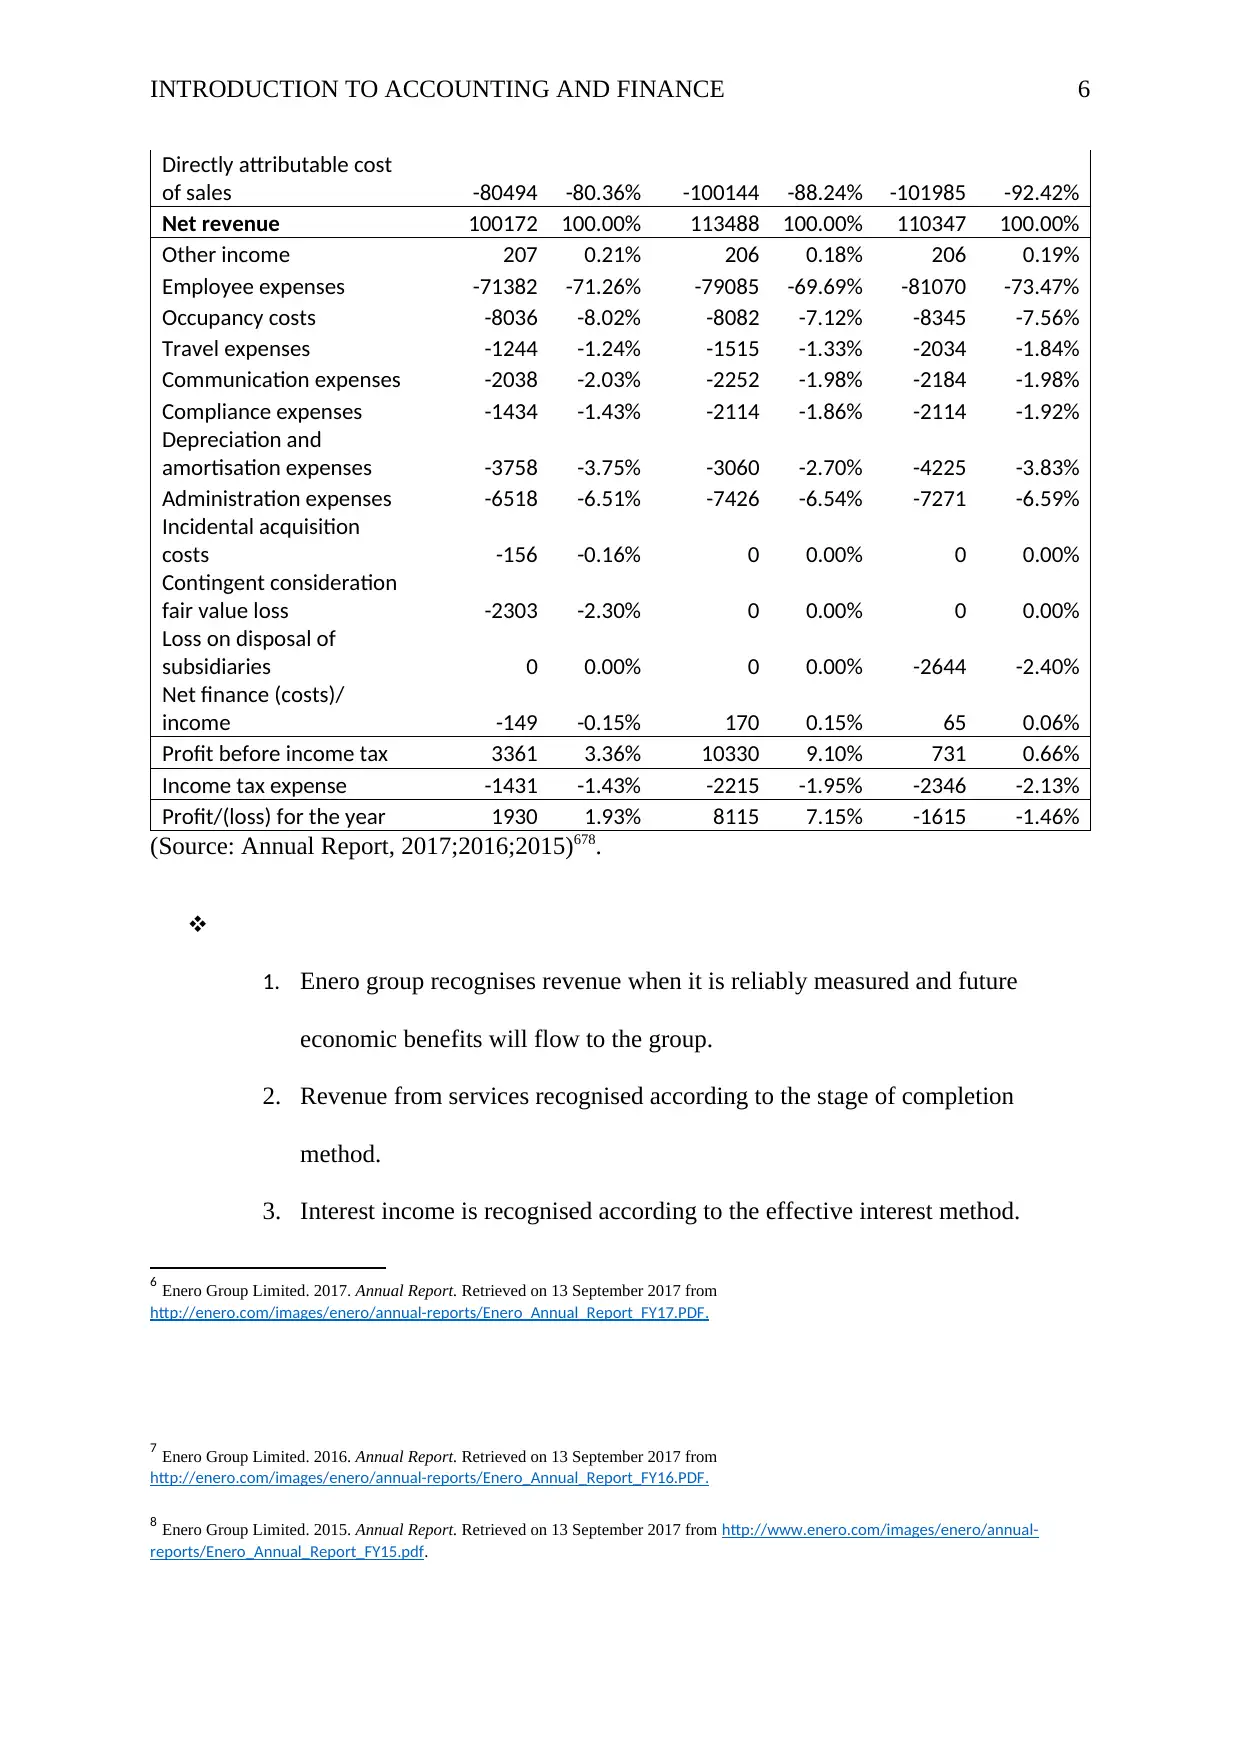
Income from operations: It has been observed from the above table that in 2017
the income from operations is very less from 2016 whereas more than 2015.
Thus, income from operations is highest in 2016 among three years.
Income from operations
0
2000
4000
6000
8000
10000
12000
3436
10073
576
AUD $' 000
2017
2016
2015
Common Size analysis
Particulars
Amount (AUD $' 000)
2017 % 2016 % 2015 %
Gross Revenue 180666 180.36% 213632 188.24% 212332 192.42%
Net income
-4000
-2000
0
2000
4000
6000
8000
10000
1930
8115
-1615
AUD $' 000
2017
2016
2015
Income from operations: It has been observed from the above table that in 2017
the income from operations is very less from 2016 whereas more than 2015.
Thus, income from operations is highest in 2016 among three years.
Income from operations
0
2000
4000
6000
8000
10000
12000
3436
10073
576
AUD $' 000
2017
2016
2015
Common Size analysis
Particulars
Amount (AUD $' 000)
2017 % 2016 % 2015 %
Gross Revenue 180666 180.36% 213632 188.24% 212332 192.42%
⊘ This is a preview!⊘
Do you want full access?
Subscribe today to unlock all pages.
Trusted by 1+ million students worldwide
INTRODUCTION TO ACCOUNTING AND FINANCE 6
Directly attributable cost
of sales -80494 -80.36% -100144 -88.24% -101985 -92.42%
Net revenue 100172 100.00% 113488 100.00% 110347 100.00%
Other income 207 0.21% 206 0.18% 206 0.19%
Employee expenses -71382 -71.26% -79085 -69.69% -81070 -73.47%
Occupancy costs -8036 -8.02% -8082 -7.12% -8345 -7.56%
Travel expenses -1244 -1.24% -1515 -1.33% -2034 -1.84%
Communication expenses -2038 -2.03% -2252 -1.98% -2184 -1.98%
Compliance expenses -1434 -1.43% -2114 -1.86% -2114 -1.92%
Depreciation and
amortisation expenses -3758 -3.75% -3060 -2.70% -4225 -3.83%
Administration expenses -6518 -6.51% -7426 -6.54% -7271 -6.59%
Incidental acquisition
costs -156 -0.16% 0 0.00% 0 0.00%
Contingent consideration
fair value loss -2303 -2.30% 0 0.00% 0 0.00%
Loss on disposal of
subsidiaries 0 0.00% 0 0.00% -2644 -2.40%
Net finance (costs)/
income -149 -0.15% 170 0.15% 65 0.06%
Profit before income tax 3361 3.36% 10330 9.10% 731 0.66%
Income tax expense -1431 -1.43% -2215 -1.95% -2346 -2.13%
Profit/(loss) for the year 1930 1.93% 8115 7.15% -1615 -1.46%
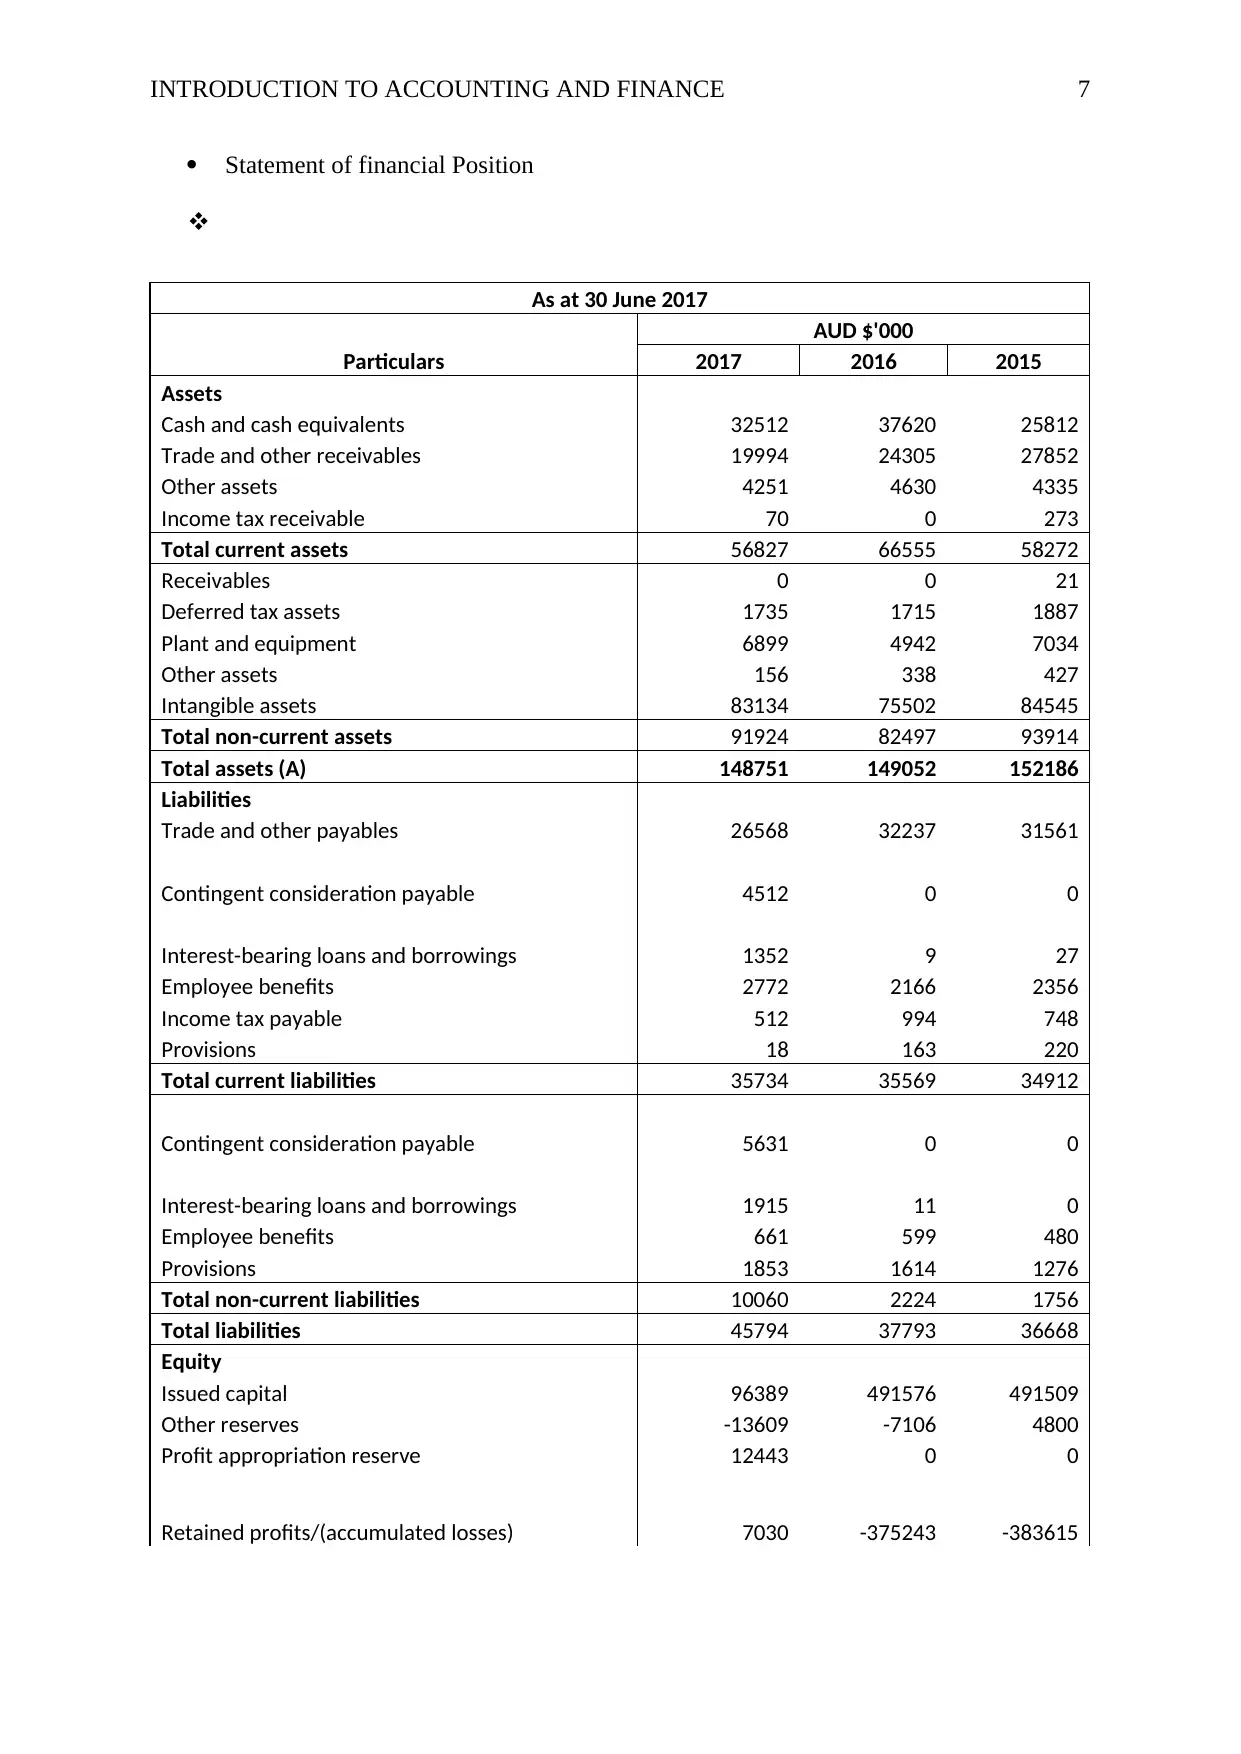
(Source: Annual Report, 2017;2016;2015)678.
1. Enero group recognises revenue when it is reliably measured and future
economic benefits will flow to the group.
2. Revenue from services recognised according to the stage of completion
method.
3. Interest income is recognised according to the effective interest method.
6 Enero Group Limited. 2017. Annual Report. Retrieved on 13 September 2017 from
http://enero.com/images/enero/annual-reports/Enero_Annual_Report_FY17.PDF.
7 Enero Group Limited. 2016. Annual Report. Retrieved on 13 September 2017 from
http://enero.com/images/enero/annual-reports/Enero_Annual_Report_FY16.PDF.
8 Enero Group Limited. 2015. Annual Report. Retrieved on 13 September 2017 from http://www.enero.com/images/enero/annual-
reports/Enero_Annual_Report_FY15.pdf.
Directly attributable cost
of sales -80494 -80.36% -100144 -88.24% -101985 -92.42%
Net revenue 100172 100.00% 113488 100.00% 110347 100.00%
Other income 207 0.21% 206 0.18% 206 0.19%
Employee expenses -71382 -71.26% -79085 -69.69% -81070 -73.47%
Occupancy costs -8036 -8.02% -8082 -7.12% -8345 -7.56%
Travel expenses -1244 -1.24% -1515 -1.33% -2034 -1.84%
Communication expenses -2038 -2.03% -2252 -1.98% -2184 -1.98%
Compliance expenses -1434 -1.43% -2114 -1.86% -2114 -1.92%
Depreciation and
amortisation expenses -3758 -3.75% -3060 -2.70% -4225 -3.83%
Administration expenses -6518 -6.51% -7426 -6.54% -7271 -6.59%
Incidental acquisition
costs -156 -0.16% 0 0.00% 0 0.00%
Contingent consideration
fair value loss -2303 -2.30% 0 0.00% 0 0.00%
Loss on disposal of
subsidiaries 0 0.00% 0 0.00% -2644 -2.40%
Net finance (costs)/
income -149 -0.15% 170 0.15% 65 0.06%
Profit before income tax 3361 3.36% 10330 9.10% 731 0.66%
Income tax expense -1431 -1.43% -2215 -1.95% -2346 -2.13%
Profit/(loss) for the year 1930 1.93% 8115 7.15% -1615 -1.46%
(Source: Annual Report, 2017;2016;2015)678.
1. Enero group recognises revenue when it is reliably measured and future
economic benefits will flow to the group.
2. Revenue from services recognised according to the stage of completion
method.
3. Interest income is recognised according to the effective interest method.
6 Enero Group Limited. 2017. Annual Report. Retrieved on 13 September 2017 from
http://enero.com/images/enero/annual-reports/Enero_Annual_Report_FY17.PDF.
7 Enero Group Limited. 2016. Annual Report. Retrieved on 13 September 2017 from
http://enero.com/images/enero/annual-reports/Enero_Annual_Report_FY16.PDF.
8 Enero Group Limited. 2015. Annual Report. Retrieved on 13 September 2017 from http://www.enero.com/images/enero/annual-
reports/Enero_Annual_Report_FY15.pdf.
Paraphrase This Document
Need a fresh take? Get an instant paraphrase of this document with our AI Paraphraser
INTRODUCTION TO ACCOUNTING AND FINANCE 7
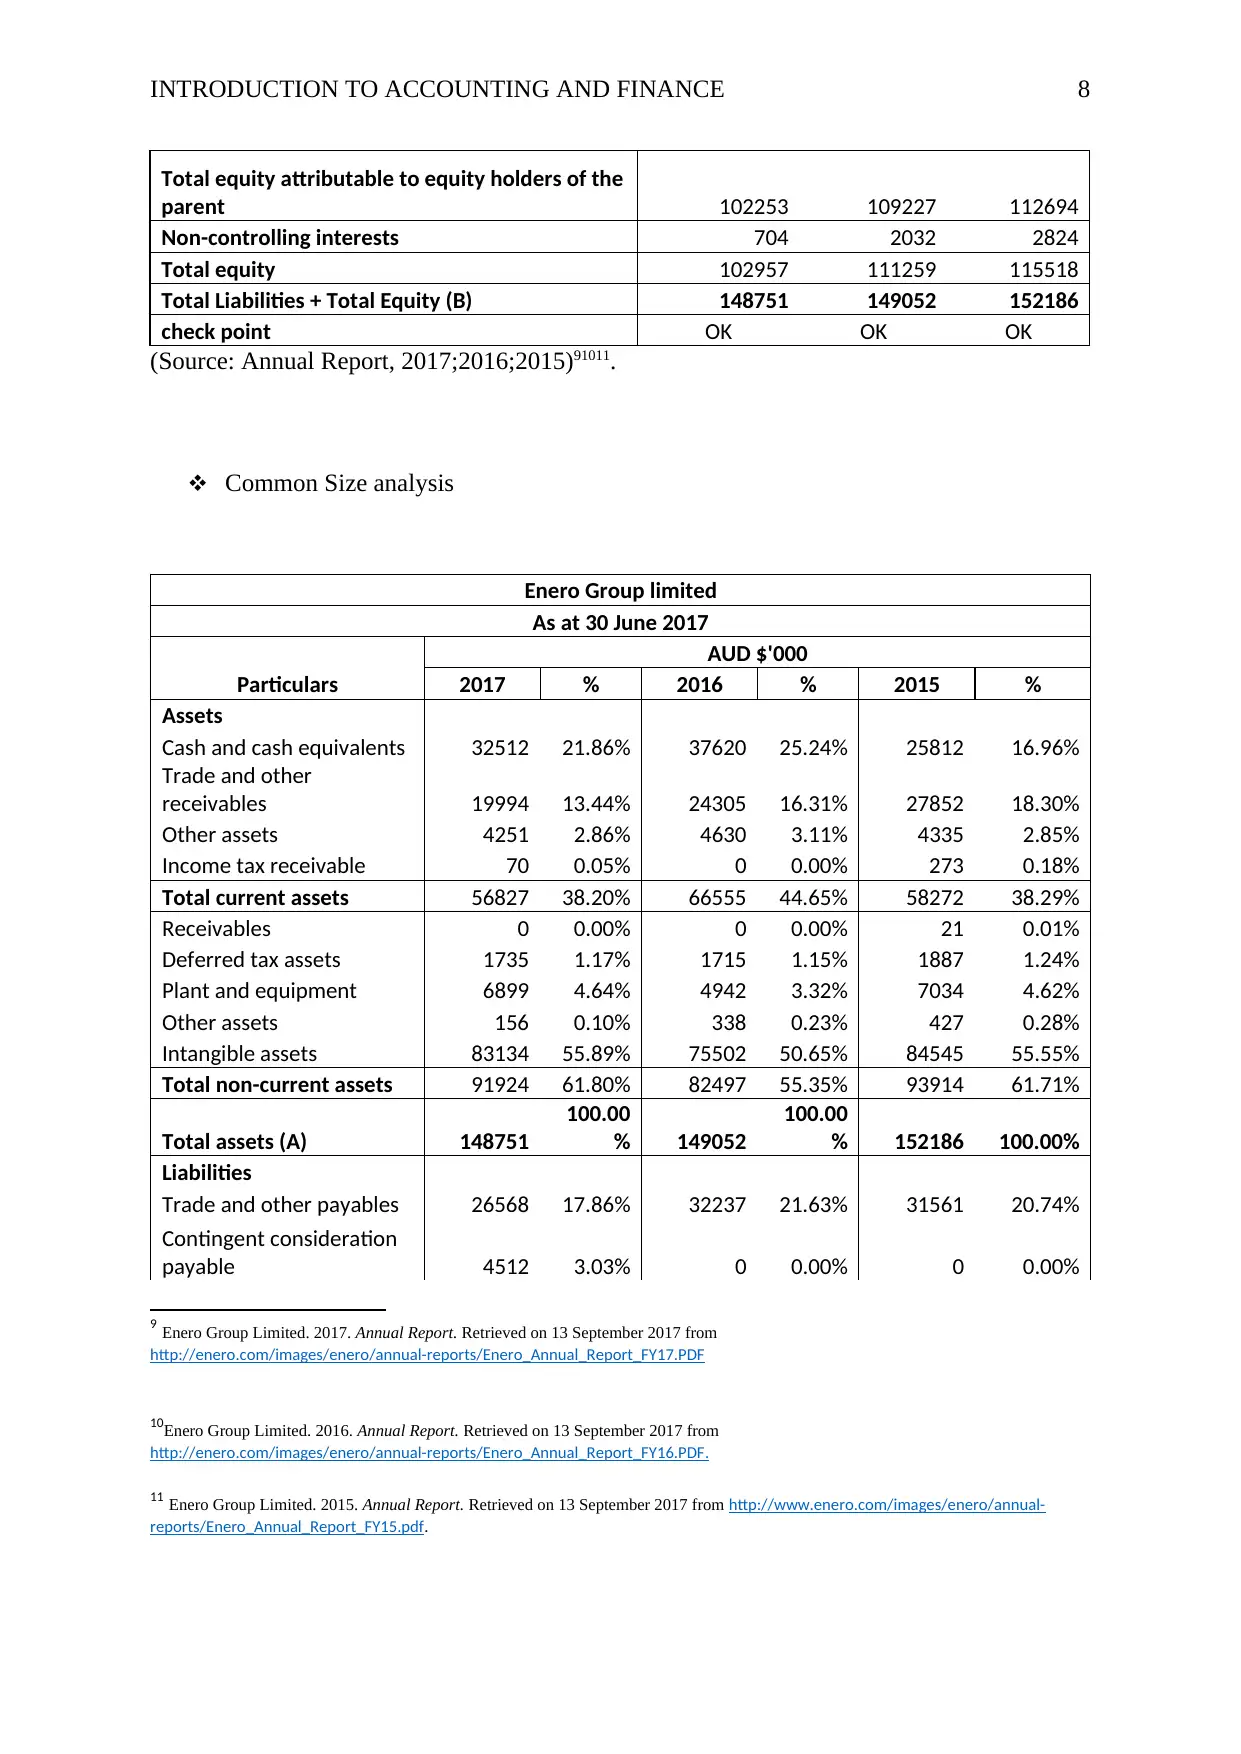
Statement of financial Position
As at 30 June 2017
Particulars
AUD $'000
2017 2016 2015
Assets
Cash and cash equivalents 32512 37620 25812
Trade and other receivables 19994 24305 27852
Other assets 4251 4630 4335
Income tax receivable 70 0 273
Total current assets 56827 66555 58272
Receivables 0 0 21
Deferred tax assets 1735 1715 1887
Plant and equipment 6899 4942 7034
Other assets 156 338 427
Intangible assets 83134 75502 84545
Total non-current assets 91924 82497 93914
Total assets (A) 148751 149052 152186
Liabilities
Trade and other payables 26568 32237 31561
Contingent consideration payable 4512 0 0
Interest-bearing loans and borrowings 1352 9 27
Employee benefits 2772 2166 2356
Income tax payable 512 994 748
Provisions 18 163 220
Total current liabilities 35734 35569 34912
Contingent consideration payable 5631 0 0
Interest-bearing loans and borrowings 1915 11 0
Employee benefits 661 599 480
Provisions 1853 1614 1276
Total non-current liabilities 10060 2224 1756
Total liabilities 45794 37793 36668
Equity
Issued capital 96389 491576 491509
Other reserves -13609 -7106 4800
Profit appropriation reserve 12443 0 0
Retained profits/(accumulated losses) 7030 -375243 -383615
INTRODUCTION TO ACCOUNTING AND FINANCE 8
Total equity attributable to equity holders of the
parent 102253 109227 112694
Non-controlling interests 704 2032 2824
Total equity 102957 111259 115518
Total Liabilities + Total Equity (B) 148751 149052 152186
check point OK OK OK
(Source: Annual Report, 2017;2016;2015)91011.
Common Size analysis
Enero Group limited
As at 30 June 2017
Particulars
AUD $'000
2017 % 2016 % 2015 %
Assets
Cash and cash equivalents 32512 21.86% 37620 25.24% 25812 16.96%
Trade and other
receivables 19994 13.44% 24305 16.31% 27852 18.30%
Other assets 4251 2.86% 4630 3.11% 4335 2.85%
Income tax receivable 70 0.05% 0 0.00% 273 0.18%
Total current assets 56827 38.20% 66555 44.65% 58272 38.29%
Receivables 0 0.00% 0 0.00% 21 0.01%
Deferred tax assets 1735 1.17% 1715 1.15% 1887 1.24%
Plant and equipment 6899 4.64% 4942 3.32% 7034 4.62%
Other assets 156 0.10% 338 0.23% 427 0.28%
Intangible assets 83134 55.89% 75502 50.65% 84545 55.55%
Total non-current assets 91924 61.80% 82497 55.35% 93914 61.71%
Total assets (A) 148751
100.00
% 149052
100.00
% 152186 100.00%
Liabilities
Trade and other payables 26568 17.86% 32237 21.63% 31561 20.74%
Contingent consideration
payable 4512 3.03% 0 0.00% 0 0.00%
9 Enero Group Limited. 2017. Annual Report. Retrieved on 13 September 2017 from
http://enero.com/images/enero/annual-reports/Enero_Annual_Report_FY17.PDF
10Enero Group Limited. 2016. Annual Report. Retrieved on 13 September 2017 from
http://enero.com/images/enero/annual-reports/Enero_Annual_Report_FY16.PDF.
11 Enero Group Limited. 2015. Annual Report. Retrieved on 13 September 2017 from http://www.enero.com/images/enero/annual-
reports/Enero_Annual_Report_FY15.pdf.
⊘ This is a preview!⊘
Do you want full access?
Subscribe today to unlock all pages.
Trusted by 1+ million students worldwide
INTRODUCTION TO ACCOUNTING AND FINANCE 9
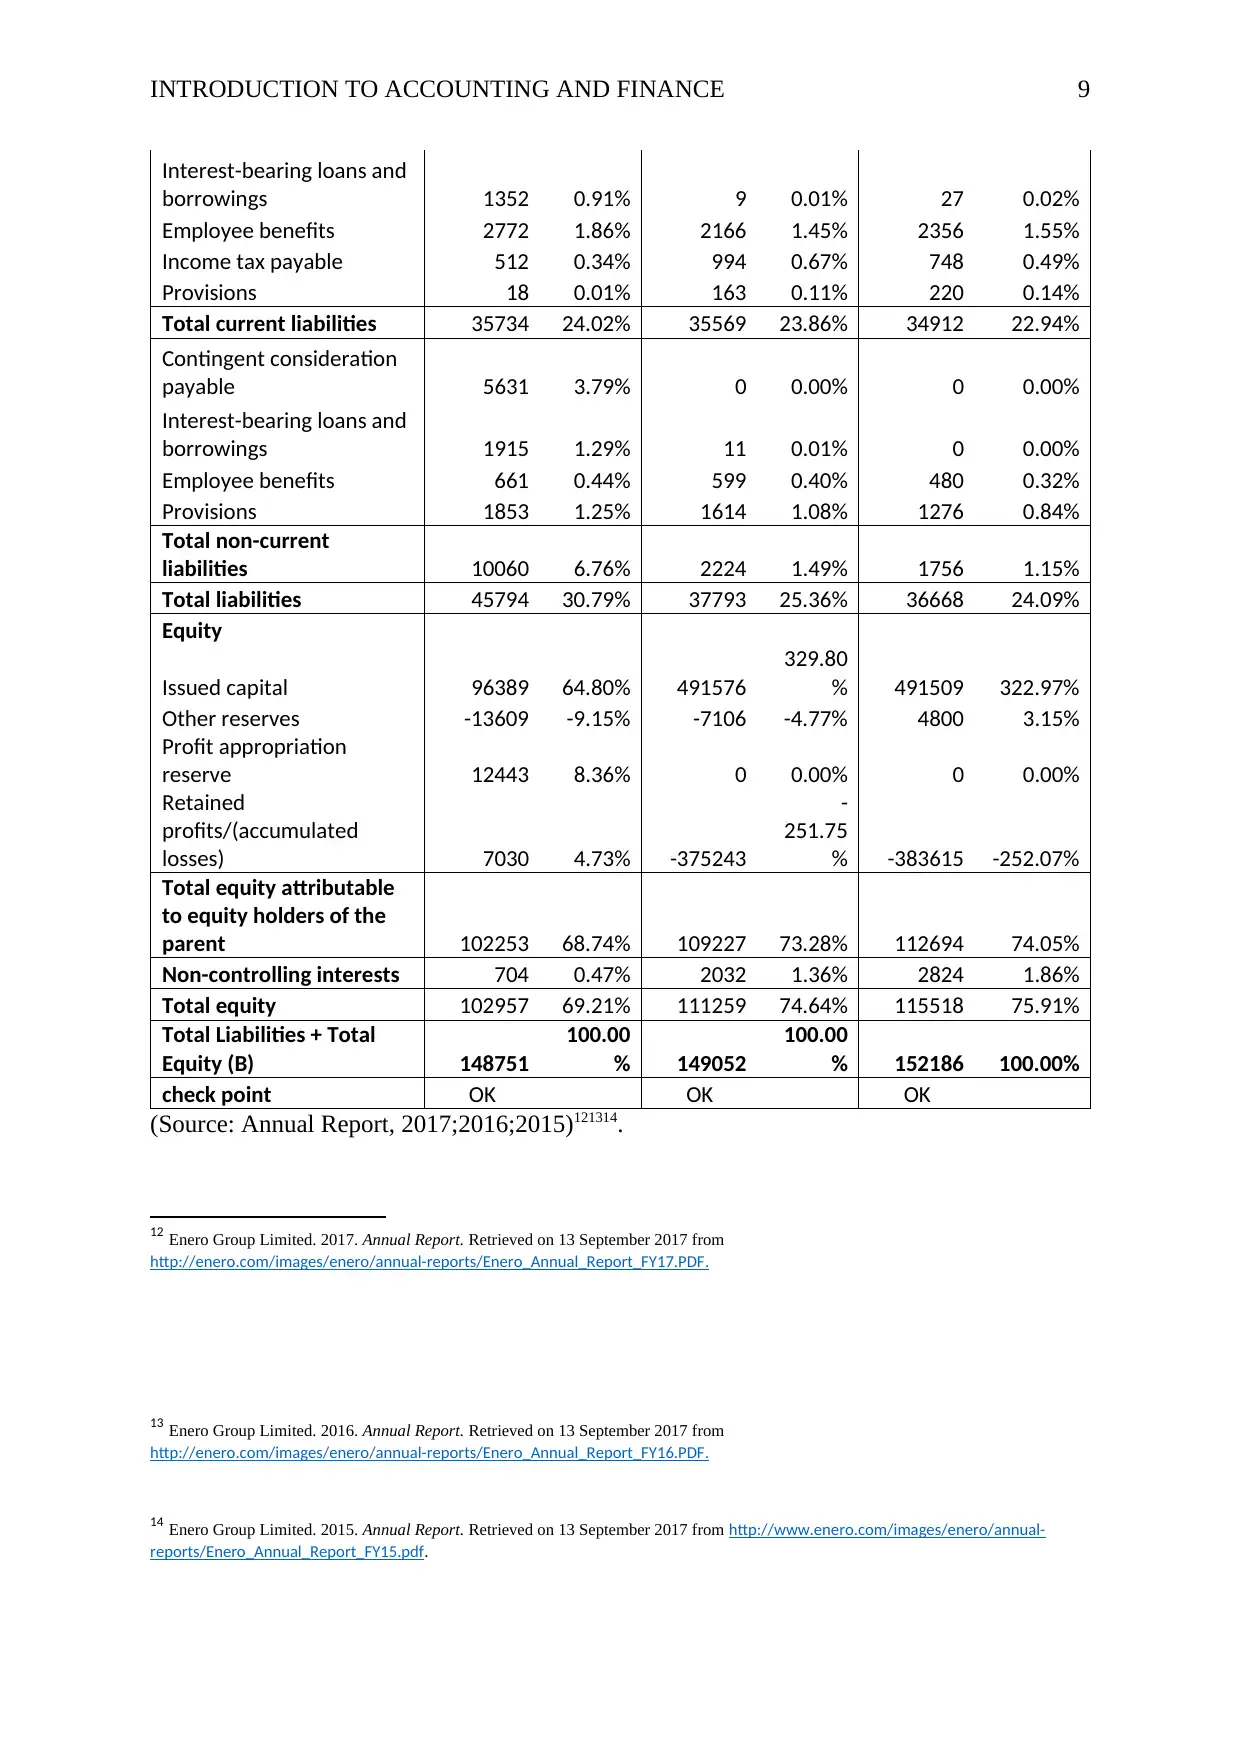
Interest-bearing loans and
borrowings 1352 0.91% 9 0.01% 27 0.02%
Employee benefits 2772 1.86% 2166 1.45% 2356 1.55%
Income tax payable 512 0.34% 994 0.67% 748 0.49%
Provisions 18 0.01% 163 0.11% 220 0.14%
Total current liabilities 35734 24.02% 35569 23.86% 34912 22.94%
Contingent consideration
payable 5631 3.79% 0 0.00% 0 0.00%
Interest-bearing loans and
borrowings 1915 1.29% 11 0.01% 0 0.00%
Employee benefits 661 0.44% 599 0.40% 480 0.32%
Provisions 1853 1.25% 1614 1.08% 1276 0.84%
Total non-current
liabilities 10060 6.76% 2224 1.49% 1756 1.15%
Total liabilities 45794 30.79% 37793 25.36% 36668 24.09%
Equity
Issued capital 96389 64.80% 491576
329.80
% 491509 322.97%
Other reserves -13609 -9.15% -7106 -4.77% 4800 3.15%
Profit appropriation
reserve 12443 8.36% 0 0.00% 0 0.00%
Retained
profits/(accumulated
losses) 7030 4.73% -375243
-
251.75
% -383615 -252.07%
Total equity attributable
to equity holders of the
parent 102253 68.74% 109227 73.28% 112694 74.05%
Non-controlling interests 704 0.47% 2032 1.36% 2824 1.86%
Total equity 102957 69.21% 111259 74.64% 115518 75.91%
Total Liabilities + Total
Equity (B) 148751
100.00
% 149052
100.00
% 152186 100.00%
check point OK OK OK
(Source: Annual Report, 2017;2016;2015)121314.
12 Enero Group Limited. 2017. Annual Report. Retrieved on 13 September 2017 from
http://enero.com/images/enero/annual-reports/Enero_Annual_Report_FY17.PDF.
13 Enero Group Limited. 2016. Annual Report. Retrieved on 13 September 2017 from
http://enero.com/images/enero/annual-reports/Enero_Annual_Report_FY16.PDF.
14 Enero Group Limited. 2015. Annual Report. Retrieved on 13 September 2017 from http://www.enero.com/images/enero/annual-
reports/Enero_Annual_Report_FY15.pdf.
Interest-bearing loans and
borrowings 1352 0.91% 9 0.01% 27 0.02%
Employee benefits 2772 1.86% 2166 1.45% 2356 1.55%
Income tax payable 512 0.34% 994 0.67% 748 0.49%
Provisions 18 0.01% 163 0.11% 220 0.14%
Total current liabilities 35734 24.02% 35569 23.86% 34912 22.94%
Contingent consideration
payable 5631 3.79% 0 0.00% 0 0.00%
Interest-bearing loans and
borrowings 1915 1.29% 11 0.01% 0 0.00%
Employee benefits 661 0.44% 599 0.40% 480 0.32%
Provisions 1853 1.25% 1614 1.08% 1276 0.84%
Total non-current
liabilities 10060 6.76% 2224 1.49% 1756 1.15%
Total liabilities 45794 30.79% 37793 25.36% 36668 24.09%
Equity
Issued capital 96389 64.80% 491576
329.80
% 491509 322.97%
Other reserves -13609 -9.15% -7106 -4.77% 4800 3.15%
Profit appropriation
reserve 12443 8.36% 0 0.00% 0 0.00%
Retained
profits/(accumulated
losses) 7030 4.73% -375243
-
251.75
% -383615 -252.07%
Total equity attributable
to equity holders of the
parent 102253 68.74% 109227 73.28% 112694 74.05%
Non-controlling interests 704 0.47% 2032 1.36% 2824 1.86%
Total equity 102957 69.21% 111259 74.64% 115518 75.91%
Total Liabilities + Total
Equity (B) 148751
100.00
% 149052
100.00
% 152186 100.00%
check point OK OK OK
(Source: Annual Report, 2017;2016;2015)121314.
12 Enero Group Limited. 2017. Annual Report. Retrieved on 13 September 2017 from
http://enero.com/images/enero/annual-reports/Enero_Annual_Report_FY17.PDF.
13 Enero Group Limited. 2016. Annual Report. Retrieved on 13 September 2017 from
http://enero.com/images/enero/annual-reports/Enero_Annual_Report_FY16.PDF.
14 Enero Group Limited. 2015. Annual Report. Retrieved on 13 September 2017 from http://www.enero.com/images/enero/annual-
reports/Enero_Annual_Report_FY15.pdf.
Paraphrase This Document
Need a fresh take? Get an instant paraphrase of this document with our AI Paraphraser
INTRODUCTION TO ACCOUNTING AND FINANCE 10
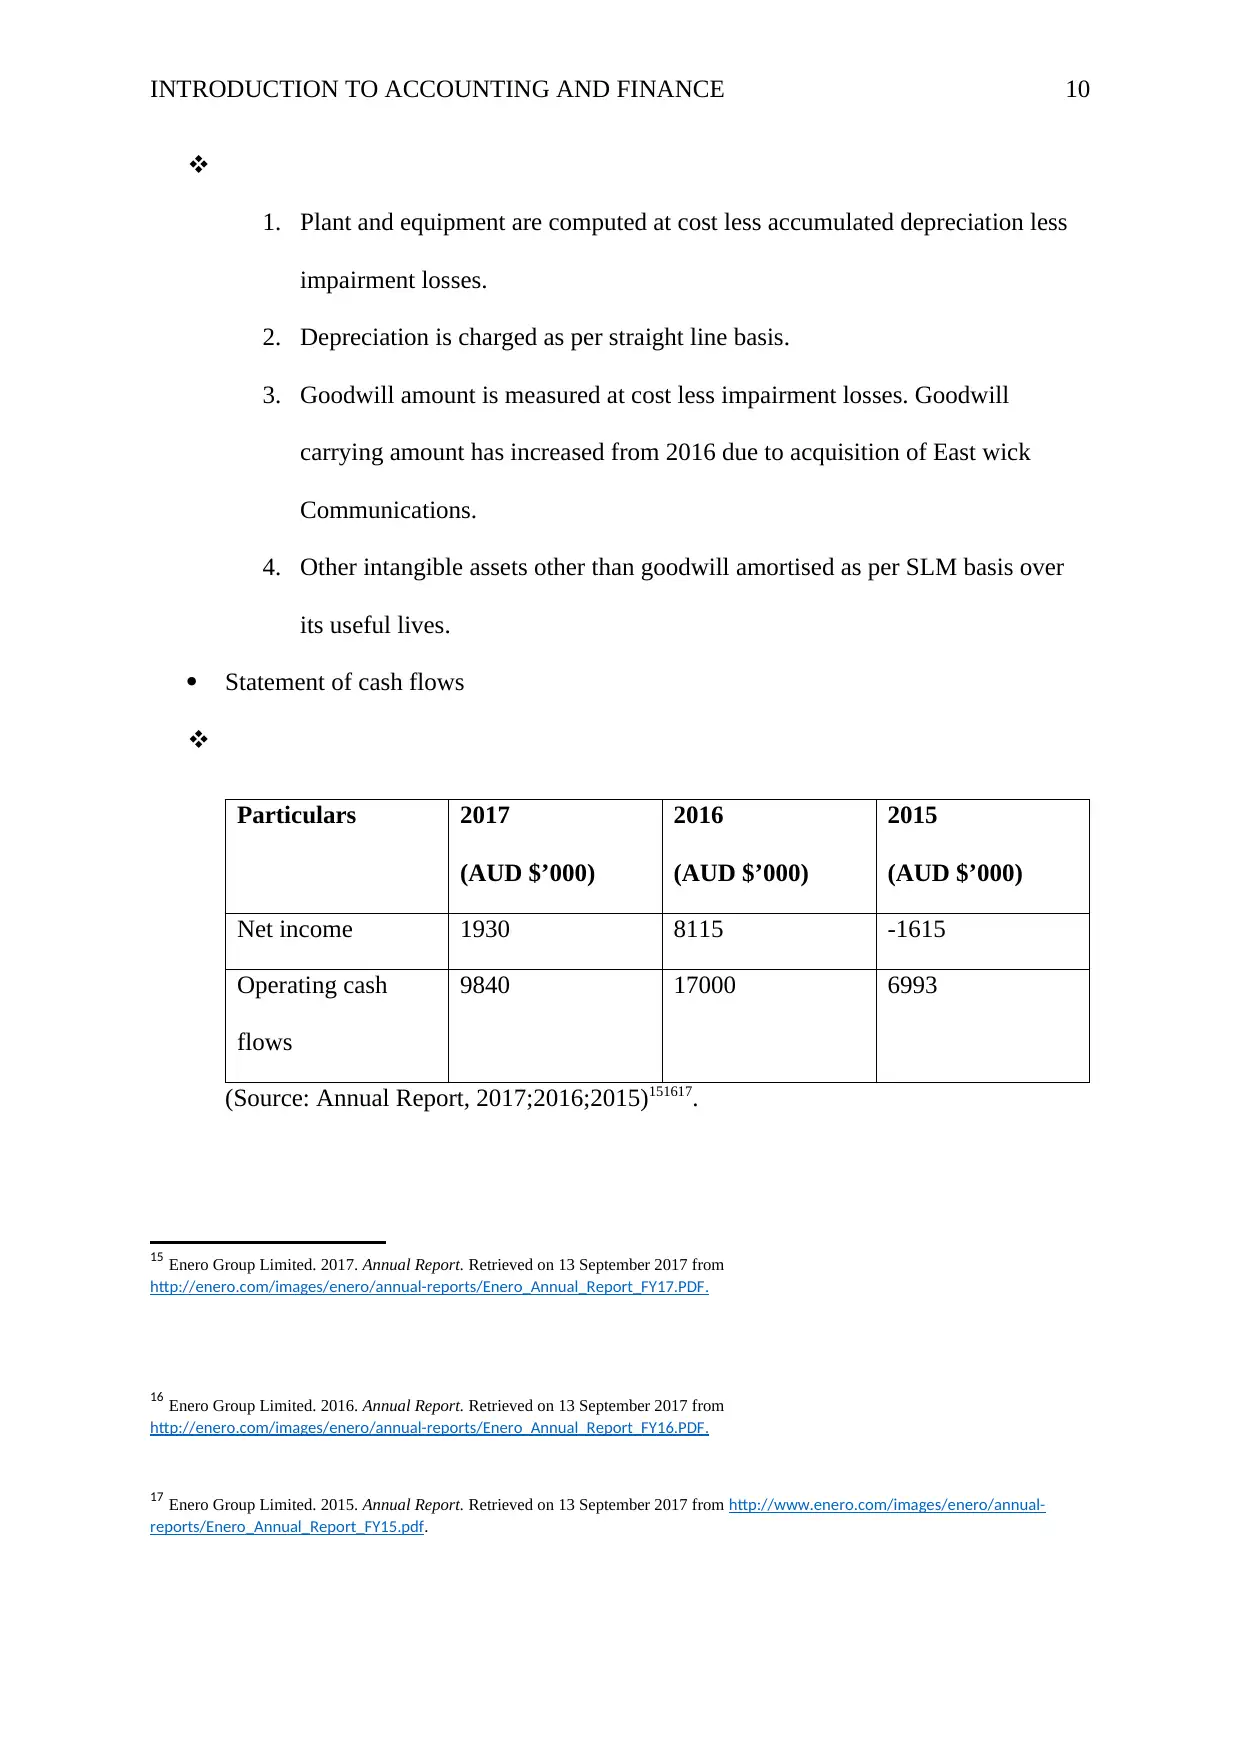
1. Plant and equipment are computed at cost less accumulated depreciation less
impairment losses.
2. Depreciation is charged as per straight line basis.
3. Goodwill amount is measured at cost less impairment losses. Goodwill
carrying amount has increased from 2016 due to acquisition of East wick
Communications.
4. Other intangible assets other than goodwill amortised as per SLM basis over
its useful lives.
Statement of cash flows
Particulars 2017
(AUD $’000)
2016
(AUD $’000)
2015
(AUD $’000)
Net income 1930 8115 -1615
Operating cash
flows
9840 17000 6993
(Source: Annual Report, 2017;2016;2015)151617.
15 Enero Group Limited. 2017. Annual Report. Retrieved on 13 September 2017 from
http://enero.com/images/enero/annual-reports/Enero_Annual_Report_FY17.PDF.
16 Enero Group Limited. 2016. Annual Report. Retrieved on 13 September 2017 from
http://enero.com/images/enero/annual-reports/Enero_Annual_Report_FY16.PDF.
17 Enero Group Limited. 2015. Annual Report. Retrieved on 13 September 2017 from http://www.enero.com/images/enero/annual-
reports/Enero_Annual_Report_FY15.pdf.
INTRODUCTION TO ACCOUNTING AND FINANCE 11
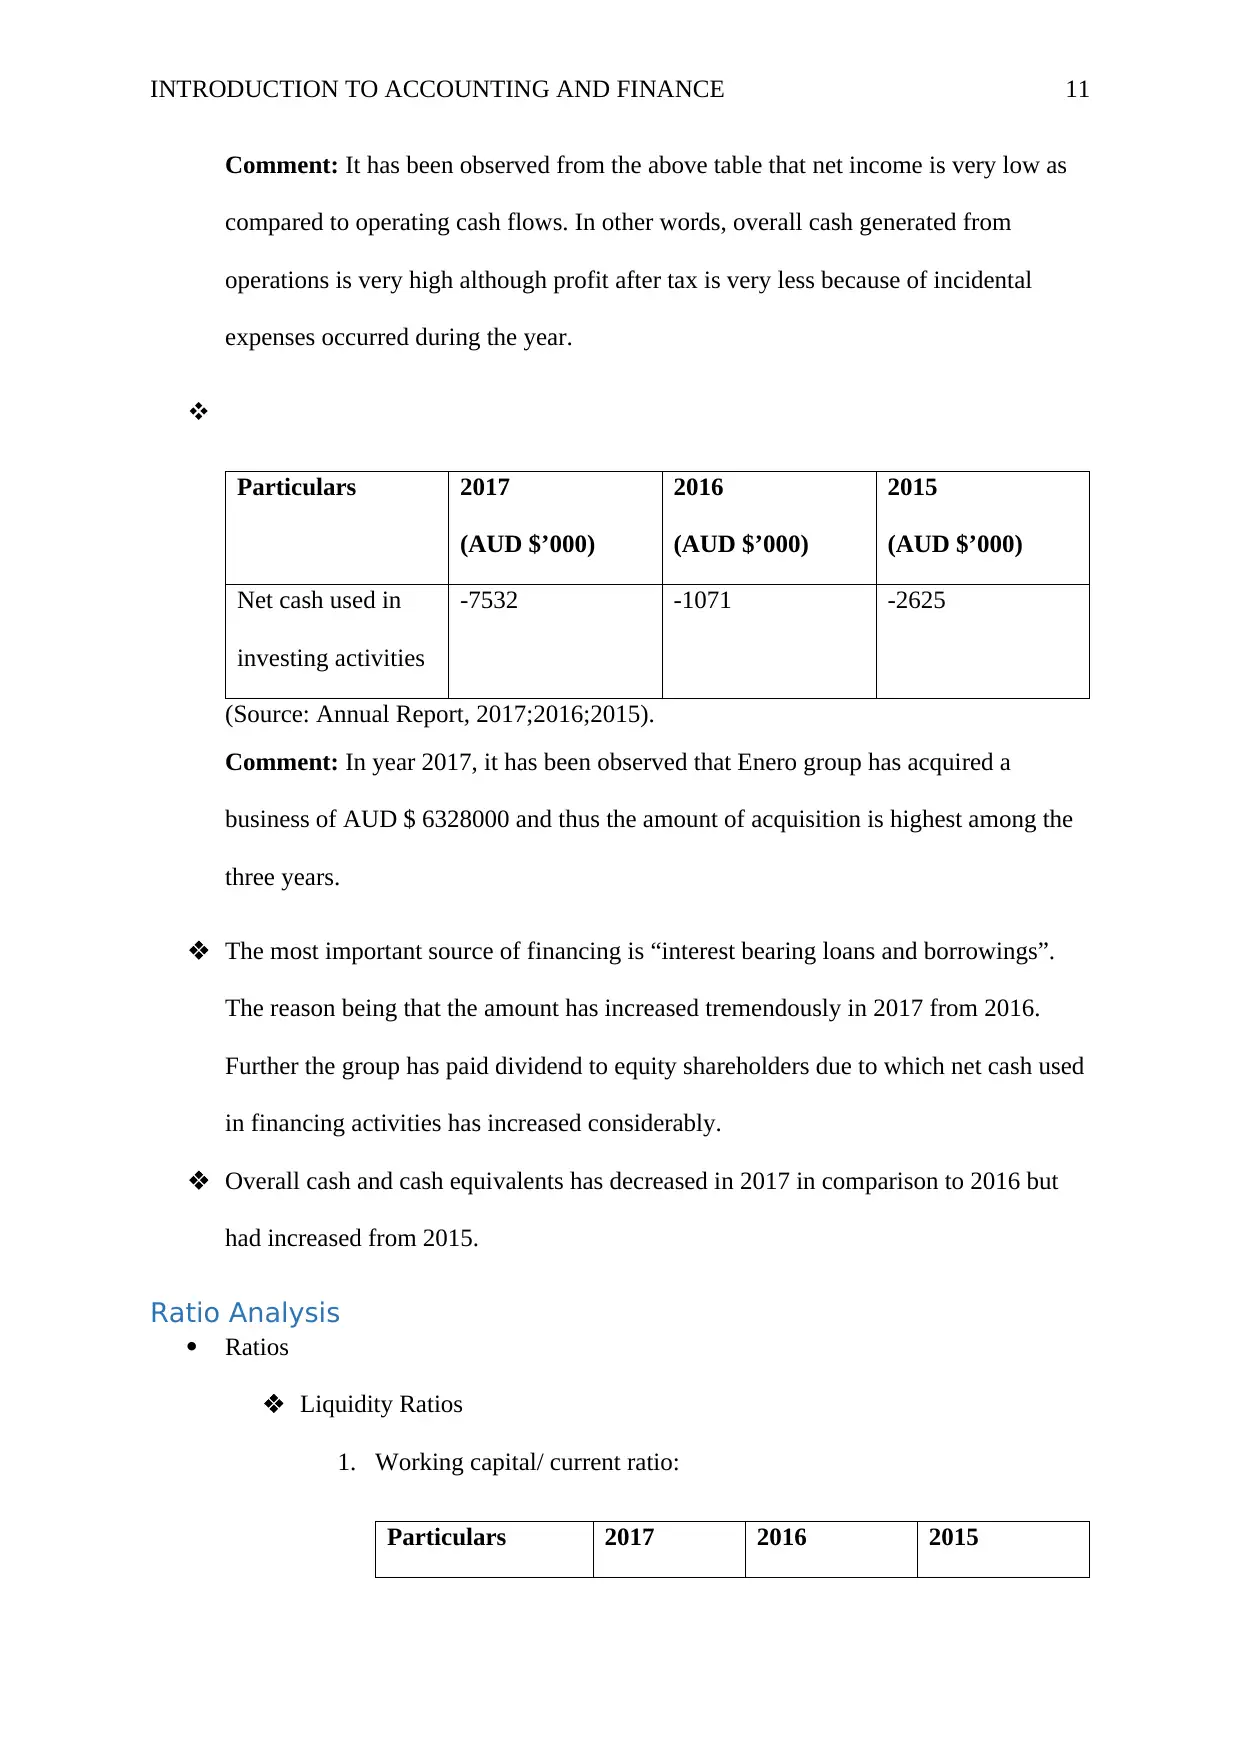
Comment: It has been observed from the above table that net income is very low as
compared to operating cash flows. In other words, overall cash generated from
operations is very high although profit after tax is very less because of incidental
expenses occurred during the year.
Particulars 2017
(AUD $’000)
2016
(AUD $’000)
2015
(AUD $’000)
Net cash used in
investing activities
-7532 -1071 -2625
(Source: Annual Report, 2017;2016;2015).
Comment: In year 2017, it has been observed that Enero group has acquired a
business of AUD $ 6328000 and thus the amount of acquisition is highest among the
three years.
The most important source of financing is “interest bearing loans and borrowings”.
The reason being that the amount has increased tremendously in 2017 from 2016.
Further the group has paid dividend to equity shareholders due to which net cash used
in financing activities has increased considerably.
Overall cash and cash equivalents has decreased in 2017 in comparison to 2016 but
had increased from 2015.
Ratio Analysis
Ratios
Liquidity Ratios
1. Working capital/ current ratio:
Particulars 2017 2016 2015
⊘ This is a preview!⊘
Do you want full access?
Subscribe today to unlock all pages.
Trusted by 1+ million students worldwide
1 out of 24
Related Documents


Your All-in-One AI-Powered Toolkit for Academic Success.
+13062052269
info@desklib.com
Available 24*7 on WhatsApp / Email
![[object Object]](/_next/static/media/star-bottom.7253800d.svg)
Unlock your academic potential
Copyright © 2020–2026 A2Z Services. All Rights Reserved. Developed and managed by ZUCOL.