Engineering Management: Financial Analysis & Real Estate Valuation
VerifiedAdded on 2023/06/03
|14
|2695
|145
Report
AI Summary
This report presents a financial analysis of a residential complex development project, utilizing real estate valuation principles. It considers development costs, revenue escalation, and finance costs to determine future cash flows from the developer's perspective, including the potential sale to John Wiley Pty Ltd. The analysis evaluates the developer's profit and return, incorporating scenario analysis (optimistic and pessimistic) and assessing the impact of changing debt-equity ratios. Key findings include the total development cost of $486.07 million, a project financing cost based on a 12% interest rate, and an initial project development yield of 36%. The report also examines the potential sale of the facility for $900 million after 10 years, resulting in a net present value of $1052 million for John Wiley Pty Ltd. Risk factors such as financial risk, cost escalation, and macroeconomic conditions are discussed, with a sensitivity analysis conducted to assess the impact of revenue fluctuations.
Running head: Engineering Management
Engineering Management
Name of the Student:
Name of the University:
Author’s Note:
Engineering Management
Name of the Student:
Name of the University:
Author’s Note:
Paraphrase This Document
Need a fresh take? Get an instant paraphrase of this document with our AI Paraphraser
1ENGINEERING MANAGEMENT
Executive Summary
The aim of the project is to conduct a financial analysis of a Development project where the
same is executed with the real estate valuation principles and techniques. The development
cost and the other key input costs were taken into account while the cash flows associated
with the same were revaluated. The project was analysed from the developers prospective and
the sale of the asset class was also shown to John Wiley Pty Ltd. The developers profit ad the
return generated by each of them is evaluated. The scenario analysis and the changing debt
effect has helped us evaluate the key sensitive components of the project.
2ENGINEERING MANAGEMENT
Table of Contents
Introduction................................................................................................................................3
Discussion..................................................................................................................................3
Part A.....................................................................................................................................3
Part B......................................................................................................................................7
Part C......................................................................................................................................9
Part D.....................................................................................................................................9
Part E....................................................................................................................................10
Conclusion................................................................................................................................11
Reference..................................................................................................................................12
⊘ This is a preview!⊘
Do you want full access?
Subscribe today to unlock all pages.
Trusted by 1+ million students worldwide
3ENGINEERING MANAGEMENT
Introduction
The Financial evaluation and analysis has helped us evaluate the key concept of real
estate valuation. The proposed Sub Division Residential Complex Development Project
evaluation composed of evaluating the total development costs and the same was accounted
using factors given like annual escalation in revenue and costs and the same was used for
determining the future cash flows for the company. The key assumption used in the project
was the total development cost to be considered as the final and all total cost for the
development of the project basis on which the finance costs was also computed. The scenario
analysis has two factors evaluated one is the optimistic level scenario and the other is the
pessimistic scenario (Yeh and Hsu 2018).
Discussion
Part A
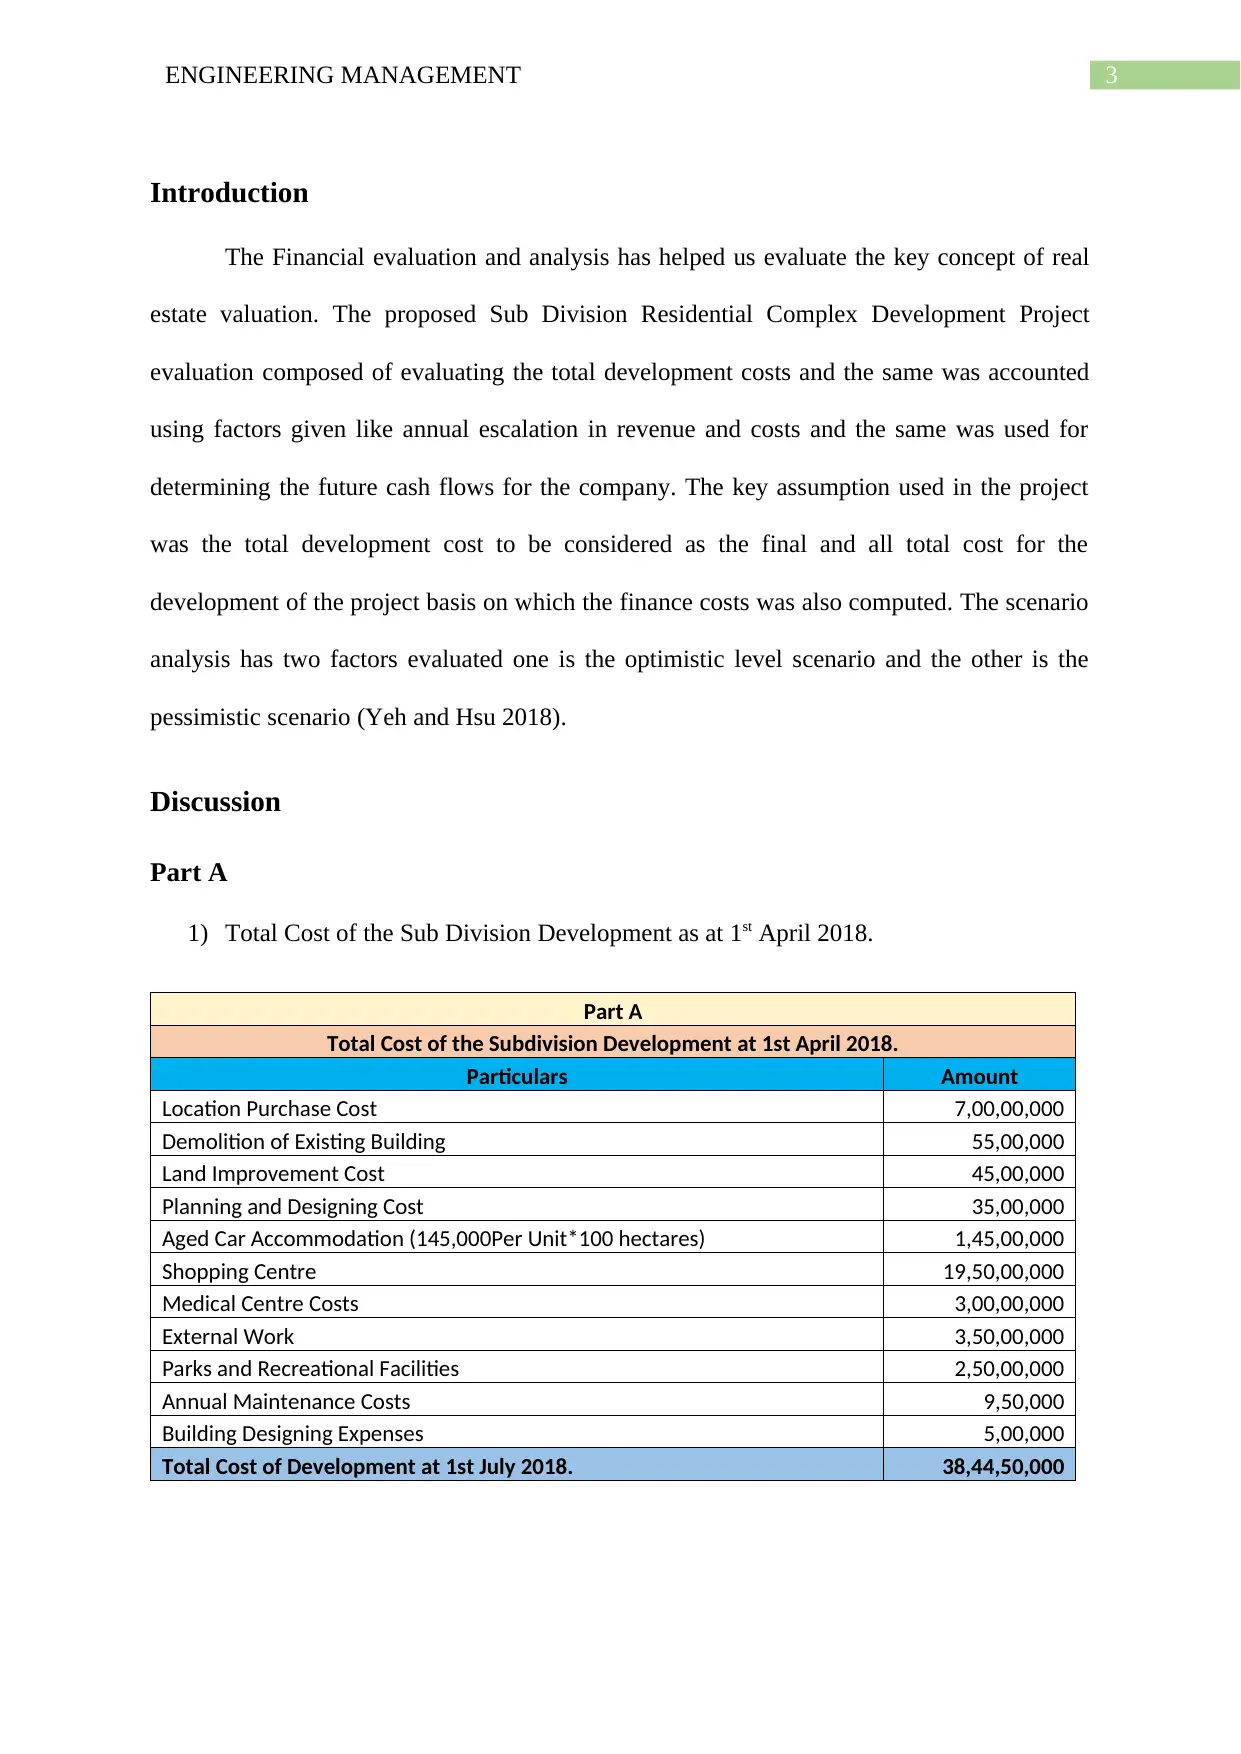
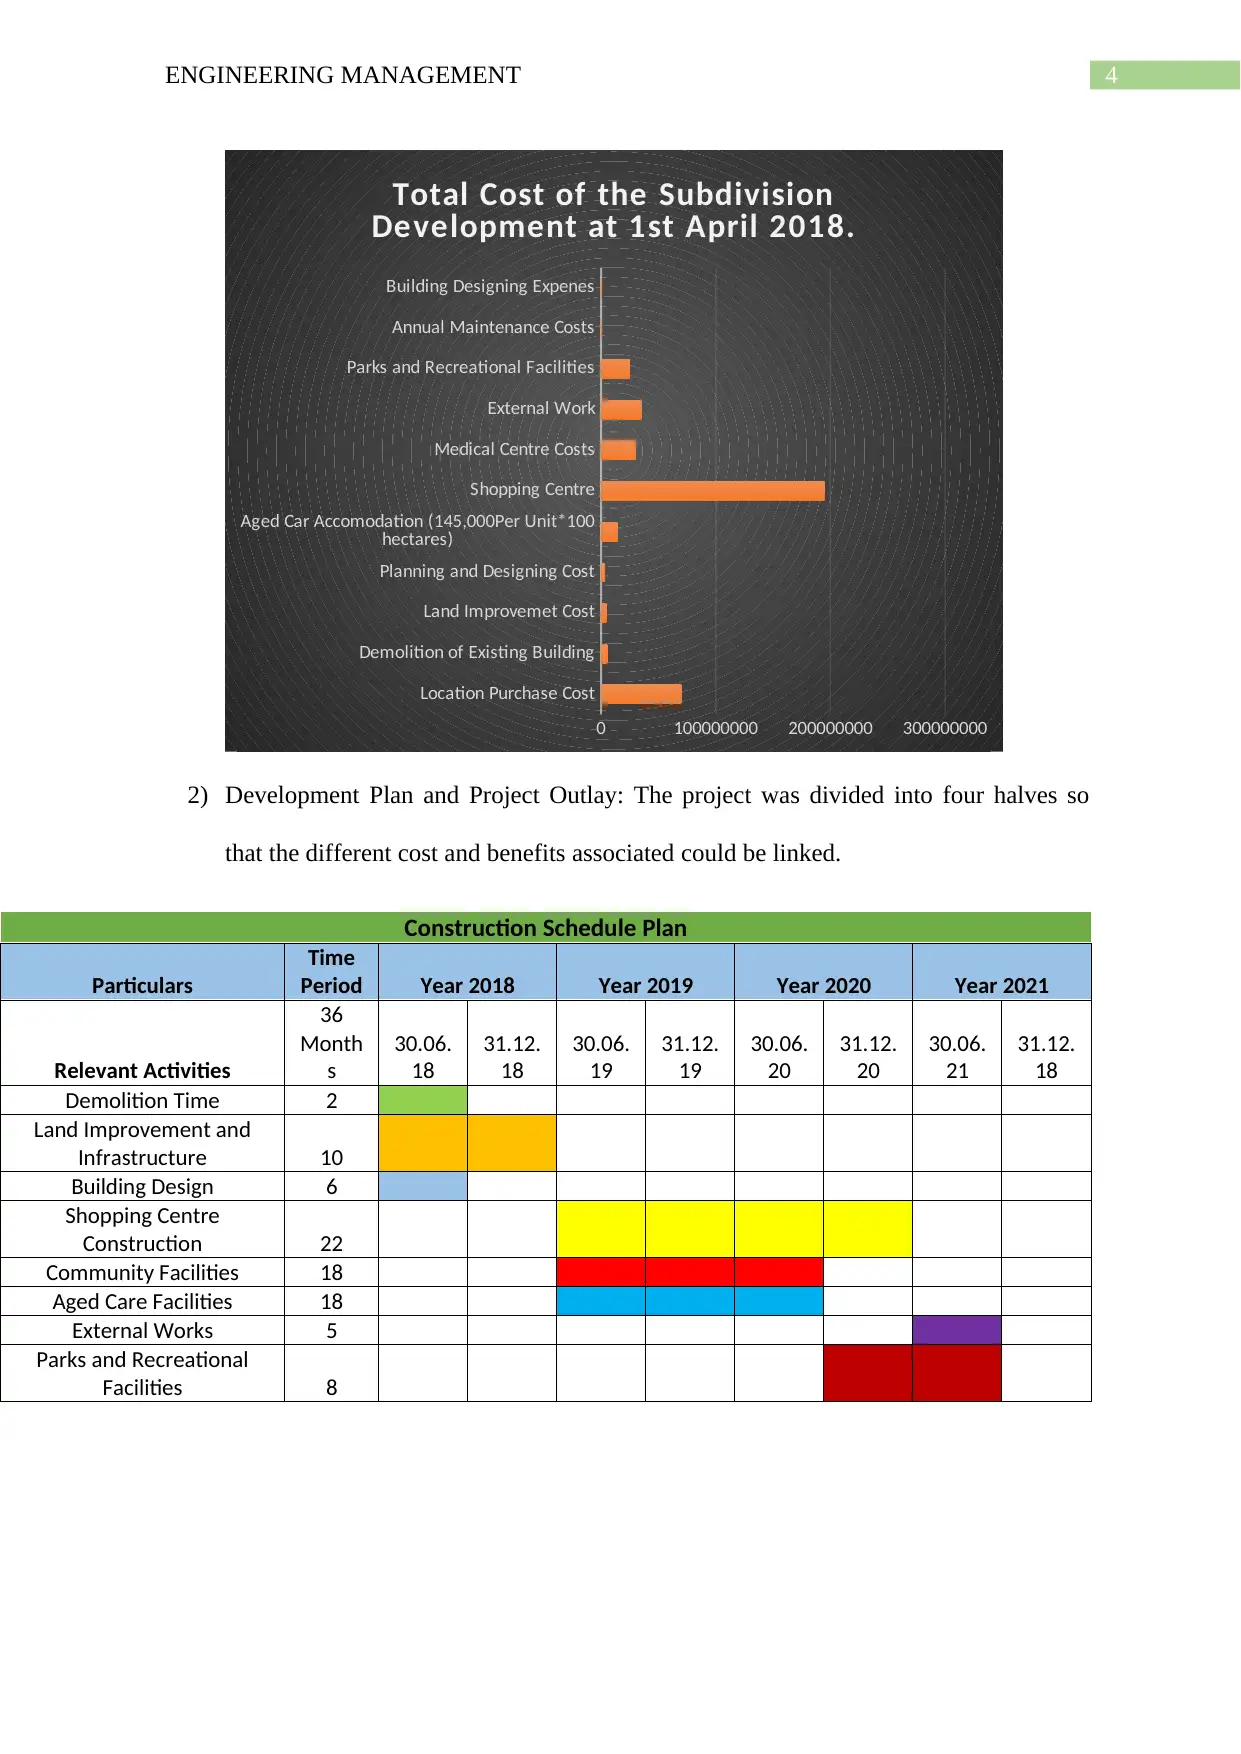
1) Total Cost of the Sub Division Development as at 1st April 2018.
Part A
Total Cost of the Subdivision Development at 1st April 2018.
Particulars Amount
Location Purchase Cost 7,00,00,000
Demolition of Existing Building 55,00,000
Land Improvement Cost 45,00,000
Planning and Designing Cost 35,00,000
Aged Car Accommodation (145,000Per Unit*100 hectares) 1,45,00,000
Shopping Centre 19,50,00,000
Medical Centre Costs 3,00,00,000
External Work 3,50,00,000
Parks and Recreational Facilities 2,50,00,000
Annual Maintenance Costs 9,50,000
Building Designing Expenses 5,00,000
Total Cost of Development at 1st July 2018. 38,44,50,000
Introduction
The Financial evaluation and analysis has helped us evaluate the key concept of real
estate valuation. The proposed Sub Division Residential Complex Development Project
evaluation composed of evaluating the total development costs and the same was accounted
using factors given like annual escalation in revenue and costs and the same was used for
determining the future cash flows for the company. The key assumption used in the project
was the total development cost to be considered as the final and all total cost for the
development of the project basis on which the finance costs was also computed. The scenario
analysis has two factors evaluated one is the optimistic level scenario and the other is the
pessimistic scenario (Yeh and Hsu 2018).
Discussion
Part A
1) Total Cost of the Sub Division Development as at 1st April 2018.
Part A
Total Cost of the Subdivision Development at 1st April 2018.
Particulars Amount
Location Purchase Cost 7,00,00,000
Demolition of Existing Building 55,00,000
Land Improvement Cost 45,00,000
Planning and Designing Cost 35,00,000
Aged Car Accommodation (145,000Per Unit*100 hectares) 1,45,00,000
Shopping Centre 19,50,00,000
Medical Centre Costs 3,00,00,000
External Work 3,50,00,000
Parks and Recreational Facilities 2,50,00,000
Annual Maintenance Costs 9,50,000
Building Designing Expenses 5,00,000
Total Cost of Development at 1st July 2018. 38,44,50,000
Paraphrase This Document
Need a fresh take? Get an instant paraphrase of this document with our AI Paraphraser
4ENGINEERING MANAGEMENT
Location Purchase Cost
Demolition of Existing Building
Land Improvemet Cost
Planning and Designing Cost
Aged Car Accomodation (145,000Per Unit*100
hectares)
Shopping Centre
Medical Centre Costs
External Work
Parks and Recreational Facilities
Annual Maintenance Costs
Building Designing Expenes
0 100000000 200000000 300000000
Total Cost of the Subdivision
Development at 1st April 2018.
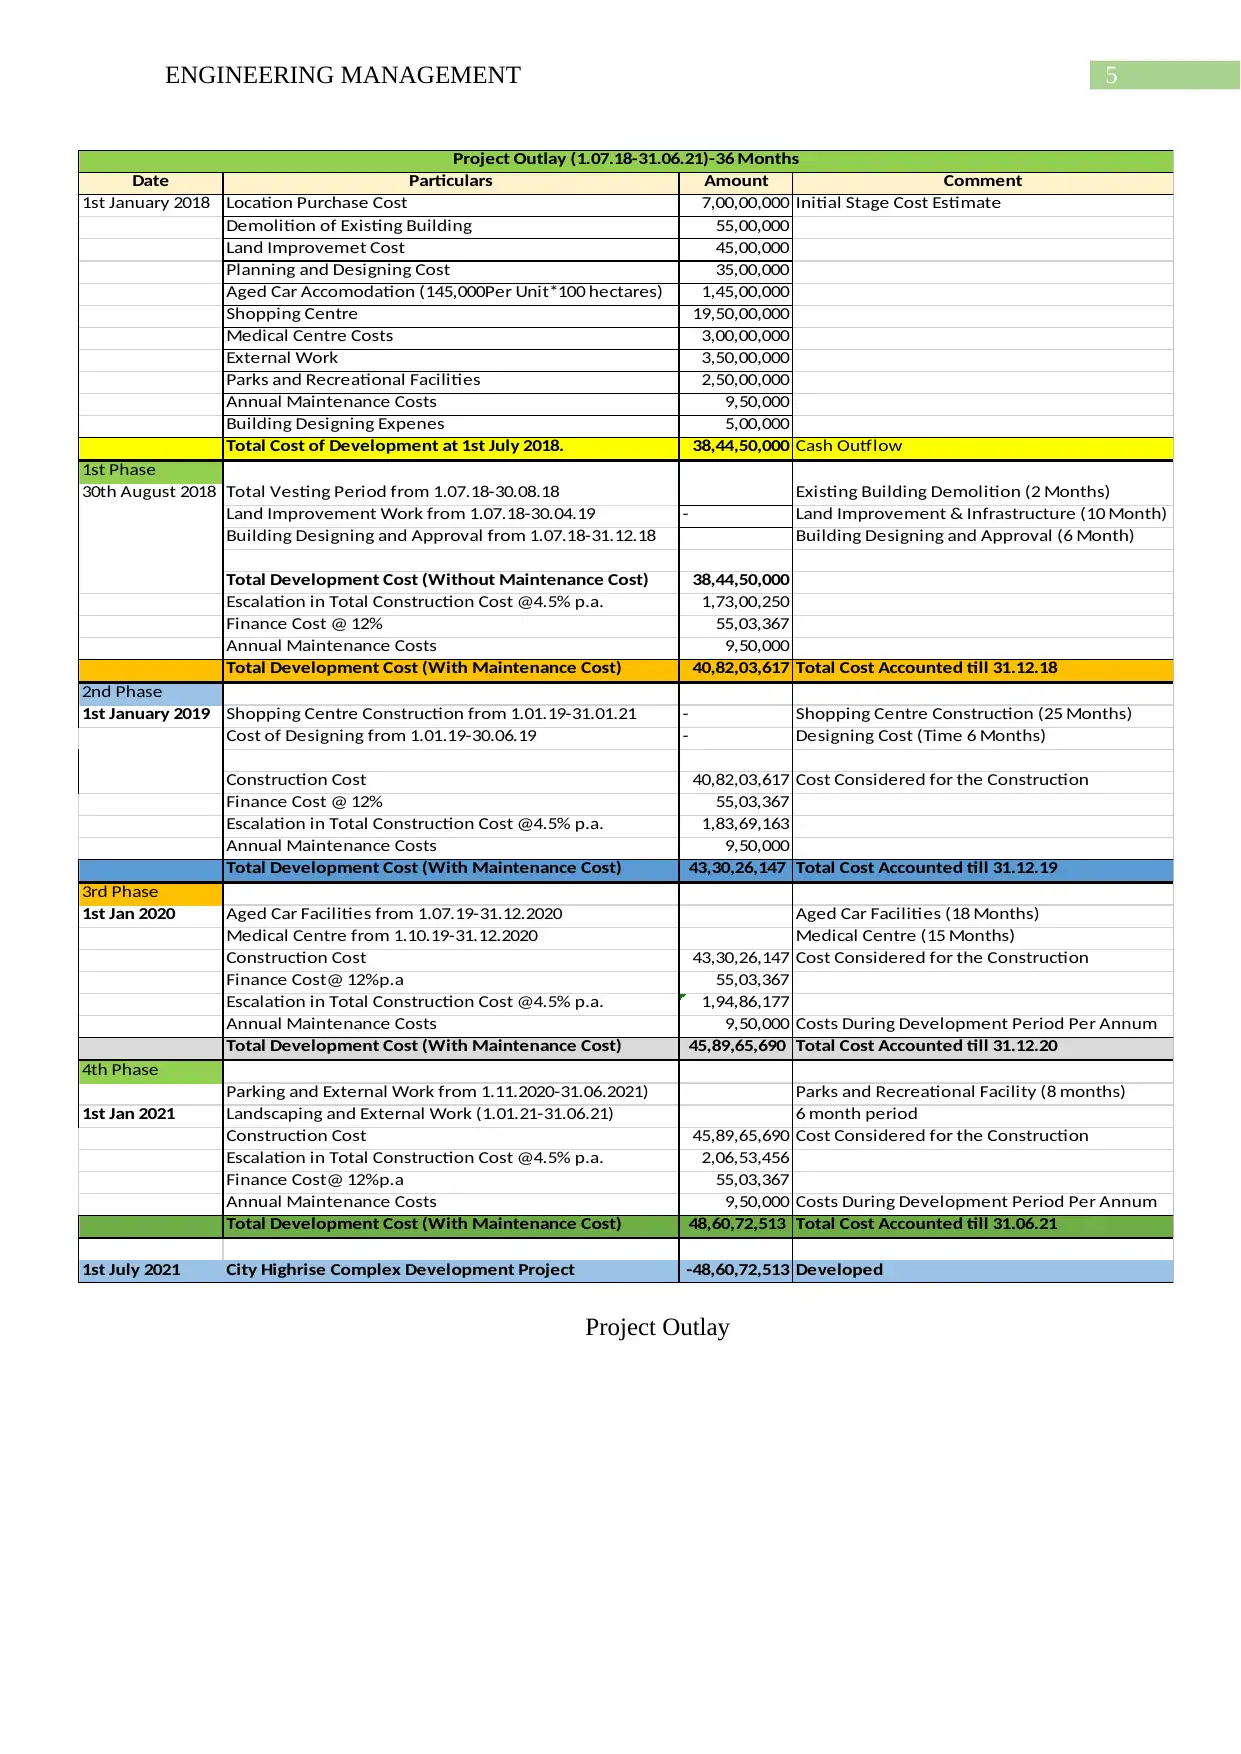
2) Development Plan and Project Outlay: The project was divided into four halves so
that the different cost and benefits associated could be linked.
Construction Schedule Plan
Particulars
Time
Period Year 2018 Year 2019 Year 2020 Year 2021
Relevant Activities
36
Month
s
30.06.
18
31.12.
18
30.06.
19
31.12.
19
30.06.
20
31.12.
20
30.06.
21
31.12.
18
Demolition Time 2
Land Improvement and
Infrastructure 10
Building Design 6
Shopping Centre
Construction 22
Community Facilities 18
Aged Care Facilities 18
External Works 5
Parks and Recreational
Facilities 8
Location Purchase Cost
Demolition of Existing Building
Land Improvemet Cost
Planning and Designing Cost
Aged Car Accomodation (145,000Per Unit*100
hectares)
Shopping Centre
Medical Centre Costs
External Work
Parks and Recreational Facilities
Annual Maintenance Costs
Building Designing Expenes
0 100000000 200000000 300000000
Total Cost of the Subdivision
Development at 1st April 2018.
2) Development Plan and Project Outlay: The project was divided into four halves so
that the different cost and benefits associated could be linked.
Construction Schedule Plan
Particulars
Time
Period Year 2018 Year 2019 Year 2020 Year 2021
Relevant Activities
36
Month
s
30.06.
18
31.12.
18
30.06.
19
31.12.
19
30.06.
20
31.12.
20
30.06.
21
31.12.
18
Demolition Time 2
Land Improvement and
Infrastructure 10
Building Design 6
Shopping Centre
Construction 22
Community Facilities 18
Aged Care Facilities 18
External Works 5
Parks and Recreational
Facilities 8
5ENGINEERING MANAGEMENT
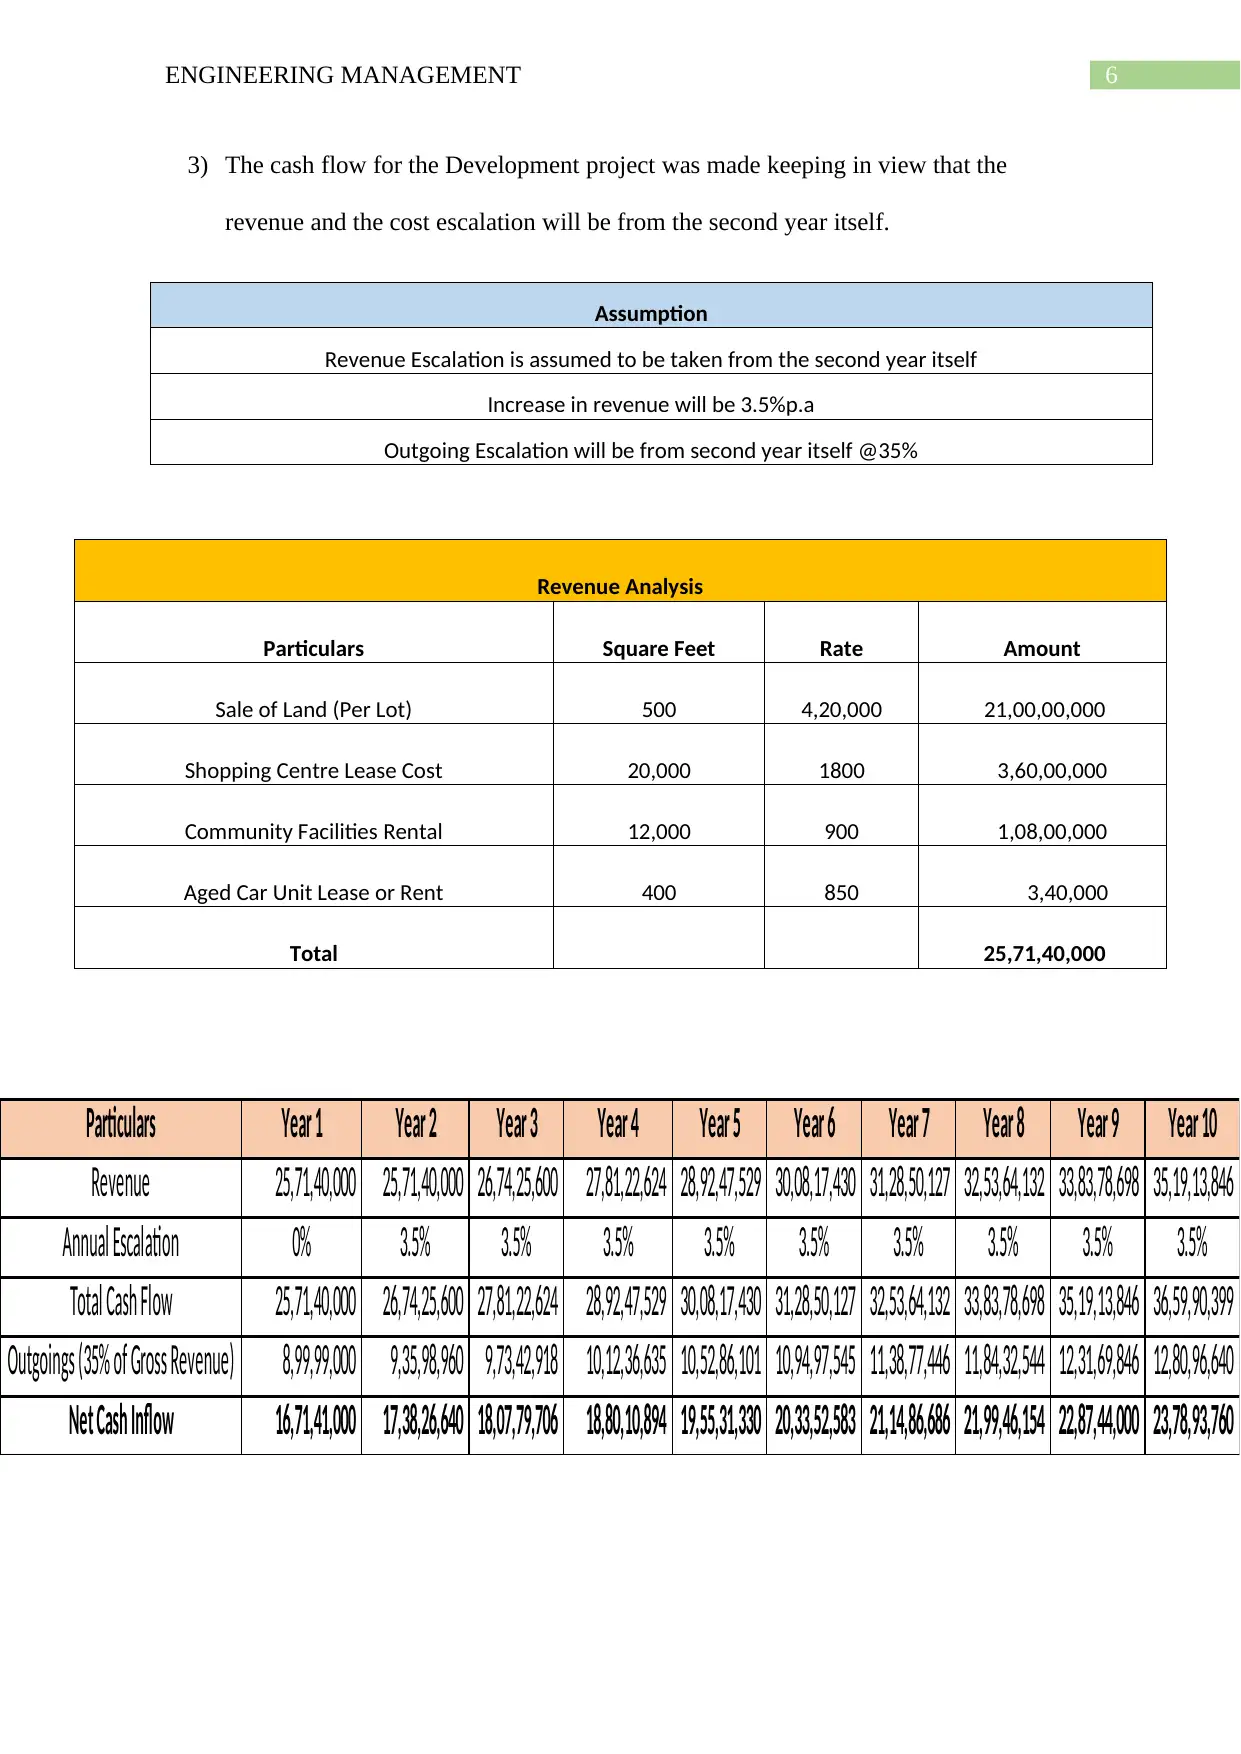
Project Outlay
Date Particulars Amount Comment
1st January 2018 Location Purchase Cost 7,00,00,000 Initial Stage Cost Estimate
Demolition of Existing Building 55,00,000
Land Improvemet Cost 45,00,000
Planning and Designing Cost 35,00,000
Aged Car Accomodation (145,000Per Unit*100 hectares) 1,45,00,000
Shopping Centre 19,50,00,000
Medical Centre Costs 3,00,00,000
External Work 3,50,00,000
Parks and Recreational Facilities 2,50,00,000
Annual Maintenance Costs 9,50,000
Building Designing Expenes 5,00,000
Total Cost of Development at 1st July 2018. 38,44,50,000 Cash Outflow
1st Phase
30th August 2018 Total Vesting Period from 1.07.18-30.08.18 Existing Building Demolition (2 Months)
Land Improvement Work from 1.07.18-30.04.19 - Land Improvement & Infrastructure (10 Month)
Building Designing and Approval from 1.07.18-31.12.18 Building Designing and Approval (6 Month)
Total Development Cost (Without Maintenance Cost) 38,44,50,000
Escalation in Total Construction Cost @4.5% p.a. 1,73,00,250
Finance Cost @ 12% 55,03,367
Annual Maintenance Costs 9,50,000
Total Development Cost (With Maintenance Cost) 40,82,03,617 Total Cost Accounted till 31.12.18
2nd Phase
1st January 2019 Shopping Centre Construction from 1.01.19-31.01.21 - Shopping Centre Construction (25 Months)
Cost of Designing from 1.01.19-30.06.19 - Designing Cost (Time 6 Months)
Construction Cost 40,82,03,617 Cost Considered for the Construction
Finance Cost @ 12% 55,03,367
Escalation in Total Construction Cost @4.5% p.a. 1,83,69,163
Annual Maintenance Costs 9,50,000
Total Development Cost (With Maintenance Cost) 43,30,26,147 Total Cost Accounted till 31.12.19
3rd Phase
1st Jan 2020 Aged Car Facilities from 1.07.19-31.12.2020 Aged Car Facilities (18 Months)
Medical Centre from 1.10.19-31.12.2020 Medical Centre (15 Months)
Construction Cost 43,30,26,147 Cost Considered for the Construction
Finance Cost@ 12%p.a 55,03,367
Escalation in Total Construction Cost @4.5% p.a. 1,94,86,177
Annual Maintenance Costs 9,50,000 Costs During Development Period Per Annum
Total Development Cost (With Maintenance Cost) 45,89,65,690 Total Cost Accounted till 31.12.20
4th Phase
Parking and External Work from 1.11.2020-31.06.2021) Parks and Recreational Facility (8 months)
1st Jan 2021 Landscaping and External Work (1.01.21-31.06.21) 6 month period
Construction Cost 45,89,65,690 Cost Considered for the Construction
Escalation in Total Construction Cost @4.5% p.a. 2,06,53,456
Finance Cost@ 12%p.a 55,03,367
Annual Maintenance Costs 9,50,000 Costs During Development Period Per Annum
Total Development Cost (With Maintenance Cost) 48,60,72,513 Total Cost Accounted till 31.06.21
1st July 2021 City Highrise Complex Development Project -48,60,72,513 Developed
Project Outlay (1.07.18-31.06.21)-36 Months
⊘ This is a preview!⊘
Do you want full access?
Subscribe today to unlock all pages.
Trusted by 1+ million students worldwide
6ENGINEERING MANAGEMENT
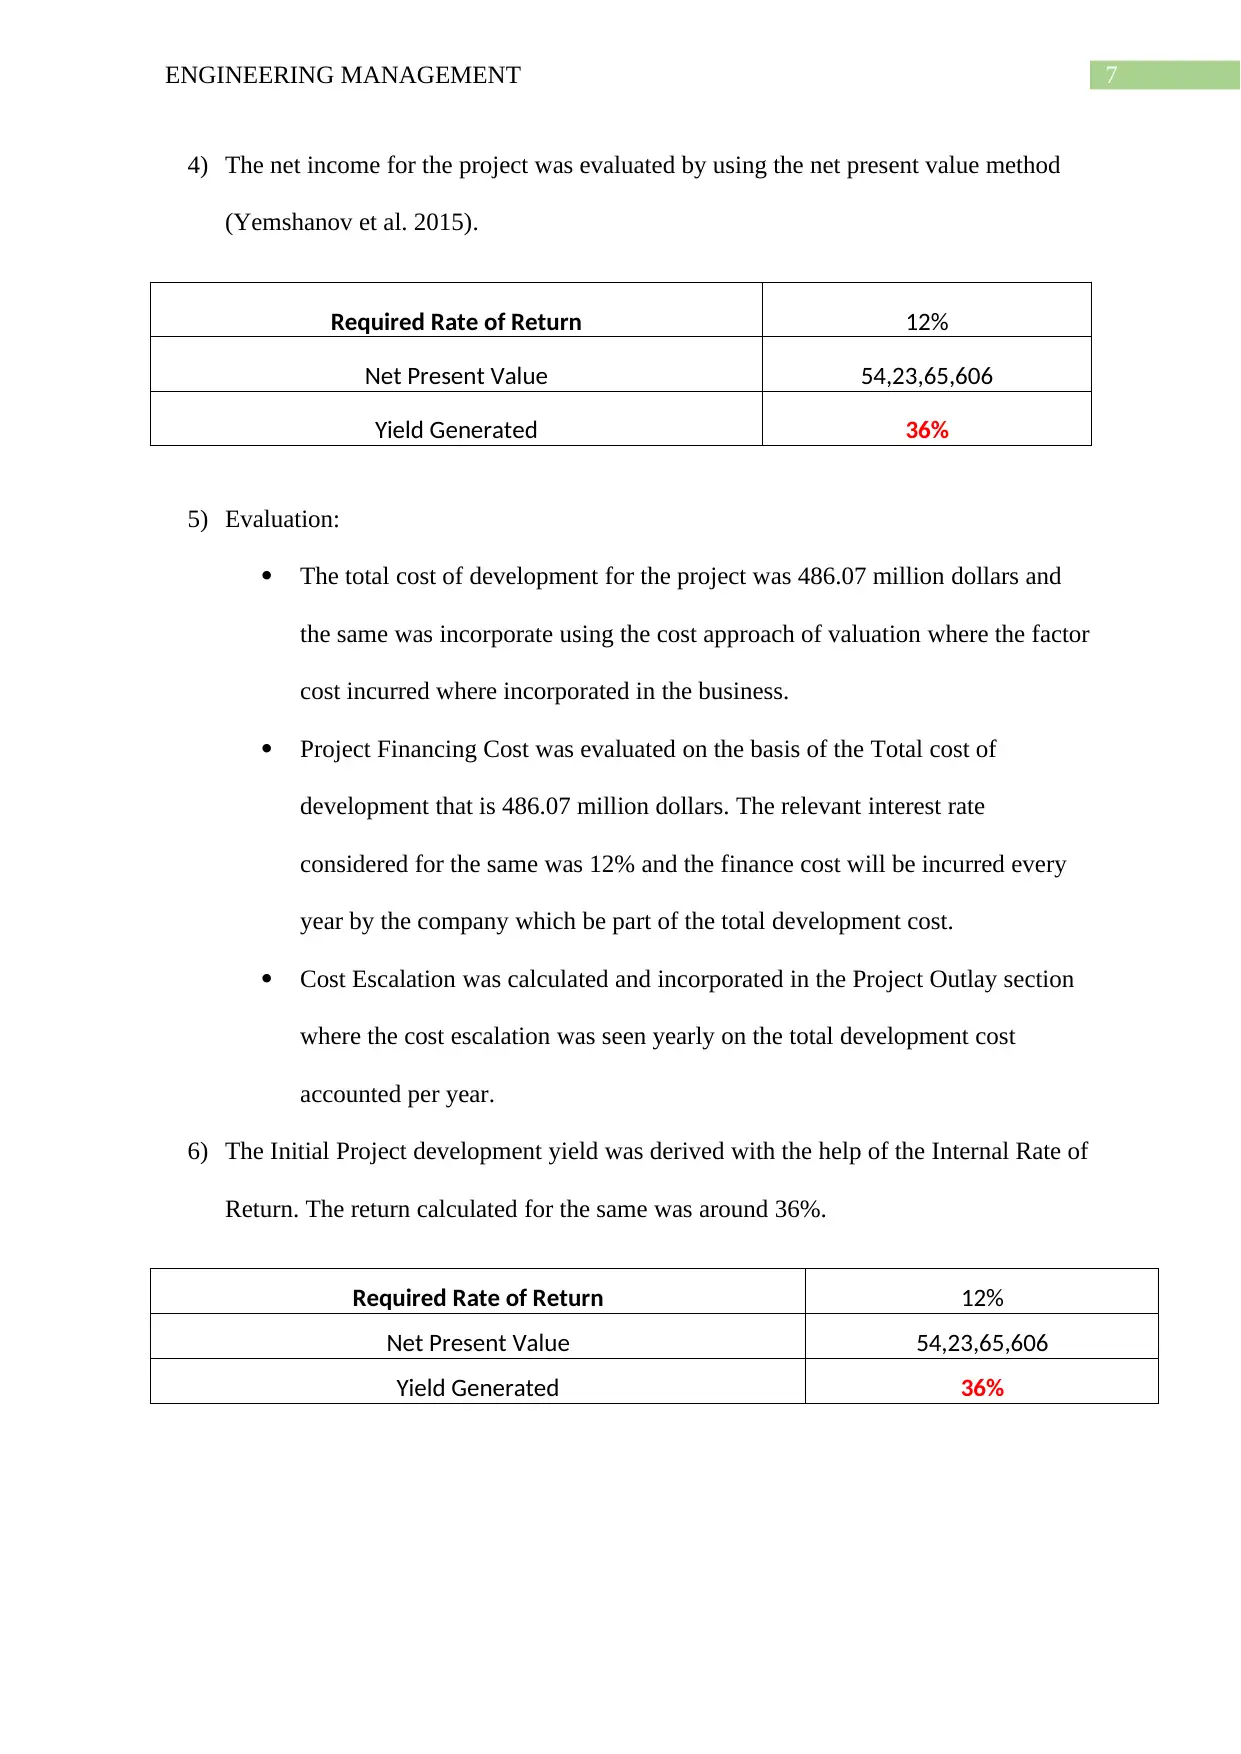
3) The cash flow for the Development project was made keeping in view that the
revenue and the cost escalation will be from the second year itself.
Assumption
Revenue Escalation is assumed to be taken from the second year itself
Increase in revenue will be 3.5%p.a
Outgoing Escalation will be from second year itself @35%
Revenue Analysis
Particulars Square Feet Rate Amount
Sale of Land (Per Lot) 500 4,20,000 21,00,00,000
Shopping Centre Lease Cost 20,000 1800 3,60,00,000
Community Facilities Rental 12,000 900 1,08,00,000
Aged Car Unit Lease or Rent 400 850 3,40,000
Total 25,71,40,000
Particulars Year 1 Year 2 Year 3 Year 4 Year 5 Year 6 Year 7 Year 8 Year 9 Year 10
Revenue 25,71,40,000 25,71,40,000 26,74,25,600 27,81,22,624 28,92,47,529 30,08,17,430 31,28,50,127 32,53,64,132 33,83,78,698 35,19,13,846
Annual Escalation 0% 3.5% 3.5% 3.5% 3.5% 3.5% 3.5% 3.5% 3.5% 3.5%
Total Cash Flow 25,71,40,000 26,74,25,600 27,81,22,624 28,92,47,529 30,08,17,430 31,28,50,127 32,53,64,132 33,83,78,698 35,19,13,846 36,59,90,399
Outgoings (35% of Gross Revenue) 8,99,99,000 9,35,98,960 9,73,42,918 10,12,36,635 10,52,86,101 10,94,97,545 11,38,77,446 11,84,32,544 12,31,69,846 12,80,96,640
Net Cash Inflow 16,71,41,000 17,38,26,640 18,07,79,706 18,80,10,894 19,55,31,330 20,33,52,583 21,14,86,686 21,99,46,154 22,87,44,000 23,78,93,760
Paraphrase This Document
Need a fresh take? Get an instant paraphrase of this document with our AI Paraphraser
7ENGINEERING MANAGEMENT
4) The net income for the project was evaluated by using the net present value method
(Yemshanov et al. 2015).
Required Rate of Return 12%
Net Present Value 54,23,65,606
Yield Generated 36%
5) Evaluation:
The total cost of development for the project was 486.07 million dollars and
the same was incorporate using the cost approach of valuation where the factor
cost incurred where incorporated in the business.
Project Financing Cost was evaluated on the basis of the Total cost of
development that is 486.07 million dollars. The relevant interest rate
considered for the same was 12% and the finance cost will be incurred every
year by the company which be part of the total development cost.
Cost Escalation was calculated and incorporated in the Project Outlay section
where the cost escalation was seen yearly on the total development cost
accounted per year.
6) The Initial Project development yield was derived with the help of the Internal Rate of
Return. The return calculated for the same was around 36%.
Required Rate of Return 12%
Net Present Value 54,23,65,606
Yield Generated 36%
8ENGINEERING MANAGEMENT
Part B
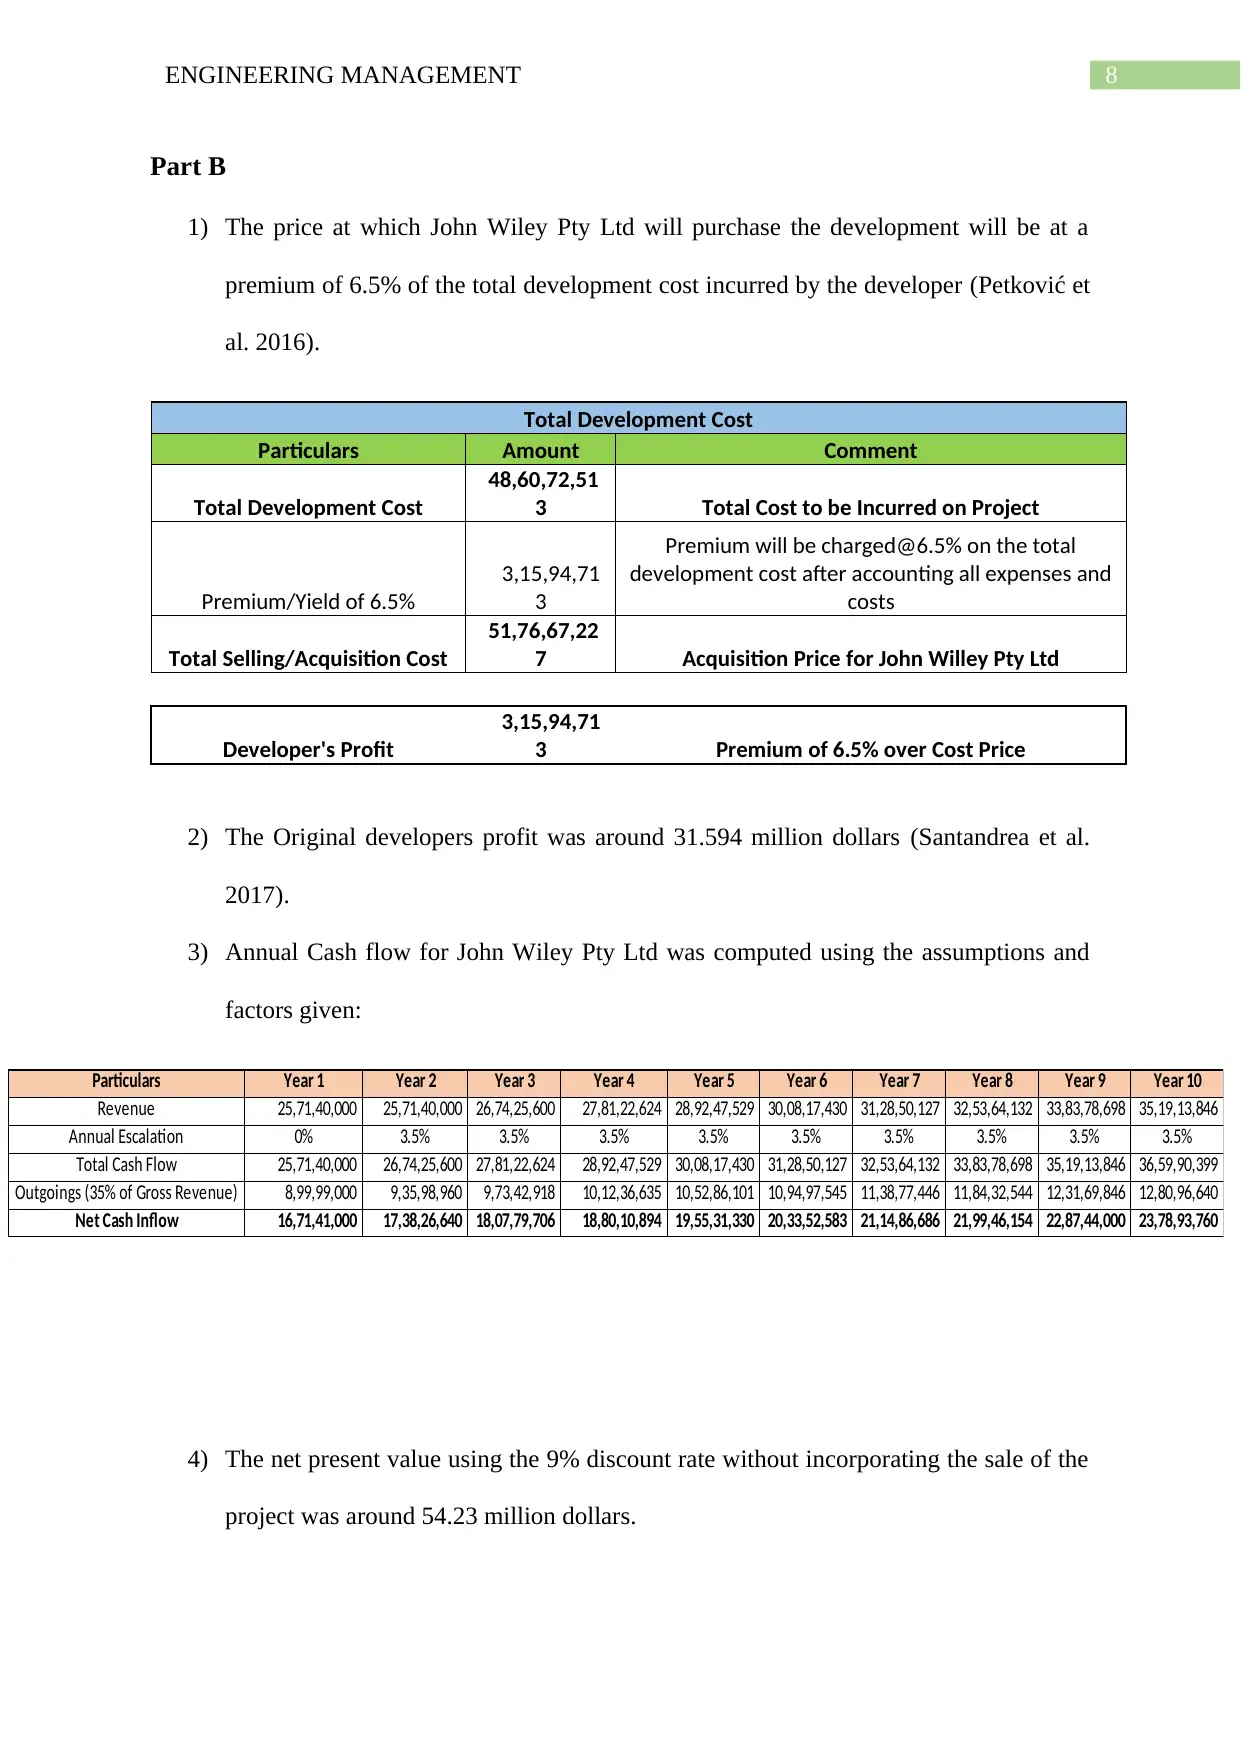
1) The price at which John Wiley Pty Ltd will purchase the development will be at a
premium of 6.5% of the total development cost incurred by the developer (Petković et
al. 2016).
Total Development Cost
Particulars Amount Comment
Total Development Cost
48,60,72,51
3 Total Cost to be Incurred on Project
Premium/Yield of 6.5%
3,15,94,71
3
Premium will be charged@6.5% on the total
development cost after accounting all expenses and
costs
Total Selling/Acquisition Cost
51,76,67,22
7 Acquisition Price for John Willey Pty Ltd
Developer's Profit
3,15,94,71
3 Premium of 6.5% over Cost Price
2) The Original developers profit was around 31.594 million dollars (Santandrea et al.
2017).
3) Annual Cash flow for John Wiley Pty Ltd was computed using the assumptions and
factors given:
4) The net present value using the 9% discount rate without incorporating the sale of the
project was around 54.23 million dollars.
Particulars Year 1 Year 2 Year 3 Year 4 Year 5 Year 6 Year 7 Year 8 Year 9 Year 10
Revenue 25,71,40,000 25,71,40,000 26,74,25,600 27,81,22,624 28,92,47,529 30,08,17,430 31,28,50,127 32,53,64,132 33,83,78,698 35,19,13,846
Annual Escalation 0% 3.5% 3.5% 3.5% 3.5% 3.5% 3.5% 3.5% 3.5% 3.5%
Total Cash Flow 25,71,40,000 26,74,25,600 27,81,22,624 28,92,47,529 30,08,17,430 31,28,50,127 32,53,64,132 33,83,78,698 35,19,13,846 36,59,90,399
Outgoings (35% of Gross Revenue) 8,99,99,000 9,35,98,960 9,73,42,918 10,12,36,635 10,52,86,101 10,94,97,545 11,38,77,446 11,84,32,544 12,31,69,846 12,80,96,640
Net Cash Inflow 16,71,41,000 17,38,26,640 18,07,79,706 18,80,10,894 19,55,31,330 20,33,52,583 21,14,86,686 21,99,46,154 22,87,44,000 23,78,93,760
Part B
1) The price at which John Wiley Pty Ltd will purchase the development will be at a
premium of 6.5% of the total development cost incurred by the developer (Petković et
al. 2016).
Total Development Cost
Particulars Amount Comment
Total Development Cost
48,60,72,51
3 Total Cost to be Incurred on Project
Premium/Yield of 6.5%
3,15,94,71
3
Premium will be charged@6.5% on the total
development cost after accounting all expenses and
costs
Total Selling/Acquisition Cost
51,76,67,22
7 Acquisition Price for John Willey Pty Ltd
Developer's Profit
3,15,94,71
3 Premium of 6.5% over Cost Price
2) The Original developers profit was around 31.594 million dollars (Santandrea et al.
2017).
3) Annual Cash flow for John Wiley Pty Ltd was computed using the assumptions and
factors given:
4) The net present value using the 9% discount rate without incorporating the sale of the
project was around 54.23 million dollars.
Particulars Year 1 Year 2 Year 3 Year 4 Year 5 Year 6 Year 7 Year 8 Year 9 Year 10
Revenue 25,71,40,000 25,71,40,000 26,74,25,600 27,81,22,624 28,92,47,529 30,08,17,430 31,28,50,127 32,53,64,132 33,83,78,698 35,19,13,846
Annual Escalation 0% 3.5% 3.5% 3.5% 3.5% 3.5% 3.5% 3.5% 3.5% 3.5%
Total Cash Flow 25,71,40,000 26,74,25,600 27,81,22,624 28,92,47,529 30,08,17,430 31,28,50,127 32,53,64,132 33,83,78,698 35,19,13,846 36,59,90,399
Outgoings (35% of Gross Revenue) 8,99,99,000 9,35,98,960 9,73,42,918 10,12,36,635 10,52,86,101 10,94,97,545 11,38,77,446 11,84,32,544 12,31,69,846 12,80,96,640
Net Cash Inflow 16,71,41,000 17,38,26,640 18,07,79,706 18,80,10,894 19,55,31,330 20,33,52,583 21,14,86,686 21,99,46,154 22,87,44,000 23,78,93,760
⊘ This is a preview!⊘
Do you want full access?
Subscribe today to unlock all pages.
Trusted by 1+ million students worldwide
9ENGINEERING MANAGEMENT
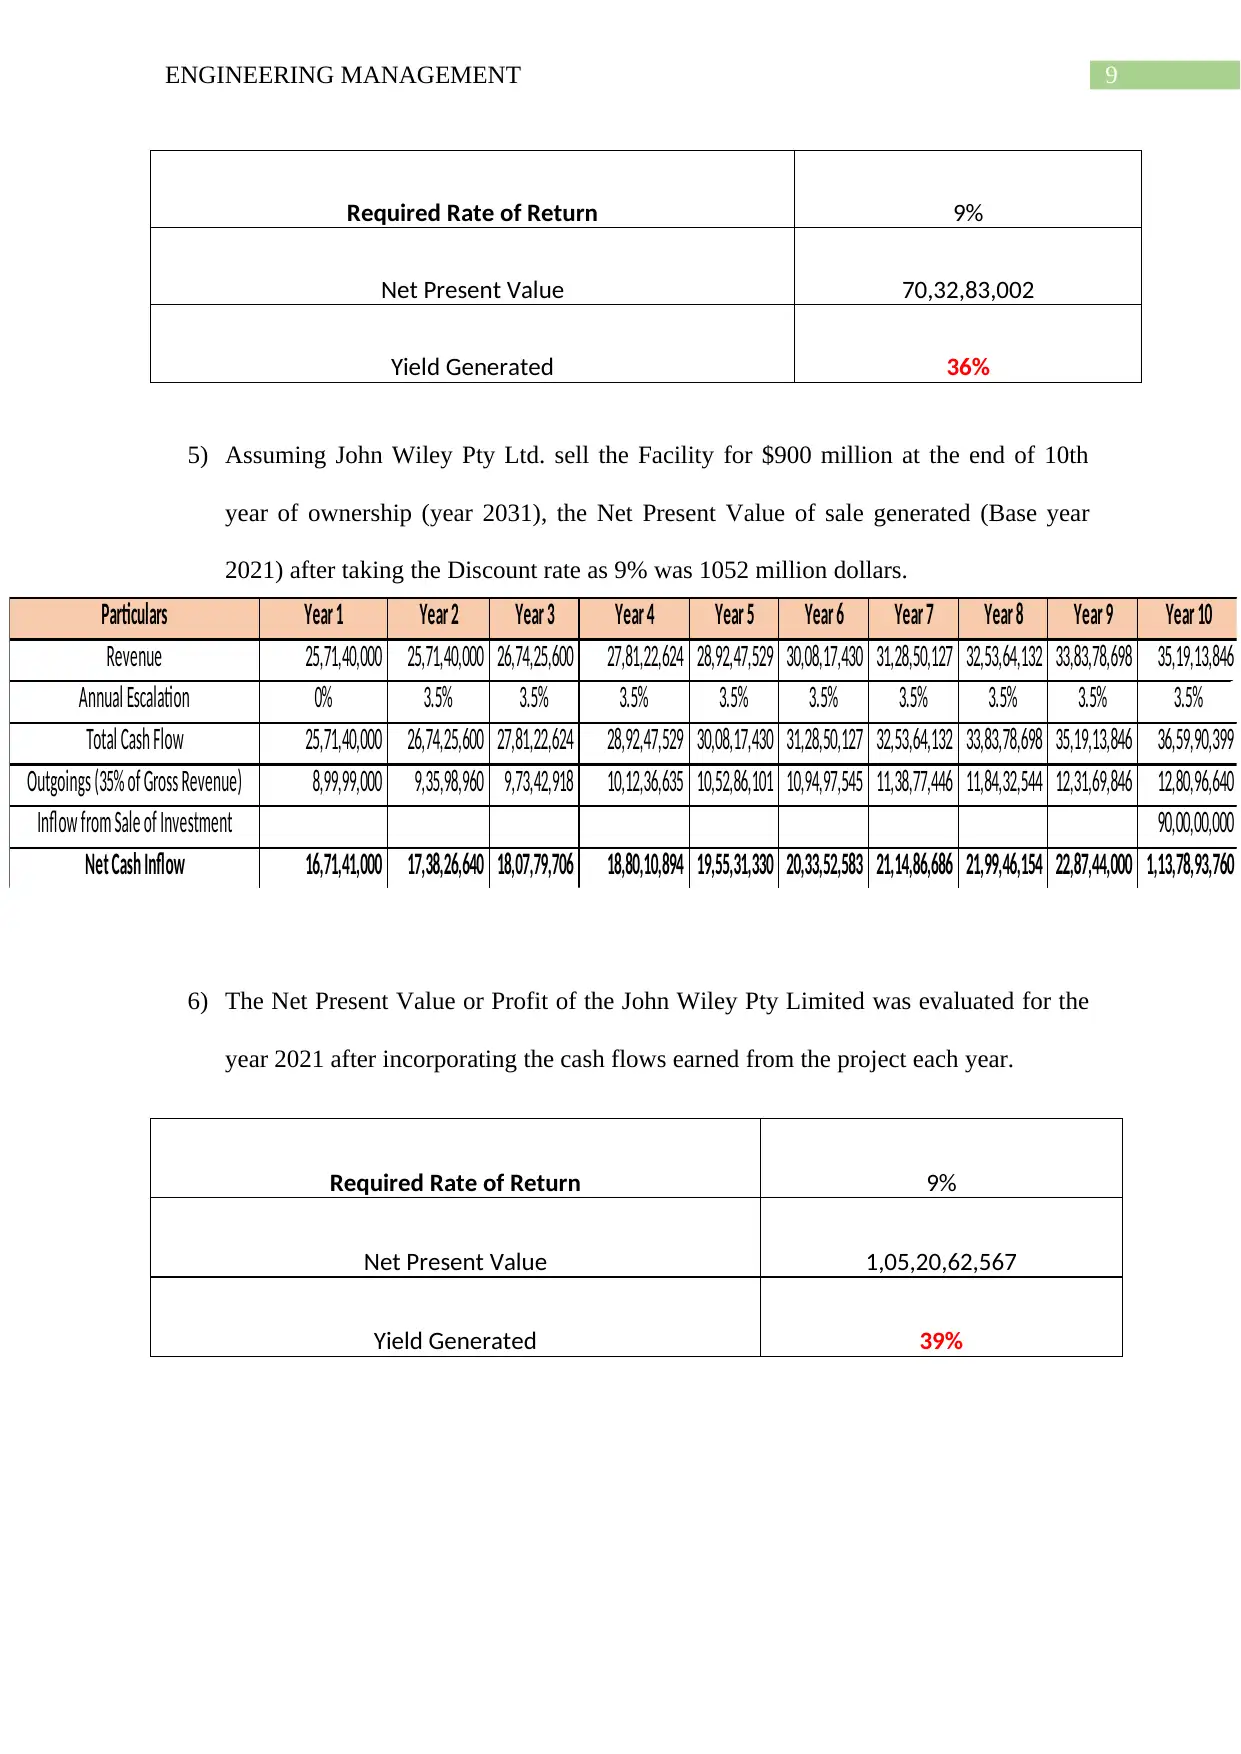
Required Rate of Return 9%
Net Present Value 70,32,83,002
Yield Generated 36%
5) Assuming John Wiley Pty Ltd. sell the Facility for $900 million at the end of 10th
year of ownership (year 2031), the Net Present Value of sale generated (Base year
2021) after taking the Discount rate as 9% was 1052 million dollars.
6) The Net Present Value or Profit of the John Wiley Pty Limited was evaluated for the
year 2021 after incorporating the cash flows earned from the project each year.
Required Rate of Return 9%
Net Present Value 1,05,20,62,567
Yield Generated 39%
Particulars Year 1 Year 2 Year 3 Year 4 Year 5 Year 6 Year 7 Year 8 Year 9 Year 10
Revenue 25,71,40,000 25,71,40,000 26,74,25,600 27,81,22,624 28,92,47,529 30,08,17,430 31,28,50,127 32,53,64,132 33,83,78,698 35,19,13,846
Annual Escalation 0% 3.5% 3.5% 3.5% 3.5% 3.5% 3.5% 3.5% 3.5% 3.5%
Total Cash Flow 25,71,40,000 26,74,25,600 27,81,22,624 28,92,47,529 30,08,17,430 31,28,50,127 32,53,64,132 33,83,78,698 35,19,13,846 36,59,90,399
Outgoings (35% of Gross Revenue) 8,99,99,000 9,35,98,960 9,73,42,918 10,12,36,635 10,52,86,101 10,94,97,545 11,38,77,446 11,84,32,544 12,31,69,846 12,80,96,640
Inflow from Sale of Investment 90,00,00,000
Net Cash Inflow 16,71,41,000 17,38,26,640 18,07,79,706 18,80,10,894 19,55,31,330 20,33,52,583 21,14,86,686 21,99,46,154 22,87,44,000 1,13,78,93,760
Required Rate of Return 9%
Net Present Value 70,32,83,002
Yield Generated 36%
5) Assuming John Wiley Pty Ltd. sell the Facility for $900 million at the end of 10th
year of ownership (year 2031), the Net Present Value of sale generated (Base year
2021) after taking the Discount rate as 9% was 1052 million dollars.
6) The Net Present Value or Profit of the John Wiley Pty Limited was evaluated for the
year 2021 after incorporating the cash flows earned from the project each year.
Required Rate of Return 9%
Net Present Value 1,05,20,62,567
Yield Generated 39%
Particulars Year 1 Year 2 Year 3 Year 4 Year 5 Year 6 Year 7 Year 8 Year 9 Year 10
Revenue 25,71,40,000 25,71,40,000 26,74,25,600 27,81,22,624 28,92,47,529 30,08,17,430 31,28,50,127 32,53,64,132 33,83,78,698 35,19,13,846
Annual Escalation 0% 3.5% 3.5% 3.5% 3.5% 3.5% 3.5% 3.5% 3.5% 3.5%
Total Cash Flow 25,71,40,000 26,74,25,600 27,81,22,624 28,92,47,529 30,08,17,430 31,28,50,127 32,53,64,132 33,83,78,698 35,19,13,846 36,59,90,399
Outgoings (35% of Gross Revenue) 8,99,99,000 9,35,98,960 9,73,42,918 10,12,36,635 10,52,86,101 10,94,97,545 11,38,77,446 11,84,32,544 12,31,69,846 12,80,96,640
Inflow from Sale of Investment 90,00,00,000
Net Cash Inflow 16,71,41,000 17,38,26,640 18,07,79,706 18,80,10,894 19,55,31,330 20,33,52,583 21,14,86,686 21,99,46,154 22,87,44,000 1,13,78,93,760
Paraphrase This Document
Need a fresh take? Get an instant paraphrase of this document with our AI Paraphraser
10ENGINEERING MANAGEMENT
Part C
After a careful analysis of the various scenarios we found out scenario 1 to be more positive
as the same will create wealth for the company and yield better returns (Ng and Beruvides,
2015).
Part D
If the debt: equity ratio structure of the company changes from 80:20 to 50:50 the company
will be able to save the finance costs that is spent each year on the total development costs.
The interest rate @ 12% is too high for the company implying that the finance cost for the
company plays a dominant role (Donovan 2015). The change in the debt equity structure of
the company will also help the company reduce the financial risk of the project as the project
suffers from business risk due to operations in real estate sector which is highly correlated to
the macro economic conditions of an economy.
Part E
1) The possible risk associated with the project that may influence the development
personal of the project is the financial risk of the project, cost escalation in the project
and the correlation of the business activity with the macro economic conditions like
inflation. Annual maintenance costs and rate of escalation assumed for evaluation
assumed for the project are also crucial part as the growth rate in revenue may rise or
fall depending upon the demand and class of asset or project (Aizenman and Jinjarak
2014).
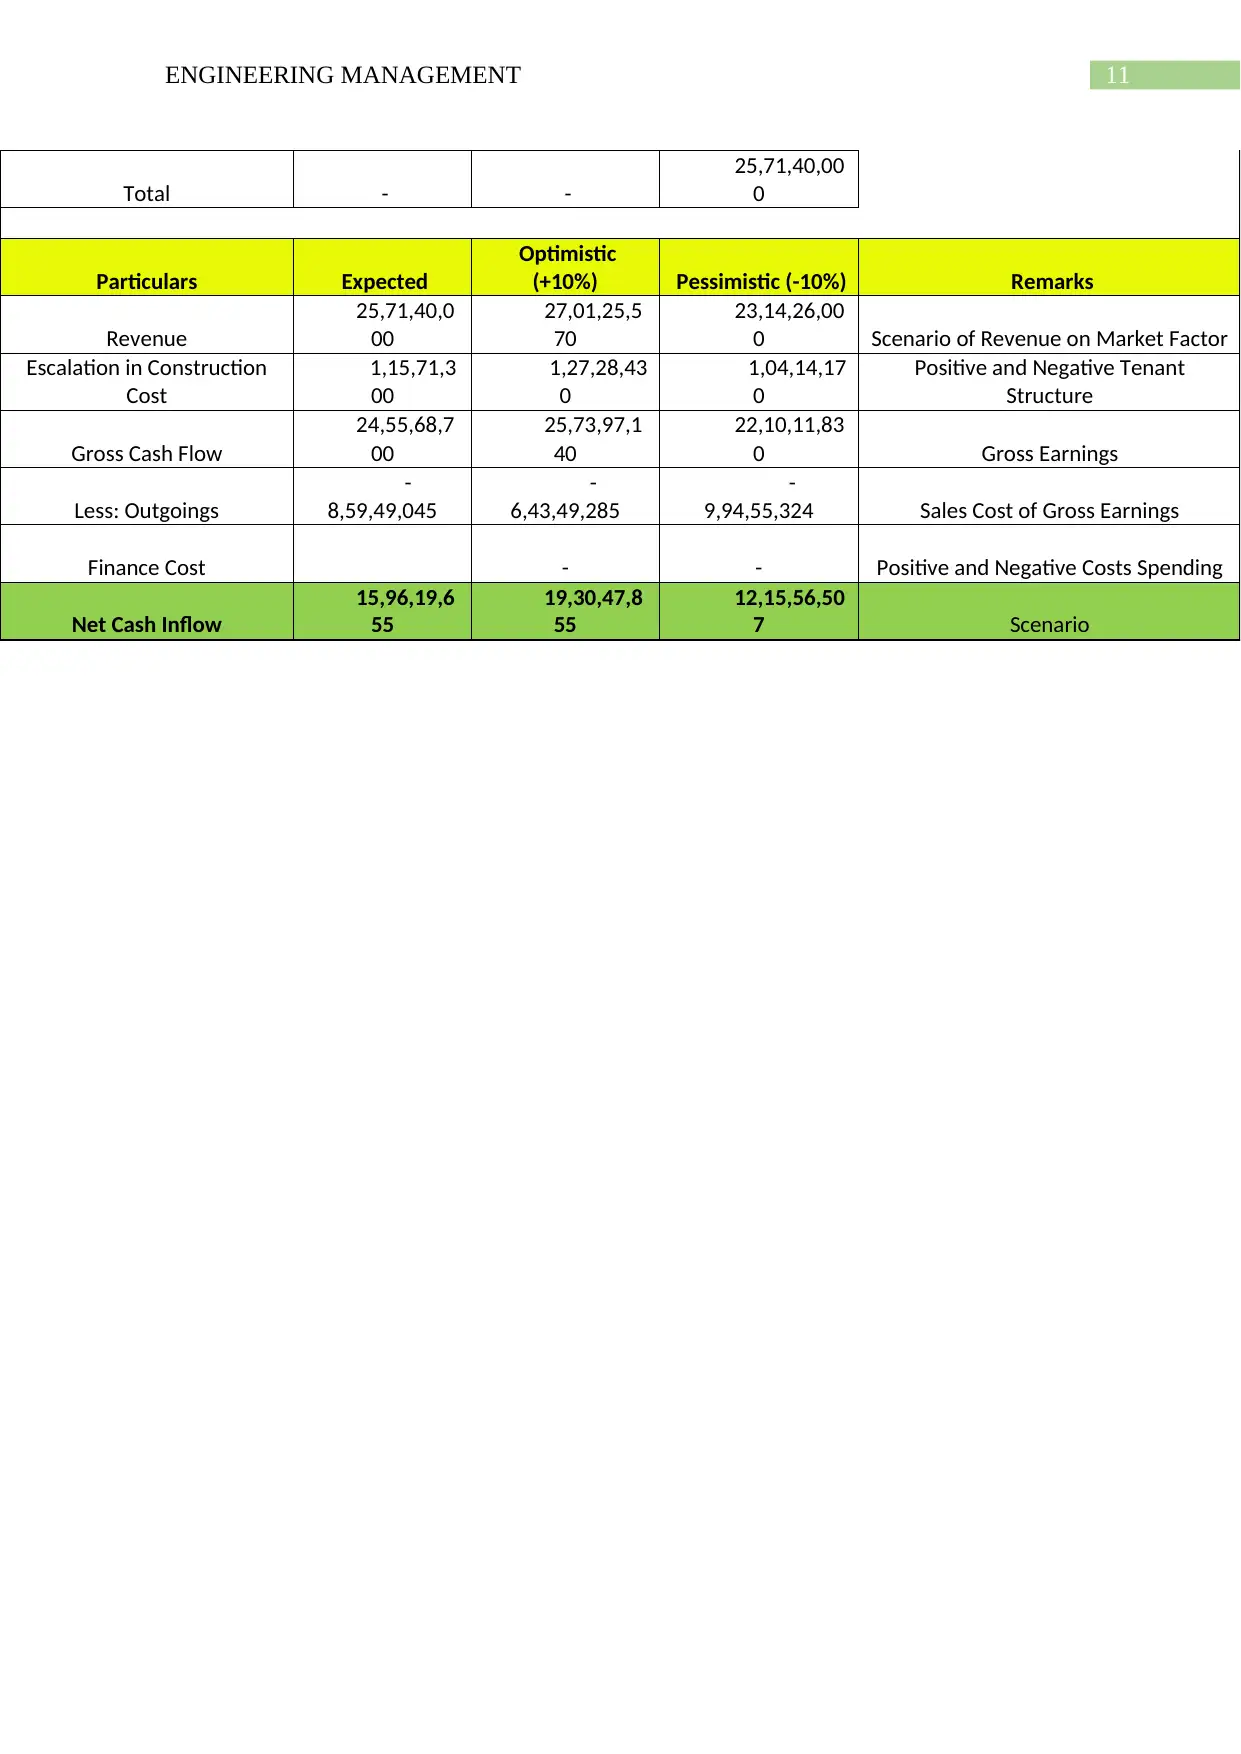
2) The three key risks that needs further evaluation is the financial risk, escalation of
costs and the inflation factor in the project (Aizenman and Jinjarak 2014).
3) Sensitivity Analysis.
Total Revenue
Particulars Square Feet Average Rate Amount
Part C
After a careful analysis of the various scenarios we found out scenario 1 to be more positive
as the same will create wealth for the company and yield better returns (Ng and Beruvides,
2015).
Part D
If the debt: equity ratio structure of the company changes from 80:20 to 50:50 the company
will be able to save the finance costs that is spent each year on the total development costs.
The interest rate @ 12% is too high for the company implying that the finance cost for the
company plays a dominant role (Donovan 2015). The change in the debt equity structure of
the company will also help the company reduce the financial risk of the project as the project
suffers from business risk due to operations in real estate sector which is highly correlated to
the macro economic conditions of an economy.
Part E
1) The possible risk associated with the project that may influence the development
personal of the project is the financial risk of the project, cost escalation in the project
and the correlation of the business activity with the macro economic conditions like
inflation. Annual maintenance costs and rate of escalation assumed for evaluation
assumed for the project are also crucial part as the growth rate in revenue may rise or
fall depending upon the demand and class of asset or project (Aizenman and Jinjarak
2014).
2) The three key risks that needs further evaluation is the financial risk, escalation of
costs and the inflation factor in the project (Aizenman and Jinjarak 2014).
3) Sensitivity Analysis.
Total Revenue
Particulars Square Feet Average Rate Amount
11ENGINEERING MANAGEMENT
Total - -
25,71,40,00
0
Particulars Expected
Optimistic
(+10%) Pessimistic (-10%) Remarks
Revenue
25,71,40,0
00
27,01,25,5
70
23,14,26,00
0 Scenario of Revenue on Market Factor
Escalation in Construction
Cost
1,15,71,3
00
1,27,28,43
0
1,04,14,17
0
Positive and Negative Tenant
Structure
Gross Cash Flow
24,55,68,7
00
25,73,97,1
40
22,10,11,83
0 Gross Earnings
Less: Outgoings
-
8,59,49,045
-
6,43,49,285
-
9,94,55,324 Sales Cost of Gross Earnings
Finance Cost - - Positive and Negative Costs Spending
Net Cash Inflow
15,96,19,6
55
19,30,47,8
55
12,15,56,50
7 Scenario
⊘ This is a preview!⊘
Do you want full access?
Subscribe today to unlock all pages.
Trusted by 1+ million students worldwide
1 out of 14


Your All-in-One AI-Powered Toolkit for Academic Success.
+13062052269
info@desklib.com
Available 24*7 on WhatsApp / Email
![[object Object]](/_next/static/media/star-bottom.7253800d.svg)
Unlock your academic potential
Copyright © 2020–2026 A2Z Services. All Rights Reserved. Developed and managed by ZUCOL.