Engineering Maths Assignment - Electrical Engineering Module
VerifiedAdded on 2022/08/10
|10
|1360
|33
Homework Assignment
AI Summary
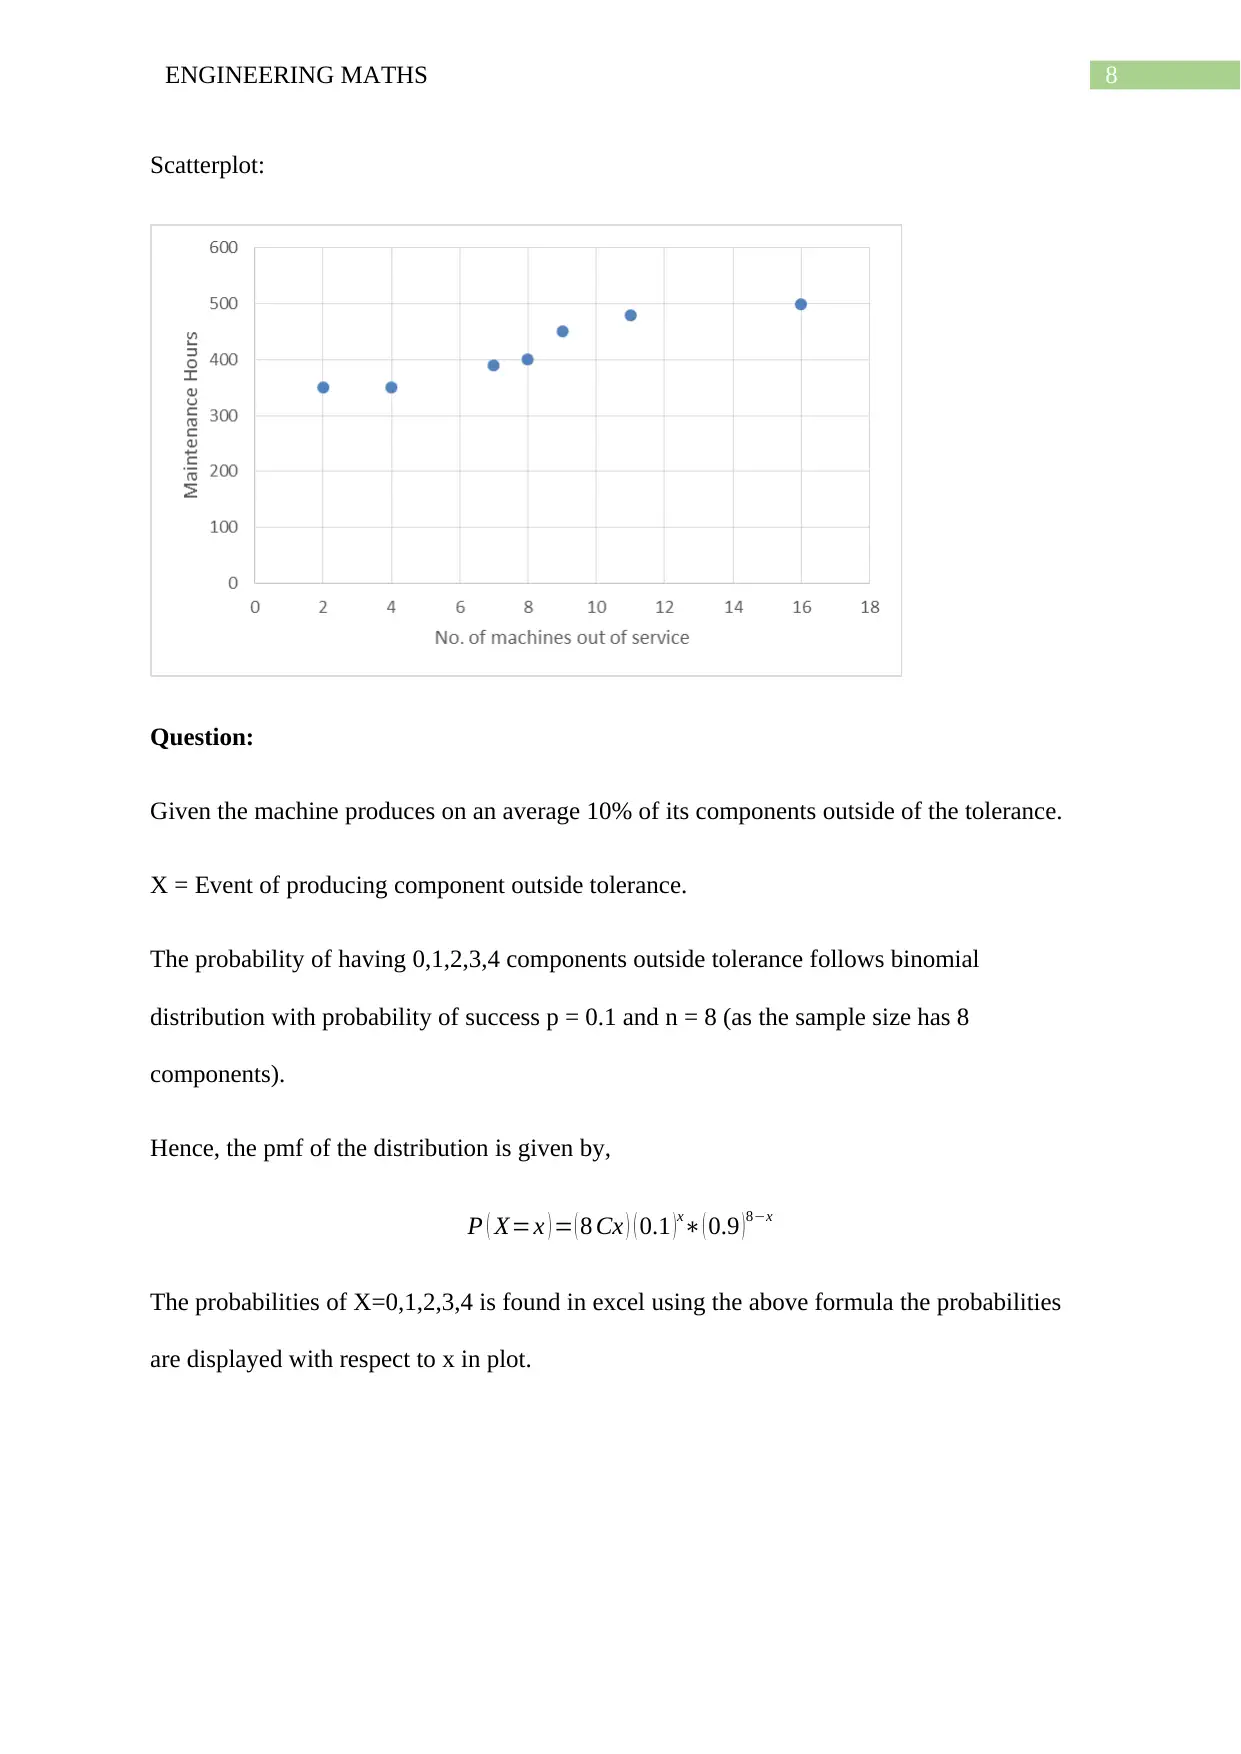
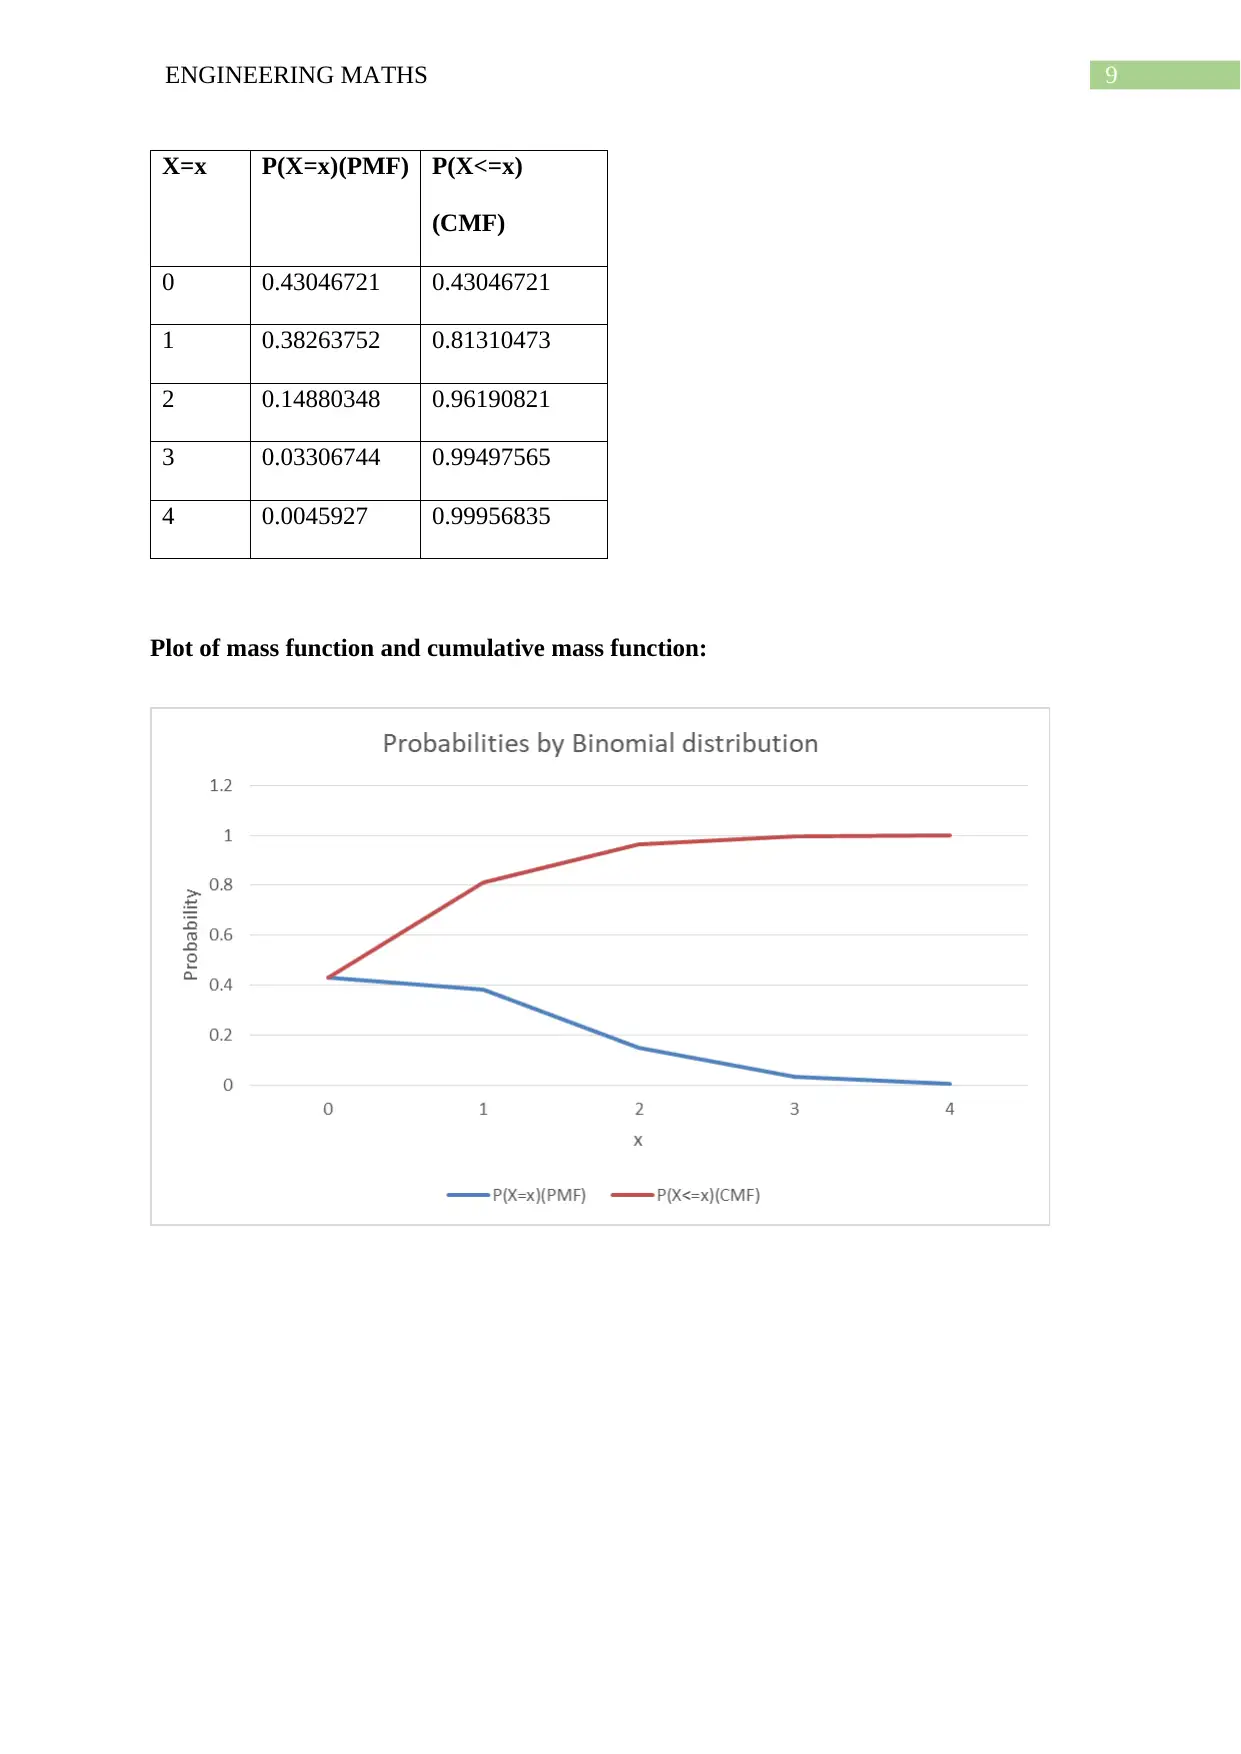
This document presents a comprehensive solution to an Engineering Maths assignment, tackling problems related to AC voltage analysis, vector algebra, and statistical analysis. The first task involves analyzing two sinusoidal voltage signals, determining their amplitudes, phases, frequencies, and p...
Read More
Contribute Materials
Your contribution can guide someone’s learning journey. Share your
documents today.

Running head: ENGINEERING MATHS
ENGINEERING MATHS
Name of the Student
Name of the University
Author Note
ENGINEERING MATHS
Name of the Student
Name of the University
Author Note
Secure Best Marks with AI Grader
Need help grading? Try our AI Grader for instant feedback on your assignments.

1ENGINEERING MATHS
Task 1:
Given, the composition of the AC voltage are two sinusoidal signals.
v1 = 122sin(100πt + 0.3492)
v2 = 178sin(100πt – 0.5238)
a. amplitude of v1 = 122
Phase of v1 = 0.3492 rad
Frequency = 100π/2π = 50 Hz.
Periodic time = 1/frequency = 1/50 = 20 msec.
Amplitude of v2 = 178
Phase of v2 = -0.5238 rad
Frequency = 100π/2π = 50 Hz.
Periodic time = 1/frequency = 1/50 = 20 msec.
b. The maximum amplitude for v1 is 122.
The time taken to reach maximum amplitude by v1 for first time
122sin(100πt + 0.3492) = 122
Sin(100πt + 0.3492) = 1
100πt + 0.3492 = 1.5708
100πt = 1.2216
t = 1.2216/(100π) = 0.0039 sec or 3.9 msec.
Similarly the time taken for v2 to reach 178 is

2ENGINEERING MATHS
178sin(100πt – 0.5238) = 178
sin(100πt – 0.5238) = 1
100πt – 0.5238 = 1.5708
100πt = 1.5708 + 0.5238
t = 0.0067 sec or 6.7 msec.
c. Now, voltage v1 first reach -50 volts at
122sin(100πt + 0.3492) = -50
sin(100πt + 0.3492) = -50/122
100πt + 0.3492 = asin(-50/122)
100πt + 0.3492 = π +0.42227
100πt = 3.56386
t = 0.0113 sec or 11.3 msec.
Now, voltage v2 first reach -50 volts at
178sin(100πt – 0.5238) = -50
sin(100πt – 0.5238) = -50/178
100πt – 0.5238 = asin(-50/178)
100πt – 0.5238 = π+0.28473
100πt = 3.95
t = 0.0126 or 12.6 msec.
d.
Now by compound angle formula
v1 = 122sin(100πt + 0.3492) = 122(sin(100πt)cos(0.3492) + cos(100πt)*sin(0.3492))

3ENGINEERING MATHS
= 114.637sin(100πt) + 41.742cos(100πt)
Hence, A = 114.637 and B = 41.742
v2 = 178sin(100πt – 0.5238) = 178(sin(100πt)cos(0.5238) – cos(100πt)*sin(0.5238))
= 154.135sin(100πt) -89.031cos(100πt)
e.
Now, v = v1 + v2 = 114.637sin(100πt) + 41.742cos(100πt) + 154.135sin(100πt) -
89.031cos(100πt) = 268.772sin(100πt) -47.289cos(100πt)
Now, comparing this to Rsin(100πt + α) gives
Rcos α = 268.772
And Rsin α = -47.289
tan α = -47.289/268.772
α = atan(-47.289/268.772) = -0.174
Hence, R = 268.772/ (cos(-0.174)) = 272.893
Hence, v1 + v2 = 272.893sin(100πt -0.174)
f.
Now, using excel the values of voltage signal is obtained as given below.
t 0 0.002 0.004 0.006 0.008 0.01 0.01
2
0.01
4
0.01
6
0.01
8
0.02
v1 41.74
184
101.1
517
121.9
251
96.12
724
33.61
202
-
41.74
-
101.
-
121.
-
96.1
-
33.6
41.74
184
Secure Best Marks with AI Grader
Need help grading? Try our AI Grader for instant feedback on your assignments.

4ENGINEERING MATHS
18 152 925 272 12
v2 -
89.03
1
18.57
044
119.0
786
174.1
028
162.6
257
89.03
102
-
18.5
704
-
119.
079
-
174.
103
-
162.
626
-
89.03
1
v1+
v2
-
47.28
92
119.7
222
241.0
037
270.2
301
196.2
377
47.28
918
-
119.
722
-
241.
004
-
270.
23
-
196.
238
-
47.28
92
g.
0 0.002 0.004 0.006 0.008 0.01 0.012 0.014 0.016 0.018 0.02
-300
-200
-100
0
100
200
300
Comparison of sinusoids
v1 v2 v1+v2
time (in sec)
Voltage amplitude (in volts)
The amplitude of the new signal as obtained in part e is 272.893 and the phase is -0.174.
h.
Now, using the answers from part e and f it can be stated that the summation of two sinusoids
is also a sinusoid with different amplitude and phase. The information of phase and amplitude

5ENGINEERING MATHS
and the characteristic of the resultant waveform can be obtained from the analytical as well as
simulation method and both gives approximately same results.
Task 2:
a.
Given, the
Point A = (0,-2,0)
Point B = (3,0,-2)
Point C = (a,b,0)
Hence, the distance AB = √ ( 3−0 ) 2+ ( 0+2 ) 2 + ( −2−0 ) 2 = √9+ 4+4 = √ 17 = 4.123.
b.
Now, given the direction of the vector BC is in the direction of 2i + 3.5j + k
Hence, angle between AB and BC should be equal to angle between AB and 2i + 3.5j + k.
Hence, cos(θ) = AB*(2,3.5,1)/(||AB||*||(2,3.5,1)||)
= ( 3,2,−2 ) (2,3.5,1)
(||3,2 ,−2||∗||2,3.5,1||)
= 6+7 – 2
√ 32+22 + ( −2 )
2
√ 22+3.52+ ( 1 )
2 = 11
√9+4 +4 √4+12.25+1 = 0.6424
θ = 0.8732 rad = 50.03 degrees
Thus the angle between the two vectors AB and BC is 50.03 degrees.
c.

6ENGINEERING MATHS
The point B lies on BC and the direction of BC is direction of vector d = 2i + 3.5j + k and this
vector is parallel to BC.
Hence, equation of vector in parametric form is
(x,y,z) = (3,0,-2) + t*(2,3.5,1) (where t is the parameter)
Now, given point C = (a,b,0)
Hence, C = B + t*d (a,b,0)
(a,b,0) = (3,0,-2) + t*(2,3.5,1)
Hence, this gives -2 + t = 0 => t = 2
a = 3 + 2t = 3 + 2*2 = 7
b = 0 + 3.5t = 3.5*2 = 7
Hence, a = 7 and b = 7.
Question:
Given, the data of occurrence of faults and the number of hours as worked by the
maintenance teams.
No. of machines out of
service
4 7 16 8 11 2 9
Maintenance Hours 350 390 500 400 480 350 450
Now, hypothesis testing of correlation coefficient is performed in following way.
Null hypothesis (H0): The correlation between the machines out of service and maintenance
hours is not significantly different from zero.
Paraphrase This Document
Need a fresh take? Get an instant paraphrase of this document with our AI Paraphraser

7ENGINEERING MATHS
Alternative hypothesis (H1): The correlation between the machines out of service and
maintenance hours is significantly different from zero.
As seen from the alternative hypothesis statement the test is a two tailed test and as the
correlation coefficient of population is unknown hence t test is applied. The considered
significance level of the test is 5% or 0.05.
Now, test statistics t = r∗ √ n−2
√ 1−r2
n = sample size = 7
r = sample correlation coefficient
Now, excel is used to calculate value of correlation coefficient r using CORREL function and
then the test statistics and corresponding p values are calculated using suitable excel formulas
as shown in the following table.
sample size (n) 7
Correlation coefficient r 0.948719156
test statistics (t) 6.71074076
p value 0.001112514
Decision Significant
Hence, it can be seen that the p value of the two tailed t test is very less than the chosen
significance level of 0.05, hence, there is sufficient evidence to reject the null hypothesis or it
can be concluded that there is significant correlation between the machines out of service and
maintenance hours.
The scatterplot also proves the high correlation between variables.

8ENGINEERING MATHS
Scatterplot:
Question:
Given the machine produces on an average 10% of its components outside of the tolerance.
X = Event of producing component outside tolerance.
The probability of having 0,1,2,3,4 components outside tolerance follows binomial
distribution with probability of success p = 0.1 and n = 8 (as the sample size has 8
components).
Hence, the pmf of the distribution is given by,
P ( X=x ) = ( 8 Cx ) ( 0.1 ) x∗ ( 0.9 ) 8−x
The probabilities of X=0,1,2,3,4 is found in excel using the above formula the probabilities
are displayed with respect to x in plot.

9ENGINEERING MATHS
X=x P(X=x)(PMF) P(X<=x)
(CMF)
0 0.43046721 0.43046721
1 0.38263752 0.81310473
2 0.14880348 0.96190821
3 0.03306744 0.99497565
4 0.0045927 0.99956835
Plot of mass function and cumulative mass function:
X=x P(X=x)(PMF) P(X<=x)
(CMF)
0 0.43046721 0.43046721
1 0.38263752 0.81310473
2 0.14880348 0.96190821
3 0.03306744 0.99497565
4 0.0045927 0.99956835
Plot of mass function and cumulative mass function:
1 out of 10

Your All-in-One AI-Powered Toolkit for Academic Success.
+13062052269
info@desklib.com
Available 24*7 on WhatsApp / Email
Unlock your academic potential
© 2024 | Zucol Services PVT LTD | All rights reserved.